

RNA-Seq-Based Breast Cancer Subtypes Classification Using Machine Learning Approaches
- PMID: 33178256
- PMCID: PMC7644310
- DOI: 10.1155/2020/4737969
RNA-Seq-Based Breast Cancer Subtypes Classification Using Machine Learning Approaches
Abstract
Background: Breast invasive carcinoma (BRCA) is not a single disease as each subtype has a distinct morphology structure. Although several computational methods have been proposed to conduct breast cancer subtype identification, the specific interaction mechanisms of genes involved in the subtypes are still incomplete. To identify and explore the corresponding interaction mechanisms of genes for each subtype of breast cancer can impose an important impact on the personalized treatment for different patients.
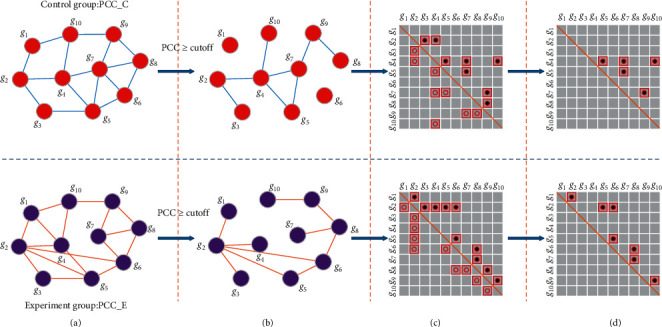
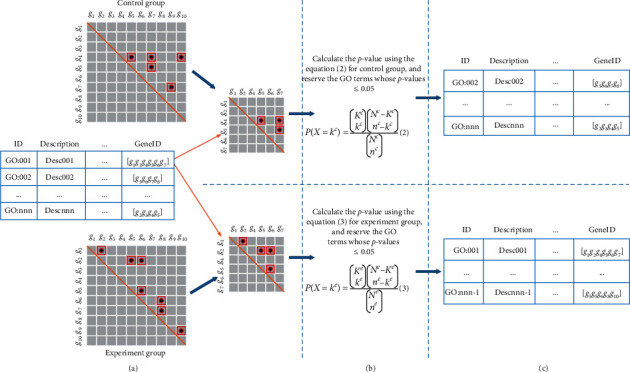
Methods: We integrate the biological importance of genes from the gene regulatory networks to the differential expression analysis and then obtain the weighted differentially expressed genes (weighted DEGs). A gene with a high weight means it regulates more target genes and thus holds more biological importance. Besides, we constructed gene coexpression networks for control and experiment groups, and the significantly differentially interacting structures encouraged us to design the corresponding Gene Ontology (GO) enrichment based on gene coexpression networks (GOEGCN). The GOEGCN considers the two-side distinction analysis between gene coexpression networks for control and experiment groups. The method allows us to study how the modulated coexpressed gene couples impact biological functions at a GO level.
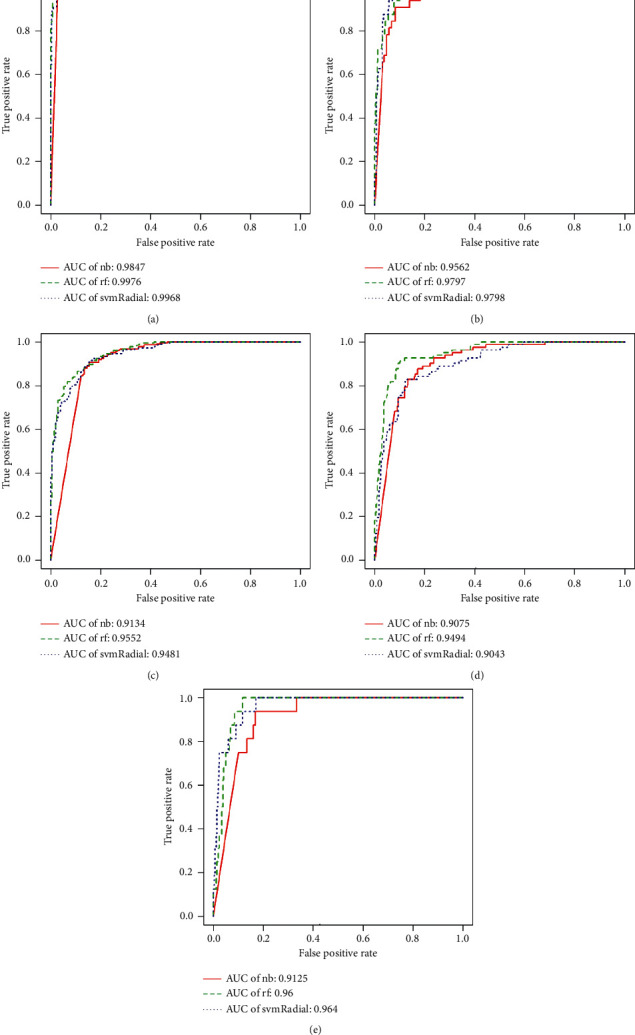
Results: We modeled the binary classification with weighted DEGs for each subtype. The binary classifier could make a good prediction for an unseen sample, and the experimental results validated the effectiveness of our proposed approaches. The novel enriched GO terms based on GOEGCN for control and experiment groups of each subtype explain the specific biological function changes according to the two-side distinction of coexpression network structures to some extent.
Conclusion: The weighted DEGs contain biological importance derived from the gene regulatory network. Based on the weighted DEGs, five binary classifiers were learned and showed good performance concerning the "Sensitivity," "Specificity," "Accuracy," "F1," and "AUC" metrics. The GOEGCN with weighted DEGs for control and experiment groups presented a novel GO enrichment analysis results and the novel enriched GO terms would further unveil the changes of specific biological functions among all the BRCA subtypes to some extent. The R code in this research is available at https://github.com/yxchspring/GOEGCN_BRCA_Subtypes.
Copyright © 2020 Zhezhou Yu et al.
Conflict of interest statement
The authors declare no conflicts of interest.
Figures
Similar articles
-
Investigation of genes and pathways involved in breast cancer subtypes through gene expression meta-analysis.Gene. 2022 May 5;821:146328. doi: 10.1016/j.gene.2022.146328. Epub 2022 Feb 16. Gene. 2022. PMID: 35181505
-
CONFIGURE: A pipeline for identifying context specific regulatory modules from gene expression data and its application to breast cancer.BMC Med Genomics. 2019 Jul 11;12(Suppl 5):97. doi: 10.1186/s12920-019-0515-6. BMC Med Genomics. 2019. PMID: 31296219 Free PMC article.
-
Identification of differentially expressed genes regulated by molecular signature in breast cancer-associated fibroblasts by bioinformatics analysis.Arch Gynecol Obstet. 2018 Jan;297(1):161-183. doi: 10.1007/s00404-017-4562-y. Epub 2017 Oct 23. Arch Gynecol Obstet. 2018. PMID: 29063236
-
A Review on Computational Analysis of Big Data in Breast Cancer for Predicting Potential Biomarkers.Curr Top Med Chem. 2022;22(21):1793-1810. doi: 10.2174/1568026622666220907121942. Curr Top Med Chem. 2022. PMID: 36082858 Review.
-
Approaches in Gene Coexpression Analysis in Eukaryotes.Biology (Basel). 2022 Jul 6;11(7):1019. doi: 10.3390/biology11071019. Biology (Basel). 2022. PMID: 36101400 Free PMC article. Review.
Cited by
-
Oncogenic and Tumor Suppressive Components of the Cell Cycle in Breast Cancer Progression and Prognosis.Pharmaceutics. 2021 Apr 17;13(4):569. doi: 10.3390/pharmaceutics13040569. Pharmaceutics. 2021. PMID: 33920506 Free PMC article. Review.
-
Artificial Intelligence in Bulk and Single-Cell RNA-Sequencing Data to Foster Precision Oncology.Int J Mol Sci. 2021 Apr 27;22(9):4563. doi: 10.3390/ijms22094563. Int J Mol Sci. 2021. PMID: 33925407 Free PMC article. Review.
-
Non-Coding Transcriptome Provides Novel Insights into the Escherichia coli F17 Susceptibility of Sheep Lamb.Biology (Basel). 2022 Feb 22;11(3):348. doi: 10.3390/biology11030348. Biology (Basel). 2022. PMID: 35336723 Free PMC article.
-
PSOWNNs-CNN: A Computational Radiology for Breast Cancer Diagnosis Improvement Based on Image Processing Using Machine Learning Methods.Comput Intell Neurosci. 2022 May 11;2022:5667264. doi: 10.1155/2022/5667264. eCollection 2022. Comput Intell Neurosci. 2022. PMID: 35602611 Free PMC article.
-
Value of genomics- and radiomics-based machine learning models in the identification of breast cancer molecular subtypes: a systematic review and meta-analysis.Ann Transl Med. 2022 Dec;10(24):1394. doi: 10.21037/atm-22-5986. Ann Transl Med. 2022. PMID: 36660694 Free PMC article.
References
MeSH terms
LinkOut - more resources
Full Text Sources
Medical
