

Modelling the Potential Impact of Social Distancing on the COVID-19 Epidemic in South Africa
- PMID: 33178332
- PMCID: PMC7647790
- DOI: 10.1155/2020/5379278
Modelling the Potential Impact of Social Distancing on the COVID-19 Epidemic in South Africa
Abstract
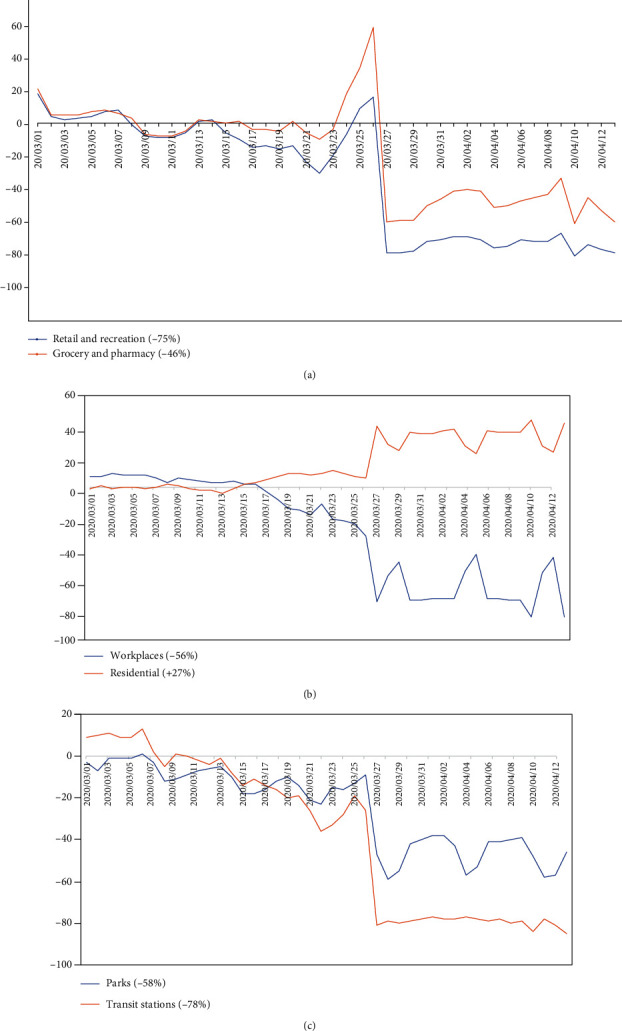
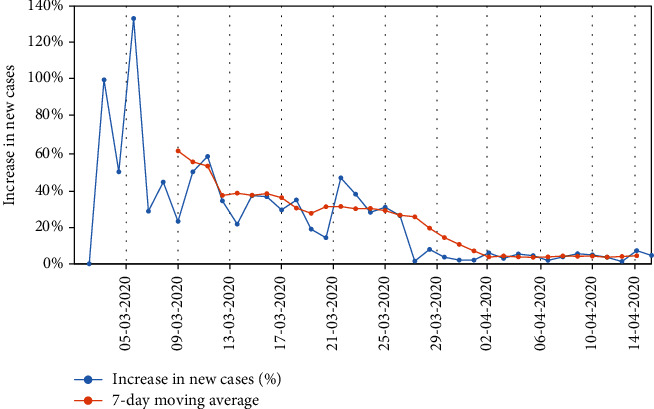
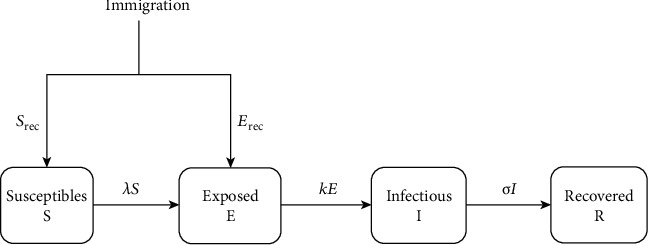
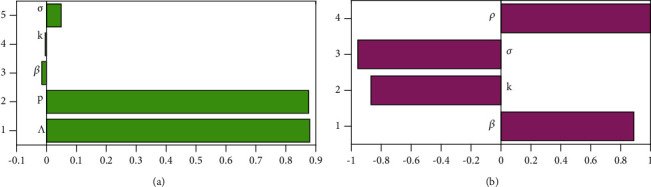
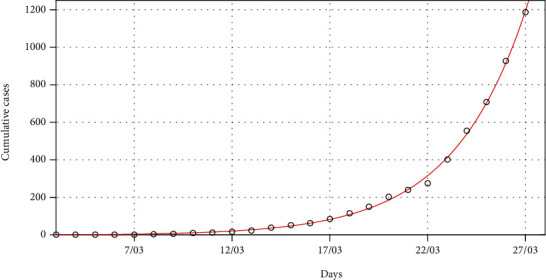
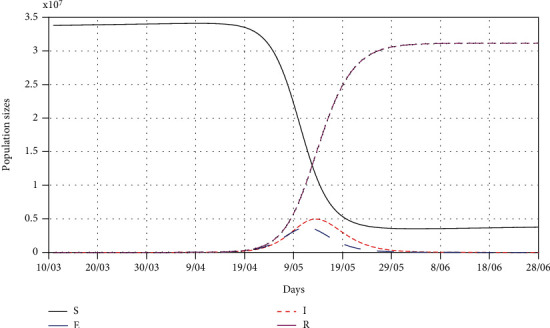
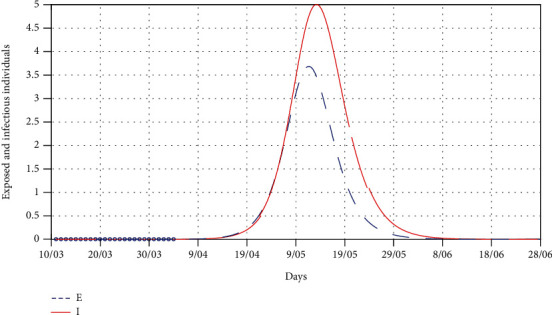
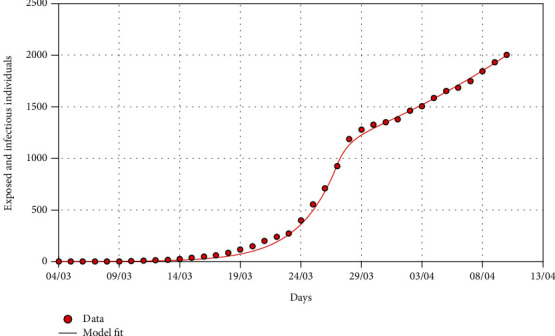
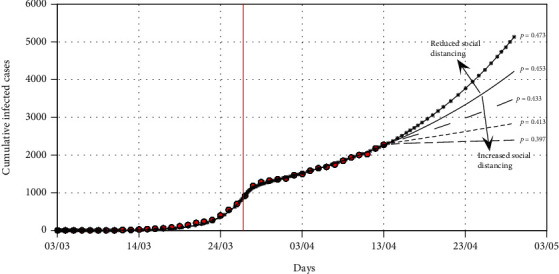
The novel coronavirus (COVID-19) pandemic continues to be a global health problem whose impact has been significantly felt in South Africa. With the global spread increasing and infecting millions, containment efforts by countries have largely focused on lockdowns and social distancing to minimise contact between persons. Social distancing has been touted as the best form of response in managing a rapid increase in the number of infected cases. In this paper, we present a deterministic model to describe the impact of social distancing on the transmission dynamics of COVID-19 in South Africa. The model is fitted to data from March 5 to April 13, 2020, on the cumulative number of infected cases, and a scenario analysis on different levels of social distancing is presented. The model shows that with the levels of social distancing under the initial lockdown level between March 26 and April 13, 2020, there would be a projected continued rise in the number of infected cases. The model also looks at the impact of relaxing the social distancing measures after the initial announcement of the lockdown. It is shown that relaxation of social distancing by 2% can result in a 23% rise in the number of cumulative cases whilst an increase in the level of social distancing by 2% would reduce the number of cumulative cases by about 18%. The model results accurately predicted the number of cases after the initial lockdown level was relaxed towards the end of April 2020. These results have implications on the management and policy direction in the early phase of the epidemic.
Copyright © 2020 F. Nyabadza et al.
Conflict of interest statement
Authors declare no conflict of interest.
Figures
Similar articles
-
Modeling the transmission dynamics of the COVID-19 Pandemic in South Africa.Math Biosci. 2020 Oct;328:108441. doi: 10.1016/j.mbs.2020.108441. Epub 2020 Aug 4. Math Biosci. 2020. PMID: 32763338 Free PMC article.
-
A versatile web app for identifying the drivers of COVID-19 epidemics.J Transl Med. 2021 Mar 16;19(1):109. doi: 10.1186/s12967-021-02736-2. J Transl Med. 2021. PMID: 33726787 Free PMC article.
-
Determining the level of social distancing necessary to avoid future COVID-19 epidemic waves: a modelling study for North East London.Sci Rep. 2021 Mar 11;11(1):5806. doi: 10.1038/s41598-021-84907-1. Sci Rep. 2021. PMID: 33707546 Free PMC article.
-
Setting up and relaxation of public health social and physical distancing measures for COVID-19: a rapid review.Pan Afr Med J. 2020 Jun 12;35(Suppl 2):76. doi: 10.11604/pamj.supp.2020.35.2.23463. eCollection 2020. Pan Afr Med J. 2020. PMID: 33623600 Free PMC article. Review.
-
Effect of national and local lockdowns on the control of COVID-19 pandemic: a rapid review.Epidemiol Prev. 2020 Sep-Dec;44(5-6 Suppl 2):60-68. doi: 10.19191/EP20.5-6.S2.104. Epidemiol Prev. 2020. PMID: 33412795 Review. English.
Cited by
-
Life under lockdown: Illustrating tradeoffs in South Africa's response to COVID-19.World Dev. 2021 Jan;137:105168. doi: 10.1016/j.worlddev.2020.105168. Epub 2020 Aug 28. World Dev. 2021. PMID: 32895596 Free PMC article.
-
A vaccination model for COVID-19 in Gauteng, South Africa.Infect Dis Model. 2022 Sep;7(3):333-345. doi: 10.1016/j.idm.2022.06.002. Epub 2022 Jun 9. Infect Dis Model. 2022. PMID: 35702698 Free PMC article.
-
Assessing the potential impact of COVID-19 Omicron variant: Insight through a fractional piecewise model.Results Phys. 2022 Jul;38:105652. doi: 10.1016/j.rinp.2022.105652. Epub 2022 May 30. Results Phys. 2022. PMID: 35663799 Free PMC article.
-
Determinants of Social Distancing Among South Africans From 12 Days Into the COVID-19 Lockdown: A Cross Sectional Study.Front Public Health. 2021 May 24;9:632619. doi: 10.3389/fpubh.2021.632619. eCollection 2021. Front Public Health. 2021. PMID: 34109143 Free PMC article.
-
On the reliability of predictions on Covid-19 dynamics: A systematic and critical review of modelling techniques.Infect Dis Model. 2021;6:258-272. doi: 10.1016/j.idm.2020.12.008. Epub 2021 Jan 12. Infect Dis Model. 2021. PMID: 33458453 Free PMC article.
References
-
- Frequently asked questions about Covid-19. March 2020, https://www.westerncape.gov.za/department-of-health/frequently-asked-que....
-
- Q&A on coronaviruses (COVID-19) April 2020, https://www.who.int/news-room/q-a-detail/q-a-coronaviruses.
MeSH terms
LinkOut - more resources
Full Text Sources
Medical
Miscellaneous
