. 2020 Oct 16:10:558596.
doi: 10.3389/fonc.2020.558596. eCollection 2020.

Development and Validation of Autophagy-Related Gene Signature and Nomogram for Predicting Survival in Oral Squamous Cell Carcinoma

Affiliations

Development and Validation of Autophagy-Related Gene Signature and Nomogram for Predicting Survival in Oral Squamous Cell Carcinoma

Chen Hou et al. Front Oncol. .

Abstract

Background: Autophagy, a highly conserved self-digesting process, has been deeply involved in the development and progression of oral squamous cell carcinoma (OSCC). However, the prognostic value of autophagy-related genes (ARGs) for OSCC still remains unclear. Our study set out to develop a multigene expression signature based on ARGs for individualized prognosis assessment in OSCC patients.

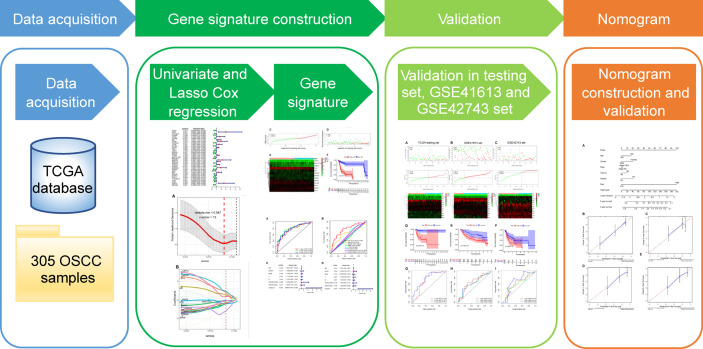
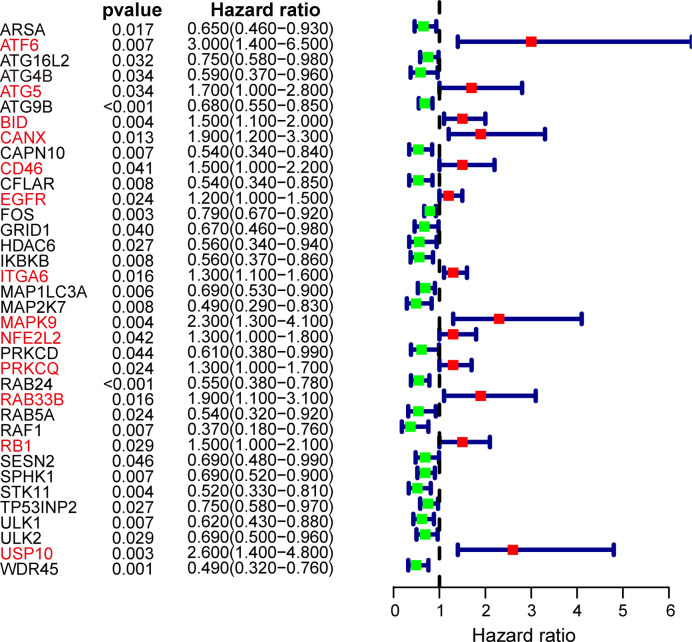
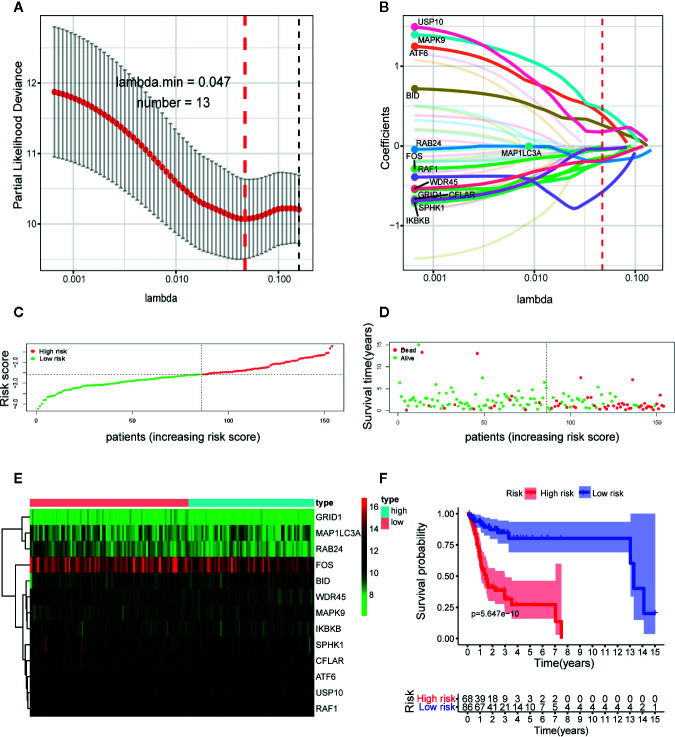
Methods: Based on The Cancer Genome Atlas (TCGA) database, we identified prognosis-related ARGs through univariate COX regression analysis. Then we performed the least absolute shrinkage and selection operator (LASSO) regression analysis to identify an optimal autophagy-related multigene signature with the subsequent validation in testing set, GSE41613 and GSE42743 datasets.

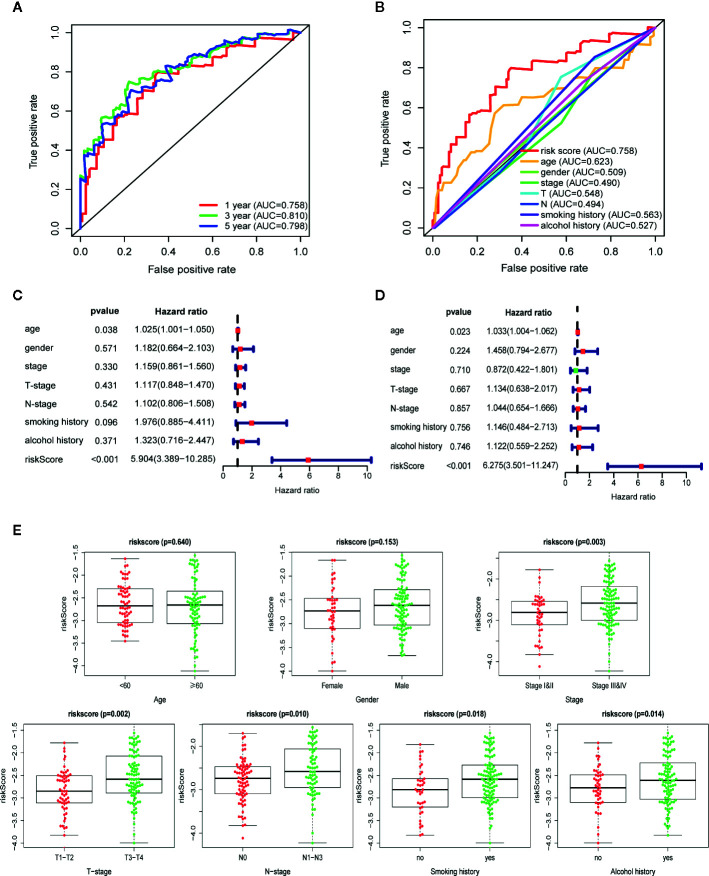
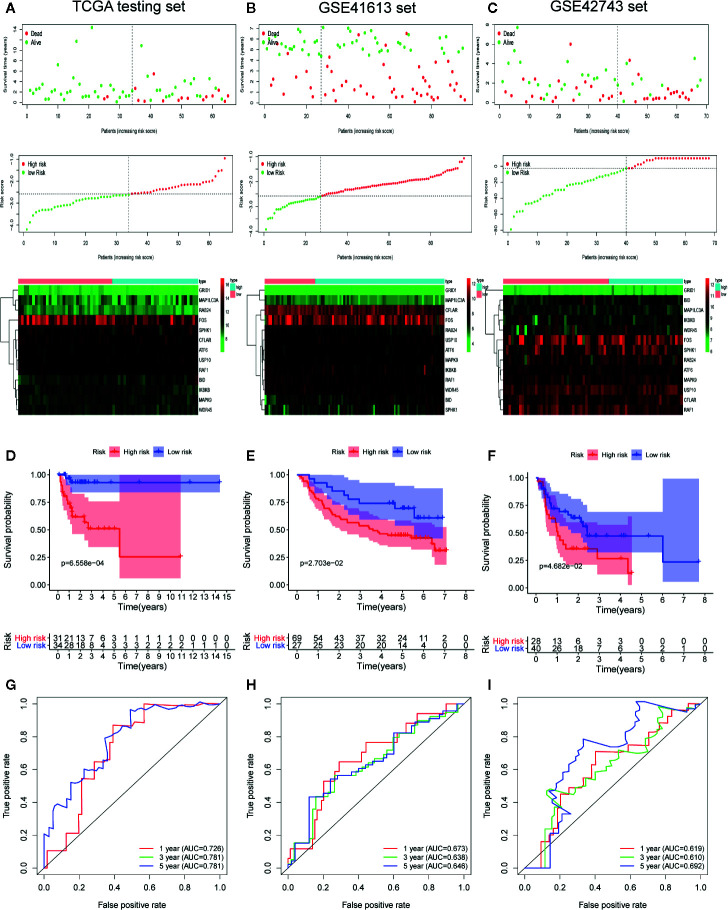
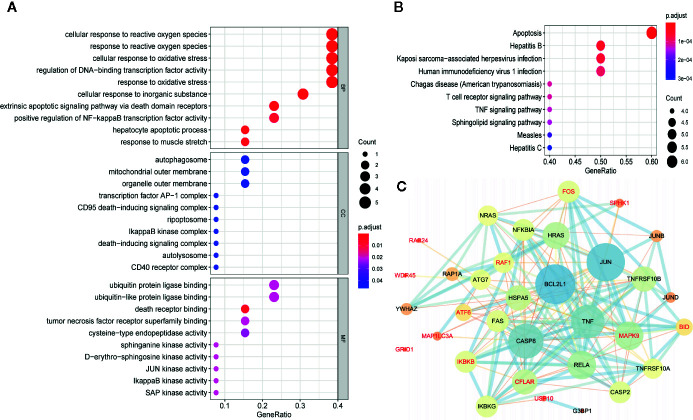
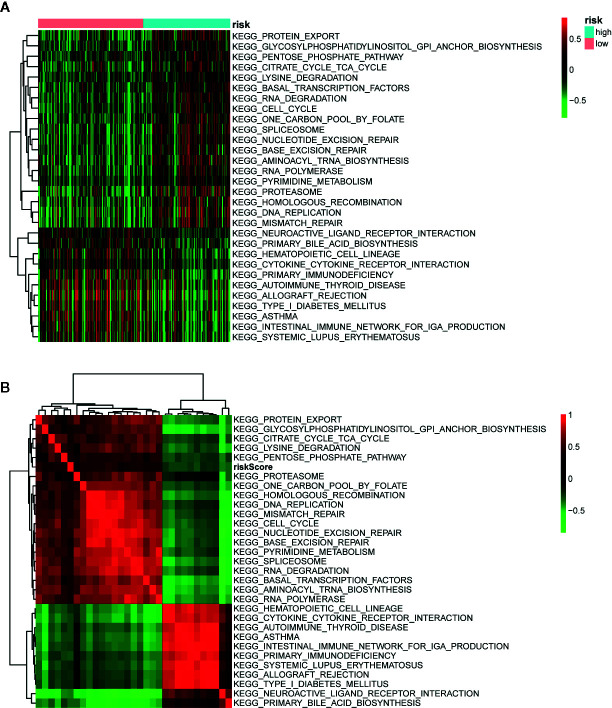
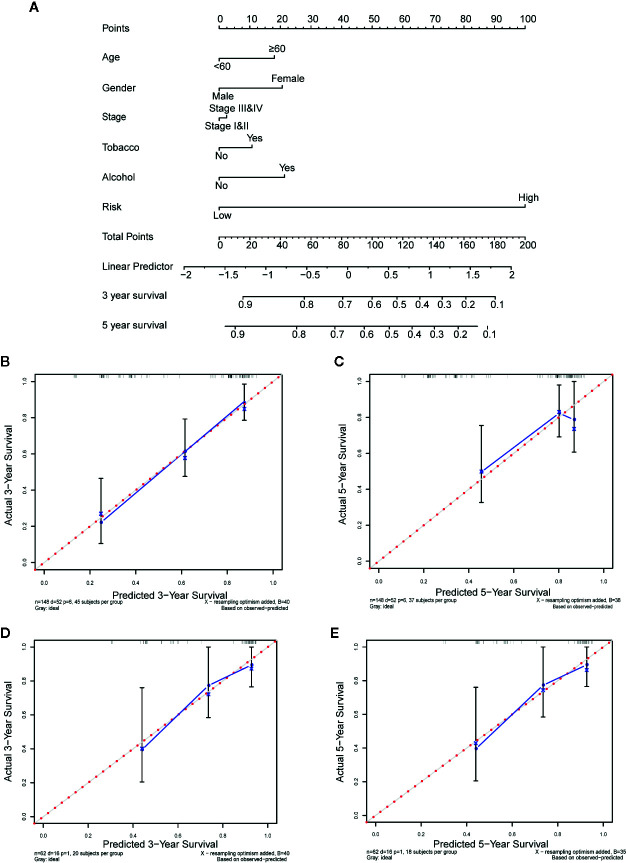
Results: We identified 36 prognosis-related ARGs for OSCC. Subsequently, the multigene signature based on 13 prognostic ARGs was constructed and successfully divided OSCC patients into low and high-risk groups with significantly different overall survival in TCGA training set (p < 0.0001). The autophagy signature remained as an independent prognostic factor for OSCC in univariate and multivariate Cox regression analyses. The area under the curve (AUC) values of the receiver operating characteristic (ROC) curves for 1, 3, and 5-year survival were 0.758, 0.810, 0.798, respectively. Then the gene signature was validated in TCGA testing set, GSE41613 and GSE42743 datasets. Moreover, Gene Ontology (GO), Kyoto Encyclopedia of Genes and Genomes (KEGG) analysis, and single-sample gene set enrichment analysis (ssGSEA) revealed the underlying biological characteristics and signaling pathways associated with this signature in OSCC. Finally, we constructed a nomogram by combining the gene signature with multiple clinical parameters (age, gender, TNM-stage, tobacco, and alcohol history). The concordance index (C-index) and calibration plots demonstrated favorable predictive performance of our nomogram.

Conclusion: In summary, we identified and verified a 13-ARGs prognostic signature and nomogram, which provide individualized prognosis evaluation and show insight for potential therapeutic targets for OSCC.

Keywords: The Cancer Genome Atlas; autophagy-related genes; gene signature; nomogram; oral squamous cell carcinoma; prognosis.


Figures

Figure 1
Figure 1
The workflow of the study for constructing the autophagy-related prognostic signature and nomogram in oral squamous cell carcinoma. TCGA, The Cancer Genome Atlas; OSCC, oral squamous cell carcinoma; LASSO, the least absolute shrinkage and selection operator.
Figure 2
Figure 2
Forest plot of autophagy-related genes (ARGs) associated with OSCC survival. Genes in red font represent risk genes and in black font represent protective genes. Hazard ratios and 95% confidence intervals were calculated using univariate Cox regression analysis.
Figure 3
Figure 3
Construction of the autophagy-related gene signature in The Cancer Genome Atlas (TCGA) training set by the least absolute shrinkage and selection operator (LASSO) regression analysis for predicting OSCC patients’ overall survival. (A) Selection of the optimal parameter (lambda) in the LASSO model. (B) LASSO coefficient profiles of the 13 prognostic autophagy-related genes (ARGs). A coefficient profile plot was generated against the log (lambda) sequence. Distribution of risk score (C) and life status, survival time (D) of patients in training set. The risk scores are arranged in ascending order from left to right and each dot indicates an individual in training set. The black dotted line is the optimum cutoff dividing patients into low and high-risk groups. (E) Heat map of the expression profile of the included ARGs. The colors from green to red indicate the expression level from low to high. (F) Kaplan-Meier analysis of OSCC patients stratified by the cut-off risk score value. p-value was calculated by log-rank test.
Figure 4
Figure 4
Autophagy-related gene signature shows good predictive performance in The Cancer Genome Atlas (TCGA) training set. (A) The receiver operating characteristic (ROC) curves of the prognostic signature for 1-, 3-, and 5-year survival. (B) ROC curves of the prognostic signature and clinical risk factors for 1-year survival. Forest plots of univariate (C) and multivariate (D) Cox regression analyses involving the risk score and clinical risk factors. (E) Clinical significance of the prognostic signature in TCGA training set. Risk score in different age, gender, tumor stage, T-stage, N-stage, smoking history, and alcohol history. p-values were calculated by two-sided t test.
Figure 5
Figure 5
Internal and external validation of the prognostic value of the autophagy-related gene signature in The Cancer Genome Atlas (TCGA) testing set, GSE41613 set and GSE42743 set. (A–C) The distribution of survival time, life status, risk score, and the prognostic 13-ARGs expression patterns in testing set (A), GSE41613 (B), and GSE42743 set (C). The risk scores are arranged in ascending order from left to right and each dot indicates an oral squamous cell carcinoma (OSCC) individual. The black dotted line is the optimum cutoff dividing patients into low and high-risk groups. The colors from green to red in heatmap indicate the expression level from low to high. (D–F) Kaplan-Meier plots compare overall survival between patients in low and high-risk groups in testing set (D), GSE41613 (E), and GSE42743 set (F). (G–I) The receiver operating characteristic (ROC) curves of the prognostic signature for 1-, 3-, and 5-year survival in testing set (G), GSE41613 (H), and GSE42743 set (I). Only two curves are plotted in panel (G) owing to the coincidence of ROC curves for 3- and 5-year survival. p-values were calculated by log-rank test.
Figure 6
Figure 6
Gene functional enrichment analysis and protein-protein interaction (PPI) network of the 13 autophagy-related genes (ARGs) in the prognostic gene signature. (A) GO enrichment analysis of the 13 prognostic ARGs. The y‐axis stands for significantly enriched GO terms, and the x‐axis stands for the different gene ratio. (B) KEGG pathway enrichment analysis of the 13 prognostic ARGs. The y‐axis represents significantly enriched KEGG pathways, and the x‐axis represents different gene ratio. (C) Proteins interacted with the 13 prognostic ARGs (red font). A large node means a higher interaction degree and a thicker line indicates a stronger data support. BP, biological processes; CC, cellular components; MF, molecular functions.
Figure 7
Figure 7
Pathway profiles and correlation analysis across The Cancer Genome Atlas (TCGA) training set. (A) Pathway profiles of training set. Rows and columns represent pathways and patients, respectively. Each cell represents an enrichment score of pathway activity calculated by single-sample gene-set enrichment analysis (ssGSEA) and the colors from green to red indicate the enrichment score from low to high. The red and blue bars stand for low and high-risk groups, respectively. (B) Pearson’s correlation analysis of the risk score and pathways. Each cell of the heatmap represents a correlation coefficient and the colors from green to red indicate the correlation coefficient from negative to positive.
Figure 8
Figure 8
Nomogram to predict the 3-, and 5-year survival probability of oral squamous cell carcinoma (OSCC) patients. (A) Prognostic nomogram for predicting overall survival (OS) of OSCC patients based on The Cancer Genome Atlas (TCGA) training set. (B, C) The calibration plots for predicting 3-year (B) and 5-year survival (C) in training set. (D, E) The calibration plots for predicting 3-year (D) and 5-year survival (E) in testing set. Nomogram-predicted survival and actual survival were plotted on the x-axis and y-axis, respectively. The red dotted line represents the best prediction and the blue solid line represents the nomogram-prediction. The vertical bars represent a 95% confidence interval.

Similar articles

Cited by

References

    1. Bray F, Ferlay J, Soerjomataram I, Siegel RL, Torre LA, Jemal A. Global cancer statistics 2018: GLOBOCAN estimates of incidence and mortality worldwide for 36 cancers in 185 countries. CA: Cancer J Clin (2018) 68(6):394–424. 10.3322/caac.21492 - DOI - PubMed
    1. Rivera C, Venegas B. Histological and molecular aspects of oral squamous cell carcinoma (Review). Oncol Lett (2014) 8(1):7–11. 10.3892/ol.2014.2103 - DOI - PMC - PubMed
    1. Mehrtash H, Duncan K, Parascandola M, David A, Gritz ER, Gupta PC, et al. Defining a global research and policy agenda for betel quid and areca nut. Lancet Oncol (2017) 18(12):e767–e75. 10.1016/s1470-2045(17)30460-6 - DOI - PubMed
    1. Warnakulasuriya S. Causes of oral cancer–an appraisal of controversies. Br Dental J (2009) 207(10):471–5. 10.1038/sj.bdj.2009.1009 - DOI - PubMed
    1. Winn DM, Lee YC, Hashibe M, Boffetta P. The INHANCE consortium: toward a better understanding of the causes and mechanisms of head and neck cancer. Oral Dis (2015) 21(6):685–93. 10.1111/odi.12342 - DOI - PubMed

LinkOut - more resources