

Aberrant RNA Splicing Events Driven by Mutations of RNA-Binding Proteins as Indicators for Skin Cutaneous Melanoma Prognosis
- PMID: 33178596
- PMCID: PMC7593665
- DOI: 10.3389/fonc.2020.568469
Aberrant RNA Splicing Events Driven by Mutations of RNA-Binding Proteins as Indicators for Skin Cutaneous Melanoma Prognosis
Abstract
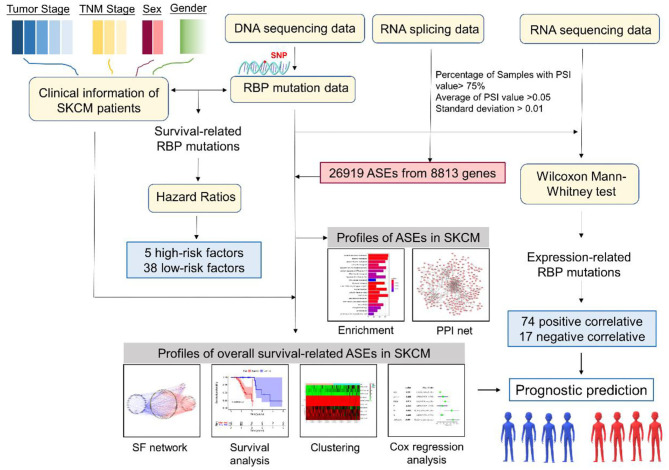
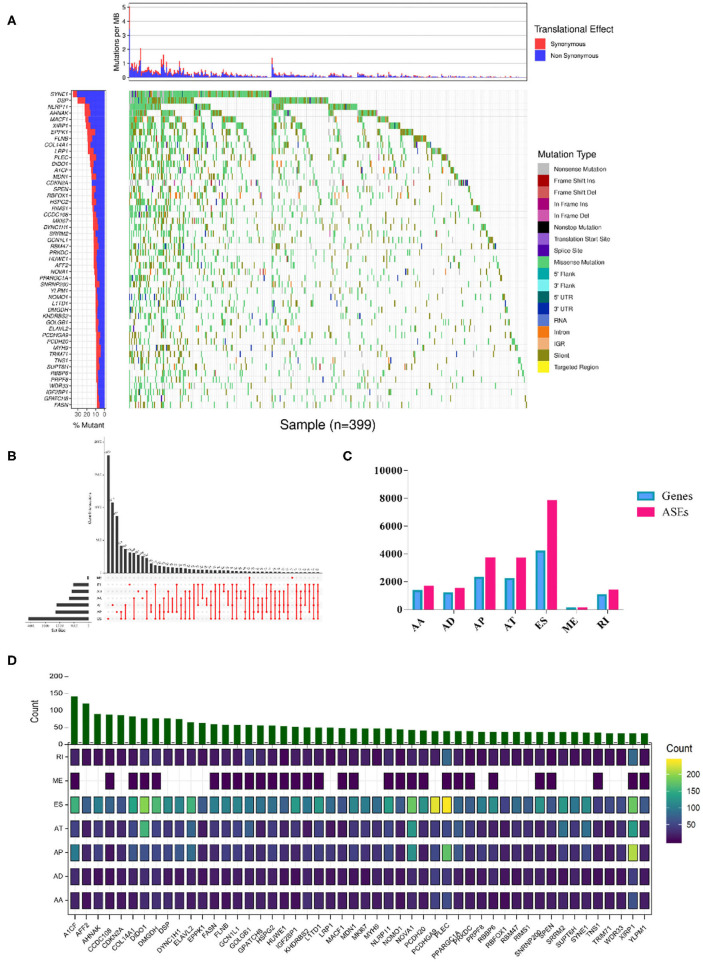
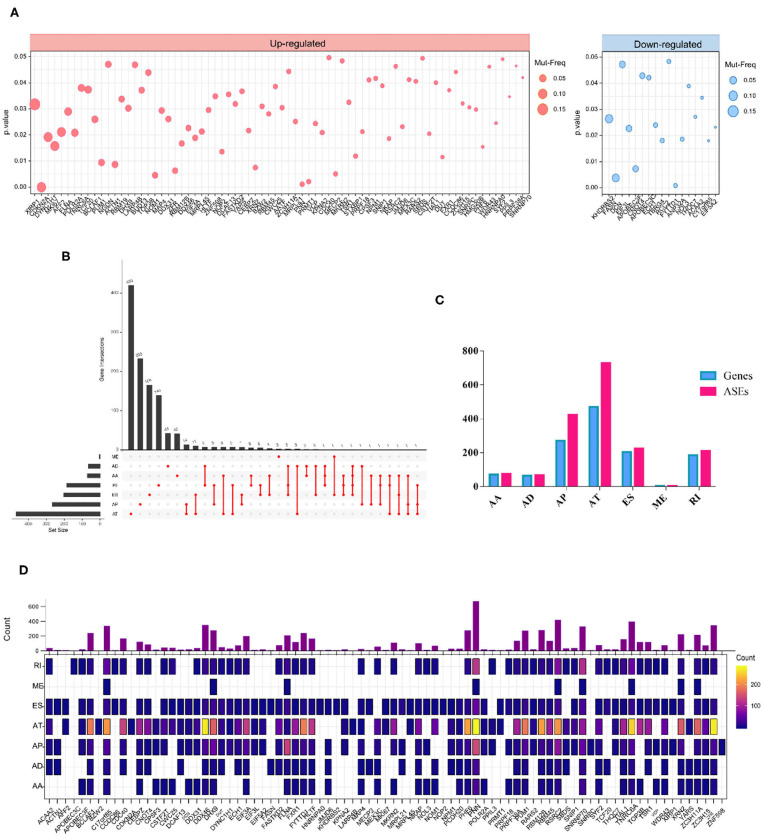
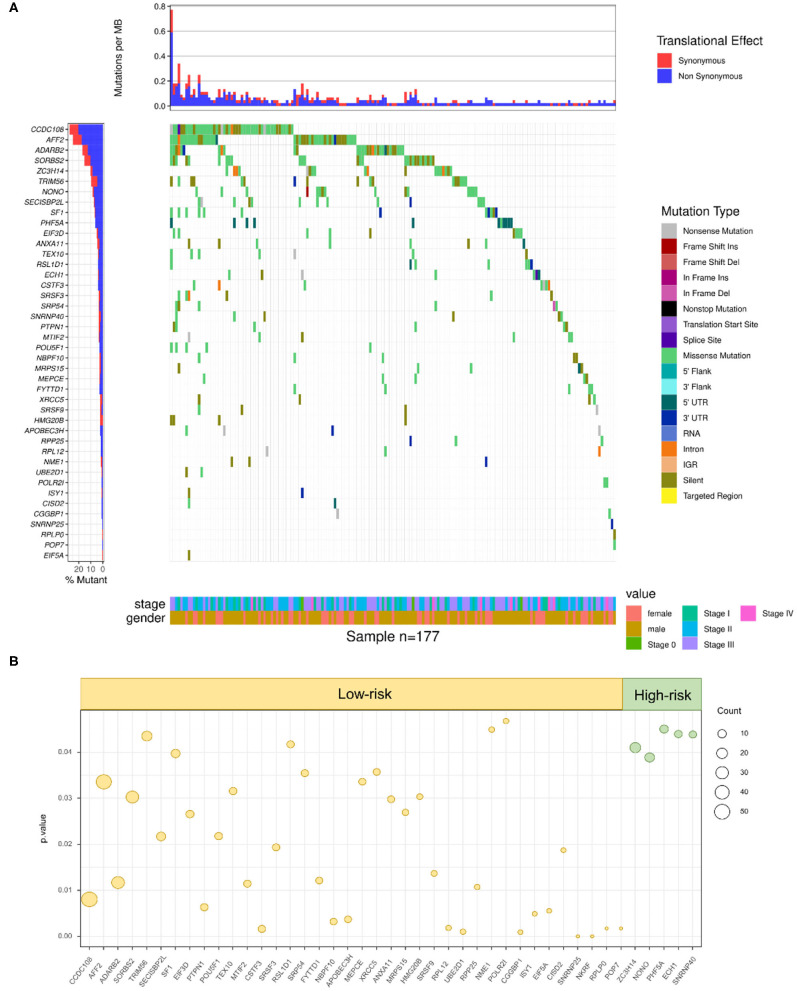
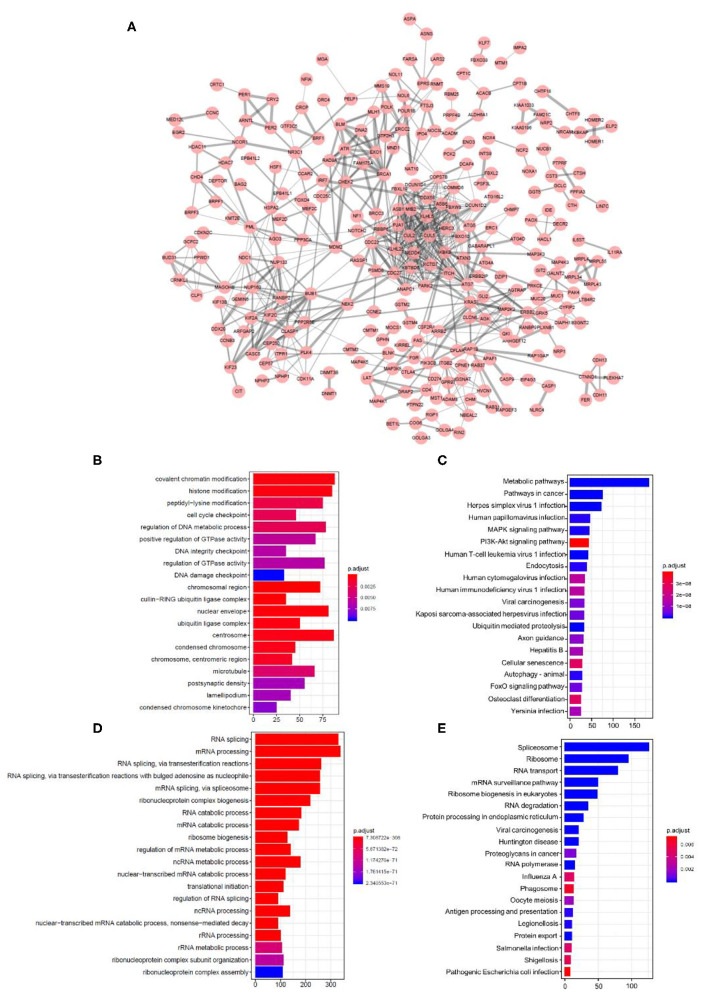
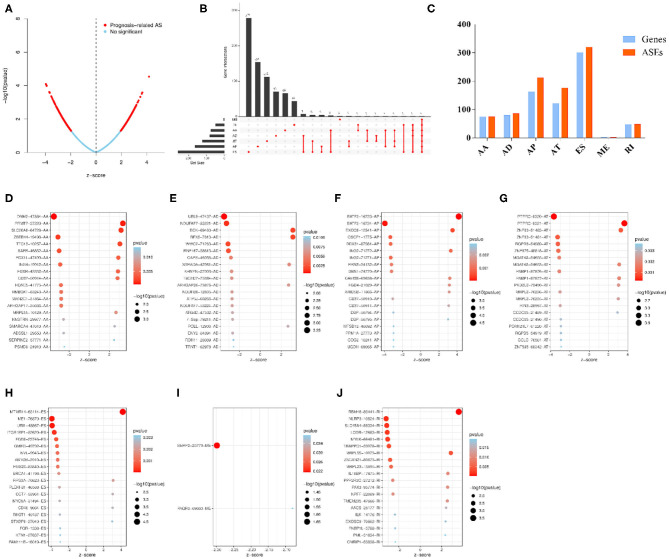
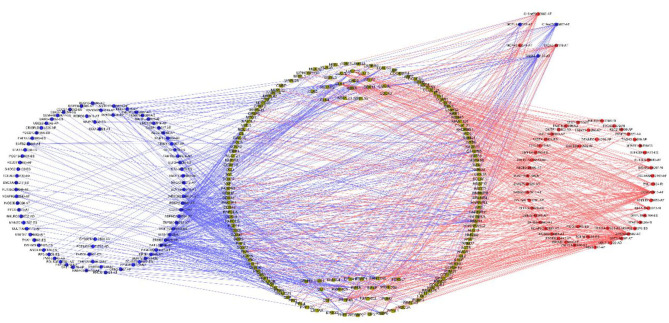
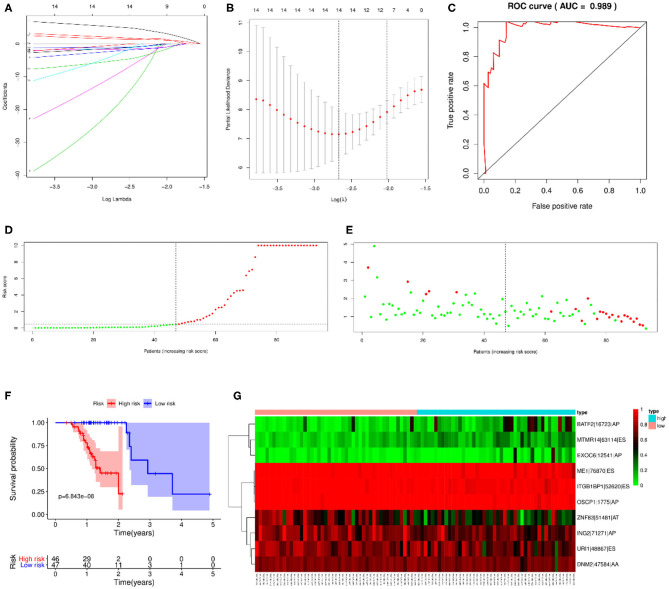
The worldwide incidence of skin cutaneous melanoma (SKCM) is increasing at a more rapid rate than other tumors. Aberrant alternative splicing (AS) is found to be common in cancer; however, how this process contributes to cancer prognosis still remains largely unknown. Mutations in RNA-binding proteins (RBPs) may trigger great changes in the splicing process. In this study, we comprehensively analyzed DNA and RNA sequencing data and clinical information of SKCM patients, together with widespread changes in splicing patterns induced by RBP mutations. We screened mRNA expression-related and prognosis-related mutations in RBPs and investigated the potential affections of RBP mutations on splicing patterns. Mutations in 853 RBPs were demonstrated to be correlated with splicing aberrations (p < 0.01). Functional enrichment analysis revealed that these alternative splicing events (ASEs) may participate in tumor progress by regulating the modification process, cell-cycle checkpoint, metabolic pathways, MAPK signaling, PI3K-Akt signaling, and other important pathways in cancer. We also constructed a prediction model based on overall survival-related AS events (OS-ASEs) affected by RBP mutations, which exhibited a good predict efficiency with the area under the curve of 0.989. Our work highlights the importance of RBP mutations in splicing alterations and provides effective biomarkers for prediction of prognosis of SKCM.
Keywords: RNA-binding protein; alternative splicing; mutation; prognosis; skin cutaneous melanoma.
Copyright © 2020 Mei, Song, Zhang, Zhou, Li and Liu.
Figures
Similar articles
-
The Identification of Prognostic and Metastatic Alternative Splicing in Skin Cutaneous Melanoma.Cancer Control. 2022 Jan-Dec;29:10732748211051554. doi: 10.1177/10732748211051554. Cancer Control. 2022. PMID: 34986671 Free PMC article.
-
TF-RBP-AS Triplet Analysis Reveals the Mechanisms of Aberrant Alternative Splicing Events in Kidney Cancer: Implications for Their Possible Clinical Use as Prognostic and Therapeutic Biomarkers.Int J Mol Sci. 2021 Aug 16;22(16):8789. doi: 10.3390/ijms22168789. Int J Mol Sci. 2021. PMID: 34445498 Free PMC article.
-
The underlying molecular mechanisms and prognostic factors of RNA binding protein in colorectal cancer: a study based on multiple online databases.Cancer Cell Int. 2021 Jun 30;21(1):325. doi: 10.1186/s12935-021-02031-6. Cancer Cell Int. 2021. PMID: 34193169 Free PMC article.
-
Cancer-Associated Perturbations in Alternative Pre-messenger RNA Splicing.Cancer Treat Res. 2013;158:41-94. doi: 10.1007/978-3-642-31659-3_3. Cancer Treat Res. 2013. PMID: 24222354 Review.
-
Emerging roles of RNA and RNA-binding protein network in cancer cells.BMB Rep. 2009 Mar 31;42(3):125-30. doi: 10.5483/bmbrep.2009.42.3.125. BMB Rep. 2009. PMID: 19335997 Review.
Cited by
-
Expression profile and prognostic values of LSM family in skin cutaneous melanoma.BMC Med Genomics. 2022 Nov 12;15(1):238. doi: 10.1186/s12920-022-01395-6. BMC Med Genomics. 2022. PMID: 36371223 Free PMC article.
-
RNA binding proteins (RBPs) on genetic stability and diseases.Glob Med Genet. 2024 Nov 30;12(1):100032. doi: 10.1016/j.gmg.2024.100032. eCollection 2025 Mar. Glob Med Genet. 2024. PMID: 39925443 Free PMC article. Review.
-
A Transcriptome-Wide Isoform Landscape of Melanocytic Nevi and Primary Melanomas Identifies Gene Isoforms Associated with Malignancy.Int J Mol Sci. 2021 Jul 2;22(13):7165. doi: 10.3390/ijms22137165. Int J Mol Sci. 2021. PMID: 34281234 Free PMC article.
-
Identification of Alternative Splicing in Proteomes of Human Melanoma Cell Lines without RNA Sequencing Data.Int J Mol Sci. 2023 Jan 27;24(3):2466. doi: 10.3390/ijms24032466. Int J Mol Sci. 2023. PMID: 36768787 Free PMC article.
References
-
- Zhang Q, Ding S, Zhang H, Long H, Wu H, Zhao M, et al. . Increased Set1 binding at the promoter induces aberrant epigenetic alterations and up-regulates cyclic adenosine 5'-monophosphate response element modulator alpha in systemic lupus erythematosus. Clin Epigenetics. (2016) 8:126. 10.1186/s13148-016-0294-2 - DOI - PMC - PubMed
LinkOut - more resources
Full Text Sources
Research Materials