. 2020 Oct 15:8:951.
doi: 10.3389/fbioe.2020.00951. eCollection 2020.

Scaffolds of Macroporous Tannin Spray With Human-Induced Pluripotent Stem Cells

Affiliations

Scaffolds of Macroporous Tannin Spray With Human-Induced Pluripotent Stem Cells

Yongbo Yang et al. Front Bioeng Biotechnol. .

Abstract

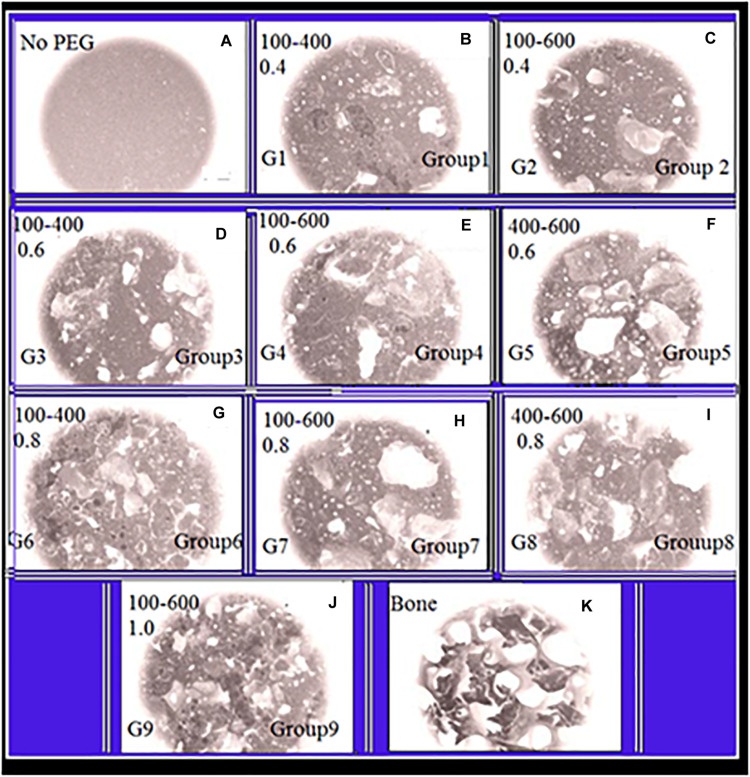
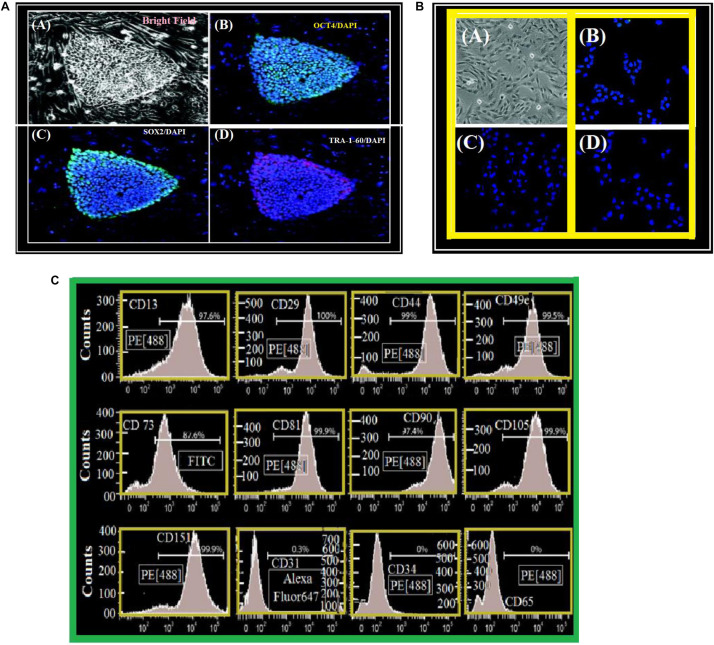
Skeletal defects resulting from trauma and disease represent a major clinical problem worldwide exacerbated further by global population growth and an increasing number of elderly people. As treatment options are limited, bone tissue engineering opens the doors to start an infinite amount of tissue/bone biomaterials having excellent therapeutic potential for the management of clinical cases characterized by severe bone loss. Bone engineering relies on the use of compliant biomaterial scaffolds, osteocompetent cells, and biologically active agents. In fact, we are interested to use a new natural material, tannin. Among other materials, porous tannin spray-dried powder (PTSDP) has been approved for human use. We use PTSDP as reconstructive materials with low cost, biocompatibility, and potential ability to be replaced by bone in vivo. In this study, macro PTSDP scaffolds with defined geometry, porosity, and mechanical properties are manufactured using a combination of casting technology and porogen leaching, by mixing PTSDP and hydroxyapatite Ca10(PO4)6(OH)2 with polyethylene glycol macroparticles. Our results show that the scaffolds developed in this work support attachment, long-term viability, and osteogenic differentiation of human-induced pluripotent stem cell-derived mesenchymal progenitors. The combination of select macroporous PTSDP scaffolds with patient-specific osteocompetent cells offers new opportunities to grow autologous bone grafts with enhanced clinical potential for complex skeletal reconstructions.

Keywords: bone engineering; macroporous tannin spray; solid scaffolds; tannin composite; vivo-stem cells.


Figures

FIGURE 1
FIGURE 1
Panels (A–K) are SEM-illustrations of macroporous scaffold with different amounts of PEGPs as indicated below: (A) Reference sample with zero PEGPs, Group1 (G1), (B) 0.4 weight-ratio (WR) of PEGPs with 100–400 μm diameter PEGPs. (C) (G-2): 0.4 WR of PEGPs with 100–600 μm diameter PEGPs. (D) (G-3): 0.6 WR of PEGPs with 100–400 μm diameter PEGPs. (E) (G-4): 0.6 WR of PEGPs with 100–600 μm diameter PEGPs. (F) (G-5): 0.6 WR of PEGPs with 400–600 μm diameter PEGPs. (G) (G-6): 0.8 WR of PEGPs with 100–400 μm diameter PEGPs. (H) (G-7): 0.8 WR of PEGPs with 100–600 μm diameter PEGPs. (I) C – (G-8): 0.8 WR of PEGPs with 400–600 μm diameter PEGPs. (J) (G-9): 1.0 WR of PEGPs with 100–600 μm diameter PEGPs. (K) Real decellularized/bone-scaffold.
FIGURE 2
FIGURE 2
(A) μCT images of DB tissue and cement scaffolds. The corresponding content of PEGPs and the diameter of PEGPs in micrometer with 1 mm as scale bar are as following: (No PEG): zero – (G1): 0.4 and 100–400 (G2) 0.4 and 100–600 – (G3) 0.6, and 100–400 – (G4) 0.6 and 100–600 – (G5) 0.6 and 400–600 – (G6) 0.8 and 100–400 – (G7) 0.8 and 100–600 – (G8) 0.8 and 400–600 (I) (G9) 1.0 100–400; Bone. (B) Pore distribution of cement scaffolds and DB as measured by μCT. (C–a) Macroporosity rate (percent) for each cement scaffolds. The experimental data are measured by μCT. Panel (C–b) shows the decrease of compressive strength, for the nine scaffold groups, as a function of macroporosity with R2 = 0.7249. (D) Compulsive power (Compressive-strength) as a function of PEGPs. The compulsive power varies inversely with the content of PEGPs: The compulsive power rises when total quantity of PEGPs decreases. The mean average of the experimental data for the groups 5 and 6 with standard deviation ± P < 0.05. Panel (E) shows the decrease of compressive strength, for the nine scaffold groups, as a function of macroporosity with R2 = 0.7249.
FIGURE 3
FIGURE 3
(A) Cell line derivation and characterization. (A) Undifferentiated 1013A human-induced pluripotent stem cell line (bright field). (B–D) Human-induced pluripotent stem cell line is positive – OCT4 (B), SOX2 (C), and TRA-1-60 (D). We stained nuclei with DAPI/Blue. (A) Scale bar = 50 μm. (B–D) Scale bar = 200 μm. (B) Cell line characterization. (A) fibroblastic-mesenchymal cells as seen in a bright field microscope. (B–D) Syllable structure of 1013A-derived/mesenchymal “1013A-MP-progenitors” at transit 4 (P4). Negative-cells for OCT4 (B), SOX2 (C) and TRA-1-60 (D). We have used DAPI to stain the nuclei. Scale bar = 50 μm. (C) A surface antigen-profile of primary mesenchymal-cells obtained by Flow-cytometry measurements of 1013A-MP.
FIGURE 4
FIGURE 4
(A) Three days after seeding, toper view is a patchwork-illustrating cell seeding (with protocols 1 and 2) into the scaffolds. Upper illustration shows mosaic-arts with the scaffold cellularity 3 days after seeding. We use both protocols 1 and 2. We stain cells with Green-calcian. Scale bar = 1 mm. We put in the inset: Cell density and distributions on DBSs. Scale bar = 1 mm. (B) We use protocols 1 and 2 for groups 1 and 6: After we seed for 1 day, the number of non-adherent cells is shown after seeding for 1 day. (C) Calibration of number of adherent-cells 1-day after we seed with protocol 1 and protocol 2. In order to compare data, we use a two-tailed un-paired t-test. Experimental results with mean averages ± standard deviation (n = 22, P < 0.05). We put an asterisk in order to represent important changes between protocol 1 and protocol 2.
FIGURE 5
FIGURE 5
Cell-growth (cell activity). Life-durability (after seeding) of 1013A-derived mesenchymal progenitors, 1013A-MPs. This is measured under osteogenic situations on cement-scaffolds and decellularized-bone: 3 days, 3 weeks, and 7 weeks. We denote by red color dead-cells while green color stands for live-cells staining of cell/scaffold builds shows identical cell-activity between scaffold-groups and decellularized-bone. Scale bar = 100 μm.
FIGURE 6
FIGURE 6
Osteogenic-contrast/gene-expression of osteogenic all along the seeding interval for 1013A-derived mesenchymal-progenitors (1013A-MPs) cultured on cement-scaffolds and DB. We present the experimental data as distributed for the expression-level. We measure these data 3 days after culturing and before osteogenic-induction which is denoted by dashed-line, and it corresponds to the expression-level of the housekeeping-gene/GAPDH. All results are shown as mean ± standard deviations (n = 3–4, P < 0.05). We use hash/tags to show an important difference to the first time (day-0), we use asterisks to stand for important change between 3 weeks and 7 weeks. Finally, we denoted by the letter B and different numbers to denote bone and different groups: Here, we notice important difference between some scaffold-groups and decellularized-bone, respectively.
FIGURE 7
FIGURE 7
Schematic representation of the bone engineering techniques used in the present work. (A) Schematic representation of the engineered tissue from biomaterial scaffolds, growth factors bioreactors, and cell; (B) steps detailing how to obtain the manufactured tissue; (C) details on inserting cells into scaffolds.
FIGURE 8
FIGURE 8
Shows the XRD data of neat hydroxyapatite (black curve). Red curve shows the XRD data of hydroxyapatite with 10% tannin and blue curve represent the XRD data of hydroxyapatite with 10% tannin.
FIGURE 9
FIGURE 9
Panels (A–D) show the nano-rods of hydroxyapatite stick with 20% tannin. They are have irregular size and shape. In addition to some agglomeration near the marked red circle. Panels (E,F) illustrate hydroxyapatite stick with 10% tannin.
FIGURE 10
FIGURE 10
FTIR spectra of hydroxyapatite with tannin nanoparticles. Neat hydroxyapatite (black), hydroxyapatite with 10% tannin (red), and hydroxyapatite with 20% tannin (blue).

Similar articles

References

    1. Abdalla S., Al-Marzouki F., Pizzi A., Bahabri F. (2018). Bone Graft with a Tannin-hydroxyapatite Scaffold and Stem Cells for Bone Engineering, U.S. Patent number: 10155069. Washington, DC: U.S. Patent and Trademark Office.
    1. Abdalla S., Pizzi A., Bahabri F., Ganash A. (2015). MALDI-TOF and C13 NMR analysis of Valonea oak (Quercus aegylops) aicorn tannin and its adhesive application. Bioresources 10 5233–5244.
    1. Al-Marzouki F., Zahed A., Pizzi A., Abdalla S. (2017). Thermo-set Resin Composition for Brake Pads, Method of Preparation, and Brake Pad Assembly, Patent number: 9791012. Washington, DC: U.S. Patent and Trademark Office.
    1. Al-Munajjed A. A., Hien M., Kujat R., Gleeson J. P., Hammer J. (2008). Influence of pore size on tensile strength, permeability and porosity of hyaluronan-collagen scaffolds. J. Mater. Sci. Mater. Med. 19 2859–2864. 10.1007/s10856-008-3422-5 - DOI - PubMed
    1. Amaral-Labat G., Grishechko L., Szczurek A., Fierro V., Pizzi A., Kuznetsov B., et al. (2012). Highly mesoporous organic aerogels derived from soy and tannin. Green Chem. 14 3099–3106.