. 2020 Oct 15:8:575227.
doi: 10.3389/fcell.2020.575227. eCollection 2020.

Syndecan-4 Modulates Cell Polarity and Migration by Influencing Centrosome Positioning and Intracellular Calcium Distribution

Affiliations

Syndecan-4 Modulates Cell Polarity and Migration by Influencing Centrosome Positioning and Intracellular Calcium Distribution

Daniel Becsky et al. Front Cell Dev Biol. .

Abstract

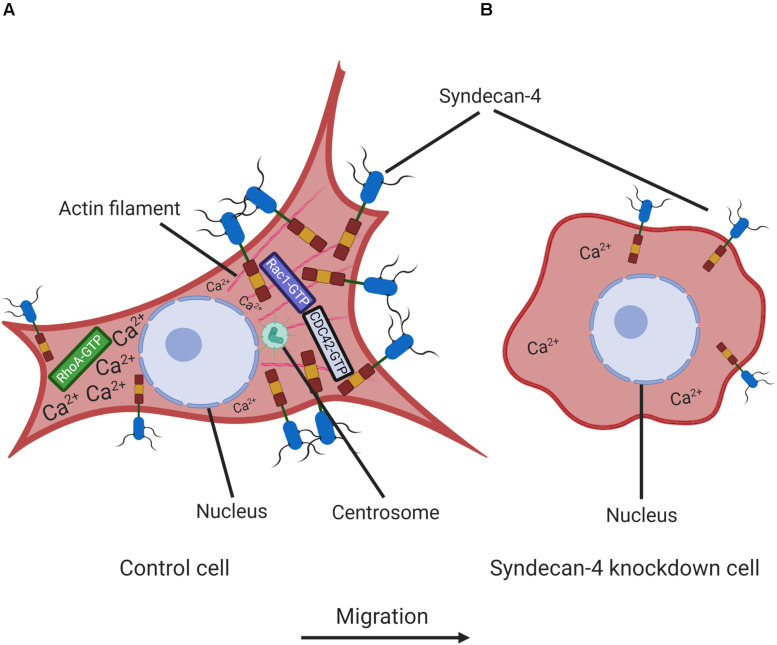
Efficient cell migration requires cellular polarization, which is characterized by the formation of leading and trailing edges, appropriate positioning of the nucleus and reorientation of the Golgi apparatus and centrosomes toward the leading edge. Migration also requires the development of an asymmetrical front-to-rear calcium (Ca2+) gradient to regulate focal adhesion assembly and actomyosin contractility. Here we demonstrate that silencing of syndecan-4, a transmembrane heparan sulfate proteoglycan, interferes with the correct polarization of migrating mammalian myoblasts (i.e., activated satellite stem cells). In particular, syndecan-4 knockdown completely abolished the intracellular Ca2+ gradient, abrogated centrosome reorientation and thus decreased cell motility, demonstrating the role of syndecan-4 in cell polarity. Additionally, syndecan-4 exhibited a polarized distribution during migration. Syndecan-4 knockdown cells exhibited decreases in the total movement distance during directional migration, maximum and vectorial distances from the starting point, as well as average and maximum cell speeds. Super-resolution direct stochastic optical reconstruction microscopy images of syndecan-4 knockdown cells revealed nanoscale changes in the actin cytoskeletal architecture, such as decreases in the numbers of branches and individual branch lengths in the lamellipodia of the migrating cells. Given the crucial importance of myoblast migration during embryonic development and postnatal muscle regeneration, we conclude that our results could facilitate an understanding of these processes and the general role of syndecan-4 during cell migration.

Keywords: actin; calcium; cell migration; cell polarity; centrosome; proteoglycan; super-resolution microscopy; syndecan-4.


Figures

FIGURE 1
FIGURE 1
The role of syndecan-4 in the directional migration of myoblasts. (A) Migration of non-transfected, scrambled, and syndecan-4-silenced (shSDC4#1 and shSDC4#2) C2C12 myoblasts to a cell-free zone was assessed after the removal of a cell culture insert. The total length of movement, maximum distance from the starting point, vectorial distance (i.e., real displacement of the cells), and the average and maximum cell speeds during directional migration are presented. The total duration of live cell microscopy was 8 h, at a frame rate of 3/1 h. Four independent experiments were conducted, with 60–87 cells/cell line and 5–6 fields of view/experiment. Data are presented as means + standard errors of the means; *p < 0.05, **p < 0.01, ***p < 0.001, and ****p < 0.0001. (B) Representative three-dimensional migration tracks. Different colors represent the total migrations of individual myoblasts; x and y axes: position of the cell (μm), z-axis: time (h). (C) Histograms depict the distributions of cells from different lines according to cell speed (intervals of 0.05 μm/min). The frequencies of cells from each line with average speeds within each interval were evaluated and are presented on the y-axis.
FIGURE 2
FIGURE 2
Syndecan-4 influences the closure of the cell-free zone. (A) Representative microscopy images taken 0, 4, and 8 h after the initiation of a wound scratch assay. Dashed lines indicate the position of the cell-free zone at 0 h. Scale bar: 200 μm. (B) Quantification of the closure of the cell-free area in cultures of non-transfected, scrambled, and syndecan-4-silenced (shSDC4#1 and shSDC4#2) cells; n = 4 independent experiments. Data are shown as means + standard errors of the means; ****p < 0.0001.
FIGURE 3
FIGURE 3
Direct stochastic optical reconstruction microscopy (dSTORM) analysis of the actin cytoskeleton after syndecan-4 silencing. Representative wide-field fluorescence and super-resolution dSTORM images depict the actin skeletons of the cells adjacent to the cell-free zone in cultures of non-transfected (A–C), scrambled (D–F), shSDC4#1 (G–I), and shSDC4#2 (J–L) cell lines. Confluent monolayers were subjected to wound scratching. The cells were fixed 2 h later, and the actin filaments were stained with Alexa Fluor 647-conjugated phalloidin (red). Wide-field fluorescence images were obtained around the cell-free zone (A,D,G,J, higher magnification: B,E,H,K). Full panoramic maps of the scratched areas are shown in Supplementary Figures 3–6. The insets of the wide-field fluorescence images depict dSTORM images of the lamellipodial regions of migrating cells adjacent to the cell-free zone (A,B,D,E,G,H,J,K). Representative dSTORM images of lamellipodial actin structures are embedded in the original low-magnification images (A,D,G,J; bar: 1 μm) or are shown in separate higher magnification panels (C,F,I,L). Nuclei are stained by Hoechst 33258 (blue).
FIGURE 4
FIGURE 4
Skeletal analysis of dSTORM images of the lamellipodial actin network. The phalloidin-stained lamellipodial actin cytoskeletons of non-transfected, scrambled, and syndecan-4-silenced (shSDC4#1 and shSDC4#2) cells were analyzed. Representative binary images converted from dSTORM images of the actin cytoskeleton are shown (A). Within the actin network, branching points divide the skeletons into smaller branches (B). The number of branches in the skeletons and the lengths of individual branches in the lamellipodial actin network in the whole binary images were quantified (C). To measure the differences between the external and the internal region of the lamellipodial actin network, the average number and length of branches were compared in randomly selected areas (three areas in both external and internal regions, each 126 × 124 pixels in size) of the binary images (D). Binary images of 5 cells/cell line were studied. Numbers of analyzed skeletons: 5,560–8,450/cell line; numbers of analyzed branches: 26,723–32,813/cell line. Number of analyzed skeletons in a single 126 × 124 pixels area: 2–69, number of analyzed branches in a single 126 × 124 pixels area: 32–336. Data are shown as means + standard errors of the means; *p < 0.05, **p < 0.01, ***p < 0.001, and ****p < 0.0001.
FIGURE 5
FIGURE 5
Syndecan-4 affects centrosome positioning during migration. (A) Representative wide-field fluorescence images of the studied cell lines depict the positions of centrosomes 2 h after scratching. Anti-γ-tubulin-labeled centrosomes and Hoechst 33258-stained nuclei are shown in green and blue, respectively. Arrows indicate the centrosomes. (B) Schematic representation of a polarized migratory cell. To quantify the positions of centrosomes, the nucleus was set as the origin, and centrosomes located in the 30°circular sector facing toward the direction of wound closure were considered properly located. (C) Pie charts (i.e., polar histograms) show the localization of centrosomes in different cell lines. The plane was partitioned into 30°circular sectors with the nucleus as the origin. The radius of each circular sector represents the number of cells with centrosomes located in that 30° sector. N = 3 independent experiments. Thirty cells were analyzed per cell line. (D) Quantification of the results shown in (C). The graph presents the ratios of centrosomes in the 30° sector facing the cell-free area. Data are shown as means + standard errors of the means; ***p < 0.001.
FIGURE 6
FIGURE 6
Asymmetric distribution of syndecan-4 in migrating myoblasts. (A) Representative images show syndecan-4 distribution following staining with Alexa Fluor 568 fluorophore (orange). Nuclei are stained by Hoechst 33258 (blue). Representative pseudo-color images (2D and 3D) depict syndecan-4 signal intensity as indicated by the calibration bar. (B) The mean intensity values of the cells were quantified. (C) Cells were partitioned into 4 quadrants considering the nucleus as the origin; and a 90°circular sector facing the direction of the wound closure was assigned and the syndecan-4 signal intensity within this area was quantified. (D) The ratio of signal intensity of the quadrant pointing into the direction of migration (see schematic figure, C), and the total syndecan-4 intensity of the cell was calculated and compared in the different cell lines. Data are reported as means + standard errors of the means, n = 30 cells/cell line were analyzed; ns: not significant; ****p < 0.0001. (E) Representative confocal image depicts the cell membrane localization (arrows) of syndecan-4 in a migrating scrambled cell. (F) Representative wide-field fluorescence image of syndecan-4 and FAK staining in a migrating scrambled cell. (G) Representative wide-field fluorescence and confocal image of GM130 (cis-Golgi marker) and syndecan-4 double staining in migrating scrambled cells.
FIGURE 7
FIGURE 7
Effect of syndecan-4 silencing on the distribution of intracellular Ca2+ in migrating myoblasts. (A) The ratio of Fluo-4 and Fura Red fluorescence, an indicator of the intracellular Ca2+ level, is shown in the representative pseudo-color images of scrambled, shSDC4#1, and shSDC4#2 cells. (B) The ratio of Fluo-4 and Fura Red fluorescence was determined along the migration axis from the leading edge to the rear of cells following scratch wounding. The mean fluorescence ratios are presented as a function of the distance from the leading edge. (C) The slopes of Fluo-4/Fura Red ratios along the migration axis in scrambled and syndecan-4 knockdown cells. Migrating cells next to the cell-free zones (n = 8–12) revealed that syndecan-4 knockdown completely abolished Ca2+ gradient development in migrating cells. Data are shown as the means + standard errors of the means; ****p < 0.0001.
FIGURE 8
FIGURE 8
Schematic representation of the effect of syndecan-4 knockdown on cell polarity and migration. The intracellular distribution of Ca2+ and syndecan-4 in non-transfected control (A) and syndecan-4 knockdown (B) myoblasts. In migrating cells, the formation of protruding leading edges are driven by Rac1/CDC42-GTPases favoring the generation of focal contacts, while the retraction and detachment occur at rear edges driven by RhoA-GTP. Syndecan-4 distributes asymmetrically in migrating cells; and syndecan-4 knockdown resulted in the improper positioning of centrosomes, the absence of a front–rear Ca2+ gradient and disturbances in the nanoscale structures of the actin fibers. These abnormalities led to decreases in cell polarity and migration. The figure was created with BioRender.com.

Similar articles

Cited by

References

    1. Afratis N. A., Nikitovic D., Multhaupt H. A., Theocharis A. D., Couchman J. R., Karamanos N. K. (2017). Syndecans - key regulators of cell signaling and biological functions. FEBS J. 284 27–41. 10.1111/febs.13940 - DOI - PubMed
    1. Baciu P. C., Saoncella S., Lee S. H., Denhez F., Leuthardt D., Goetinck P. F. (2000). Syndesmos, a protein that interacts with the cytoplasmic domain of syndecan-4, mediates cell spreading and actin cytoskeletal organization. J. Cell Sci. 113(Pt 2) 315–324. - PubMed
    1. Bass M. D., Roach K. A., Morgan M. R., Mostafavi-Pour Z., Schoen T., Muramatsu T., et al. (2007). Syndecan-4-dependent Rac1 regulation determines directional migration in response to the extracellular matrix. J. Cell Biol. 177 527–538. 10.1083/jcb.200610076 - DOI - PMC - PubMed
    1. Becsky D., Gyulai-Nagy S., Balind A., Horvath P., Dux L., Keller-Pinter A. (2020). Myoblast migration and directional persistence affected by syndecan-4-mediated tiam-1 expression and distribution. Int. J. Mol. Sci. 21:823. 10.3390/ijms21030823 - DOI - PMC - PubMed
    1. Carey D. J. (1997). Syndecans: multifunctional cell-surface co-receptors. Biochem J. 327(Pt 1) 1–16. 10.1042/bj3270001 - DOI - PMC - PubMed