Adherent Intestinal Cells From Atlantic Salmon Show Phagocytic Ability and Express Macrophage-Specific Genes
- PMID: 33178695
- PMCID: PMC7593592
- DOI: 10.3389/fcell.2020.580848
Adherent Intestinal Cells From Atlantic Salmon Show Phagocytic Ability and Express Macrophage-Specific Genes
Abstract
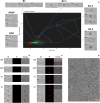
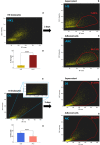
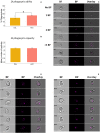
Our knowledge of the intestinal immune system of fish is rather limited compared to mammals. Very little is known about the immune cells including the phagocytic cells in fish intestine. Hence, employing imaging flow cytometry and RNA sequencing, we studied adherent cells isolated from healthy Atlantic salmon. Phagocytic activity and selected gene expression of adherent cells from the distal intestine (adherent intestinal cells, or AIC) were compared with those from head kidney (adherent kidney cells, or AKC). Phagocytic activity of the two cell types was assessed based on the uptake of Escherichia coli BioParticlesTM. AIC showed phagocytic ability but the phagocytes were of different morphology compared to AKC. Transcriptomic analysis revealed that AIC expressed genes associated with macrophages, T cells, and endothelial cells. Heatmap analysis of selected genes indicated that the adherent cells from the two organs had apparently higher expression of macrophage-related genes. We believe that the adherent intestinal cells have phagocytic characteristics and high expression of genes commonly associated with macrophages. We envisage the possibilities for future studies on enriched populations of adherent intestinal cells.
Keywords: Atlantic salmon; ImageStream®X; RNA-Seq; adherent; intestinal cells; macrophages; phagocytosis.
Copyright © 2020 Park, Zhang, Wiegertjes, Fernandes and Kiron.
Figures


Similar articles
-
Macrophage Heterogeneity in the Intestinal Cells of Salmon: Hints From Transcriptomic and Imaging Data.Front Immunol. 2021 Dec 23;12:798156. doi: 10.3389/fimmu.2021.798156. eCollection 2021. Front Immunol. 2021. PMID: 35003123 Free PMC article.
-
Transcriptome Profiling of Atlantic Salmon Adherent Head Kidney Leukocytes Reveals That Macrophages Are Selectively Enriched During Culture.Front Immunol. 2021 Aug 16;12:709910. doi: 10.3389/fimmu.2021.709910. eCollection 2021. Front Immunol. 2021. PMID: 34484211 Free PMC article.
-
Phagocytosis by B-cells and neutrophils in Atlantic salmon (Salmo salar L.) and Atlantic cod (Gadus morhua L.).Fish Shellfish Immunol. 2010 Jan;28(1):193-204. doi: 10.1016/j.fsi.2009.10.021. Epub 2009 Oct 27. Fish Shellfish Immunol. 2010. PMID: 19874896
-
Effect of injected yeast glucan on the activity of macrophages in Atlantic salmon, Salmo salar L., as evaluated by in vitro hydrogen peroxide production and phagocytic capacity.Immunology. 1994 Oct;83(2):288-94. Immunology. 1994. PMID: 7835949 Free PMC article.
-
Imaging Flow Cytometry Protocols for Examining Phagocytosis of Microplastics and Bioparticles by Immune Cells of Aquatic Animals.Front Immunol. 2020 Feb 18;11:203. doi: 10.3389/fimmu.2020.00203. eCollection 2020. Front Immunol. 2020. PMID: 32133001 Free PMC article.
Cited by
-
Effects of Low-Lipid Diets on Growth, Haematology, Histology and Immune Responses of Parr-Stage Atlantic Salmon (Salmo salar).Animals (Basel). 2024 May 27;14(11):1581. doi: 10.3390/ani14111581. Animals (Basel). 2024. PMID: 38891628 Free PMC article.
-
The manipulation of cell suspensions from zebrafish intestinal mucosa contributes to understanding enteritis.Front Immunol. 2023 May 12;14:1193977. doi: 10.3389/fimmu.2023.1193977. eCollection 2023. Front Immunol. 2023. PMID: 37251394 Free PMC article.
-
Immunohistochemical characterisation of the adult Nothobranchius furzeri intestine.Cell Tissue Res. 2024 Jan;395(1):21-38. doi: 10.1007/s00441-023-03845-8. Epub 2023 Nov 28. Cell Tissue Res. 2024. PMID: 38015266
-
In evolution's unending race: ancestral STING sensors in Salmo salar mediate intracellular bacterial detection and programmed cell death through evolutionarily conserved pathways.Front Immunol. 2025 Jun 18;16:1570871. doi: 10.3389/fimmu.2025.1570871. eCollection 2025. Front Immunol. 2025. PMID: 40607404 Free PMC article.
-
Synbiotic Agents and Their Active Components for Sustainable Aquaculture: Concepts, Action Mechanisms, and Applications.Biology (Basel). 2023 Dec 6;12(12):1498. doi: 10.3390/biology12121498. Biology (Basel). 2023. PMID: 38132324 Free PMC article. Review.
References
-
- Andrews S. (2010). FastQC: A Quality Control Tool for High Throughput Sequence Data. Babraham Bioinformatics. Cambridge: Babraham Institute.
LinkOut - more resources
Full Text Sources
Molecular Biology Databases

