Review
. 2019 Nov 14;1(1):20190033.
doi: 10.1259/bjro.20190033. eCollection 2019.

Metal artifact correction strategies in MRI-based attenuation correction in PET/MRI

Affiliations
Review

Metal artifact correction strategies in MRI-based attenuation correction in PET/MRI

Georg Schramm et al. BJR Open. .

Abstract

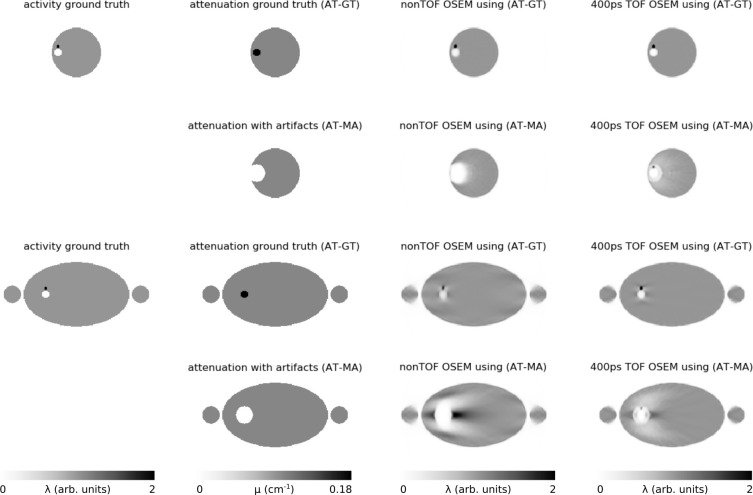
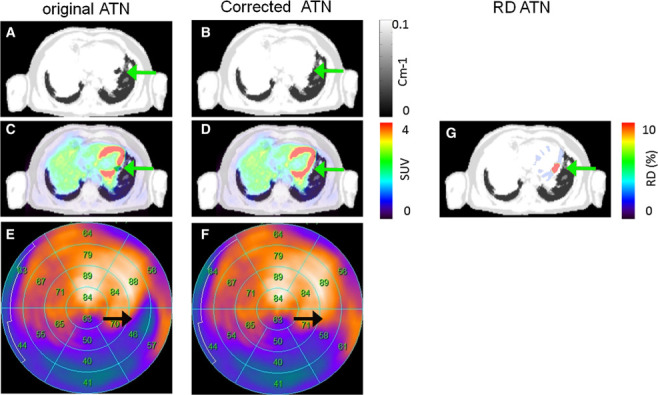
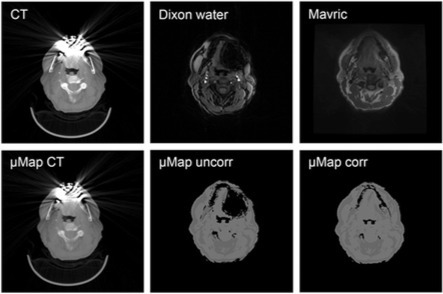
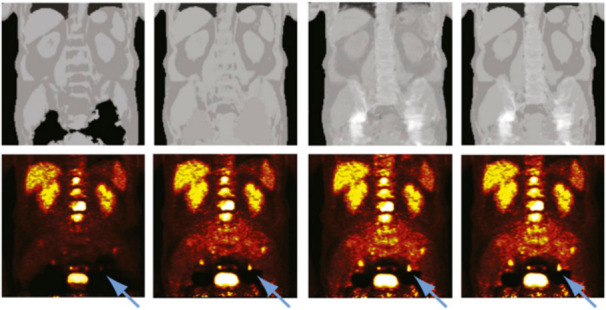
In hybrid positron emission tomography (PET) and MRI systems, attenuation correction for PET image reconstruction is commonly based on processing of dedicated MR images. The image quality of the latter is strongly affected by metallic objects inside the body, such as e.g. dental implants, endoprostheses, or surgical clips which all lead to substantial artifacts that propagate into MRI-based attenuation images. In this work, we review publications about metal artifact correction strategies in MRI-based attenuation correction in PET/MRI. Moreover, we also give an overview about publications investigating the impact of MRI-based attenuation correction metal artifacts on the reconstructed PET image quality and quantification.


Figures

Figure 1.
Figure 1.
Examples of artifacts due to presence of stainless steel screws in healthy 37-year-old male. A and B, In gradient-echo image with ±62.5 kHz receive bandwidth (A) and spin-echo image with ±16 kHz receive bandwidth (B), solid arrows show signal loss that can be due to dephasing or from signal being shifted away from region. Dotted arrow in B shows geometric distortion of femoral condyle, and dashed arrows show signal pile-up, which can be combination of in-plane and through-slice displacement of signal from multiple locations to one location. Reprinted from “Metal-induced artifacts in MRI”, B. Hargreaves et al., the American Journal of Roentgenology 197/3, © 2011 American Roentgen Ray Society.
Figure 2.
Figure 2.
3D Noise-free simulation of the impact of metal artifacts in the attenuation image in non-TOF and 400 ps TOF OSEM reconstructions (only transaxial slices are shown). The top two rows show the case of a signal void caused by a dental implant in the head. The bottom two rows show the case of a signal void caused by a hip implant in the body. The first column shows the activity ground truth used to simulate the emission data. The second column shows the ground truth attenuation image and the attenuation image with a simulated metal artifact that were used for PET image reconstruction. The last two columns show non-TOF and 400 ps TOF OSEM PET reconstructions (3 iterations with 28 subsets, 2.78 × 2.78 × 2.78 mm3 voxelsize, 600 mm transaxial FOV, 4.5 mm post-smoothing) using both attenuation images. The PET scanner geometry used in this simulation was the one of the GE SIGNA PET/MRI. The used linear attenuation coefficients were 0.1 cm 1 for soft tissue and 0.18 cm 1 for the implant.
Figure 3.
Figure 3.
The MR-based attenuation image showing a typical artifact caused by a dental implant. (a) Shows a large region of missing data and tissue misclassification as air around the dental implants, resulting in an artificially decreased 18F-FDG uptake (arrow) in the corresponding MRAC PET (b) relative to the CT-based attenuation-corrected PET (c). Figure adapted from Buchbender et al. “Positron emission tomography (PET) attenuation correction artefacts in PET/CT and PET/MRI”, Brit J Radiol 2013, 27:1–9 and reused with permission from the publisher, BIR.
Figure 4.
Figure 4.
Patient 13 with susceptibility artifact in the inferior wall caused by a stent and corresponding FDG PET reconstructions. Susceptibility artifact in the left circumflex artery was observed in the original AC map (A, arrow). Correction of the susceptibility artifact (B) changed the interpretation from reduced metabolism to normal metabolism (CF, arrows). The susceptibility artifact accounted for relative differences of more than 10% in the affected region (G). This research was originally published in J Nucl Cardiol. Lassen et al. “Assessment of attenuation correction for myocardial PET imaging using combined PET/MRI” J Nucl Cardiol. 2017. This figure is reprinted without modifications and is licensed under the Creative Commons Attribution 4.0 International License.
Figure 5.
Figure 5.
(Top) Typical examples of images obtained from low-dose CT, water data set of Dixon sequence, and MAVRIC sequence are shown. (Bottom) Corresponding attenuation maps generated from CT, Dixon sequence alone, and new correction algorithm are shown. This research was originally published in JNM. Burger, I. A. et al. “Hybrid PET/MRI imaging: an algorithm to reduce metal artifacts from dental implants in Dixon-based attenuation map generation using a multi acquisition variable resonance image combination sequence”. J Nucl Med. 2015;56:93–97. © SNMMI.
Figure 6.
Figure 6.
Patient with metal implant in sternum. Bottom row, from left to right: in-phase MR image; CT image, with arrows indicating location of metal implant; pseudo-CT from 5-class MR image segmentation; and AT&PR-based pseudo-CT. Top row: corresponding PET images reconstructed using pseudo-CT images for AC. This research was originally published in JNM. Hofmann et al. “MRI-Based Attenuation Correction for Whole-Body PET/MRI: Quantitative Evaluation of Segmentation- and Atlas-Based Methods ”. J Nucl Med. 2011;52:1392–1399. © SNMMI.
Figure 7.
Figure 7.
Attenuation maps (top) and PET images (bottom) for sample patient with hip prostheses. The used MRAC methods, from left to right, were SEG1, SEG2, AT&PR, and SEG2wBONE. Metal artifacts are due to bilateral hip replacement. Blue arrows denote lesion affected by presence of adjacent metal artifact when no correction was performed. This research was originally published in JNM. Bezrukov et al. “ MRI-Based Attenuation Correction Methods for Improved PET Quantification in Lesions Within Bone and Susceptibility Artifact Regions” J Nucl Med. 2013;54:1–7 ©SNMMI.
Figure 8.
Figure 8.
Example coronal slice containing a hip endoprosthesis, for patient 1 with 18F-FDG, of (a) in-phase MR image; attenuation maps (b) µ MR based on MR, (c) µ JEnoMR based on JE without MR-based priors, and (d) µ JE based on JE with MR-based priors; differences in the attenuation maps, (e) µ JEnoMR - µ MR, and (f) µ JE - µ MR; TOF OSEM reconstructed activity images (g) λ MR based on µ MR, (h) λ JEnoMR based on µ JEnoMR, and (i) λ JE based on µ JE; and relative differences in the TOF OSEM reconstructed images, (j) (λ JEnoMR - λ MR)/λ MR, and (k) (λ JE - λ MR)/λ MR. The yellow arrow indicates the recovered metallic implant in the JE reconstructed attenuation map in (d), and the red arrow indicates the overestimated attenuation region corresponding to the bladder in µ JEnoMR. Reprinted from Ahn et al. “Joint estimation of activity and attenuation for PET using pragmatic MR-based prior : application to clinical TOF PET/MR whole-body data for FDG and non-FDG tracers”, Phys Med Biol 2018;63:045006, https://doi.org/10.1088/1361-6560/aaa8a6. © Institute of Physics and Engineering in Medicine. Reproduced by permission of IOP Publishing. All rights reserved.
Figure 9.
Figure 9.
Patient presenting right hip cobalt-chromium alloy endoprosthesis (patient 1). Dixon (A), CT (B), and IPAC (C) µ-maps are shown. The three columns show (from left to right) sagittal, coronal, and axial planes. This research was originally published in JNM. Fuin et al. “PET/MR Imaging in the Presence of Metal Implants: Completion of the Attenuation Map from PET Emission Data” J Nucl Med. 2017;58:840–845. © SNMMI.

Similar articles

Cited by

References

    1. Hargreaves BA, Worters PW, Pauly KB, Pauly JM, Koch KM, Gold GE, et al. . Metal-Induced artifacts in MRI. AJR Am J Roentgenol 2011; 197: 547–55. doi: 10.2214/AJR.11.7364 - DOI - PMC - PubMed
    1. Zaidi H. Is MR-guided attenuation correction a viable option for dual-modality PET/MR imaging? Radiology 2007; 244: 639–42. doi: 10.1148/radiol.2443070092 - DOI - PubMed
    1. Hofmann M, Pichler B, Schölkopf B, Beyer T. Towards quantitative PET/MRI: a review of MR-based attenuation correction techniques. Eur J Nucl Med Mol Imaging 2009; 36(S1): 93–104. doi: 10.1007/s00259-008-1007-7 - DOI - PubMed
    1. Keereman V, Mollet P, Berker Y, Schulz V, Vandenberghe S. Challenges and current methods for attenuation correction in PET/MR. Magnetic Resonance Materials in Physics . Biology and Medicine 2013; 26: 81–98. - PubMed
    1. Bezrukov I, Mantlik F, Schmidt H, Schölkopf B, Pichler BJ. MR-Based PET attenuation correction for PET/MR imaging. Semin Nucl Med 2013; 43: 45–59. doi: 10.1053/j.semnuclmed.2012.08.002 - DOI - PubMed