Review
. 2019 Oct 1;1(1):20190036.
doi: 10.1259/bjro.20190036. eCollection 2019.

Pitfalls in diagnosis of infiltrative lung disease by CT

Affiliations
Review

Pitfalls in diagnosis of infiltrative lung disease by CT

Céline Du Pasquier et al. BJR Open. .

Abstract

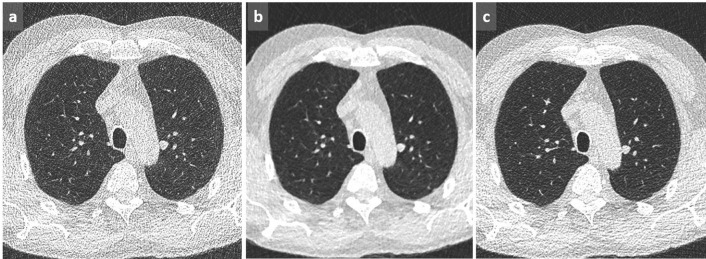
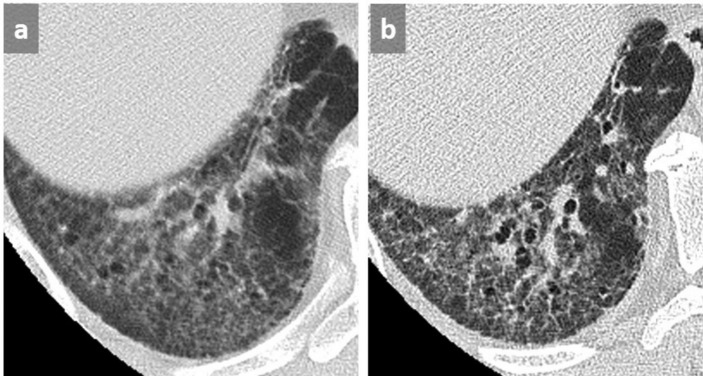
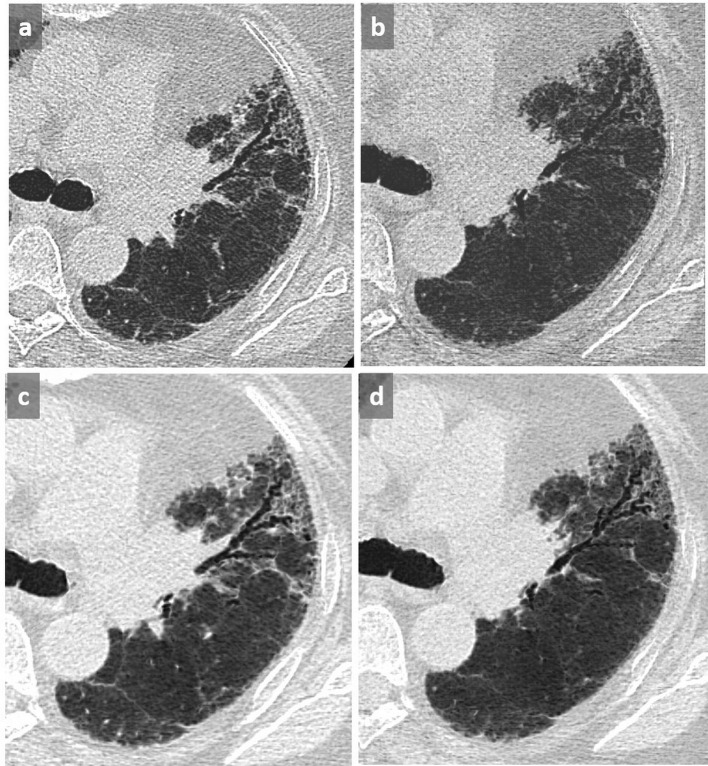
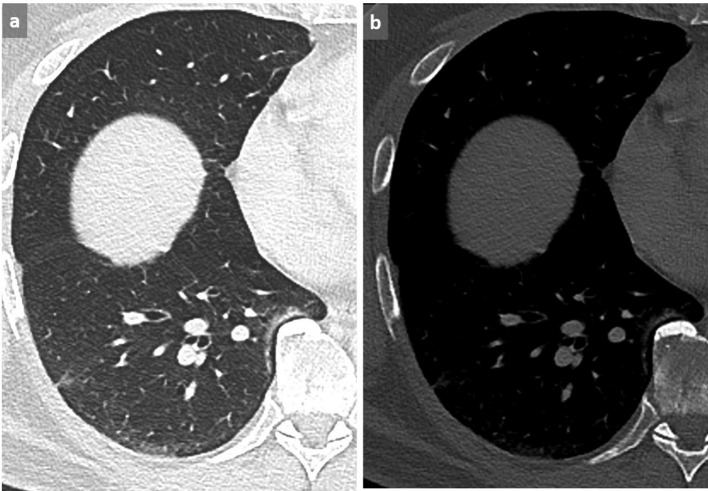
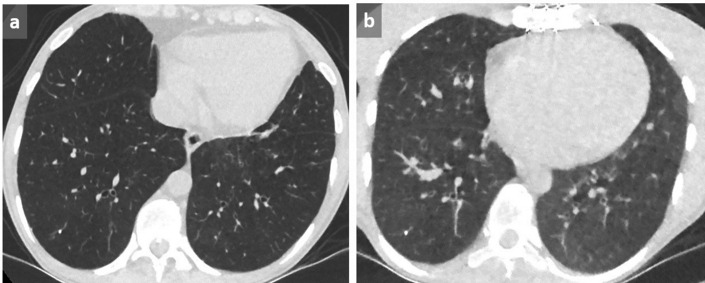
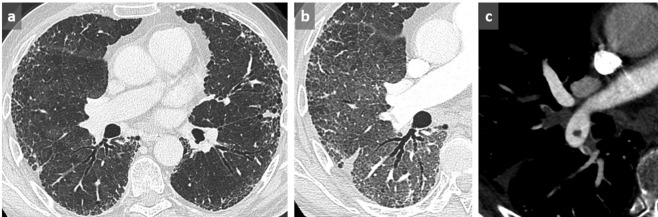
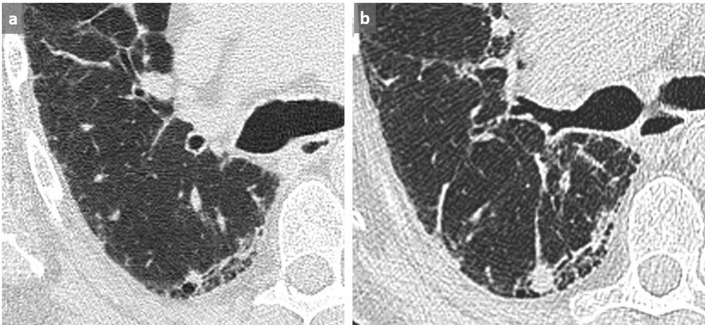
The diagnosis of interstitial lung disease may be challenging, especially in atypical disease. Various factors must be considered when performing and reading a chest CT examination for interstitial lung disease, because each of them may represent a source of misinterpretation. Firstly, technical aspects must be mastered, including acquisition and reconstruction parameters as well as post-processing. Secondly, mistakes in interpretation related to the inaccurate description of predominant features, potentially leading to false-positive findings, as well as satisfaction of search must be avoided. In all cases, clinical context, coexisting chest abnormalities and previous examinations must be integrated into the analysis to suggest the most appropriate differential diagnosis.


Figures

Figure 1.
Figure 1.
Dependent GGO. Increased lung attenuation in subpleural and basal location in dependent areas may be favored by lack of inspiration (a). By using MIP, tortuous vessels in high attenuating areas are clearly identified, confirming the lack of deep inspiration (b). In another case of a 58-year-old patient presenting with shortness of breath, cough and hemoptoic sputum, supine acquisition shows bilateral GGOs in a posterobasal location with relative sparing of the immediate subpleural area suggestive of NSIP (c). This diagnosis is excluded by the reversibility of these dependent abnormalities in prone position (d). GGO, ground glass opacity; MIP, maximum intensityprojection; NSIP, non-specific interstitial pneumonia.
Figure 2.
Figure 2.
NSIP. Subpleural GGO in a posterobasal and subpleural location that could suggest dependent abnormalities and require another acquisition in prone position. However, the presence of a subtle GGO in subpleural lateral areas (arrows) precludes the need for an additional prone acquisition (a). A 3 mm-thick mIP slice increases our diagnostic confidence by reinforcing the visibility of abnormal densities (b). GGO, ground glass opacity; mIP, minimum intensity projection.
Figure 3.
Figure 3.
Thin slices at the level of right lower lobe (a, b) and left lower lobe (c, d) in a patient with UIP in supine (a, c) and prone (b, d) position. Identification of the honeycombing pattern in posterobasal location appears difficult in supine position due to superimposed GGO and lack of lung expansion (a, c) conversely to prone position (b, d) where the diagnosis of honeycombing is facilitated, allowing a definite diagnosis of a UIP pattern. GGO, ground glass opacity; UIP, usual interstitial pneumonitis.
Figure 4.
Figure 4.
When performing an acquisition with a very low CTDI at 0.11 mGy, image noise, well seen outside of the chest, can mimic a miliary disease on thin axial slice (a) and MIP reformat (b), even though applying an iterative reconstruction algorithm. A follow-up CT with a CTDI at 0.29 mGy (b) reduces noise, allowing to exclude micronodules. These CT were performed in a context of recurrent pneumothorax in a young patient with endometriosis (not shown). CTDI, CT dose index; MIP, maximum intensity projection.
Figure 5.
Figure 5.
Lung CT acquisition with a CTDI at 0.45 mGy and DLP at 14 mGyxcm with lung (a), soft (b) and intermediate (c) kernel shows an optimized balance between image noise and spatial resolution with the intermediate filter at the same dose. CTDI, CT dose index; DLP, dose–length product.
Figure 6.
Figure 6.
Interstitial lung disease in systemic sclerosis. On the left, subtle details such as intralobular reticulations are completely missed due to partial volume effect with thick slices 5 mm-thick (a). For this reason, thin slices, 1.25 mm-thick in this case, must always be used (b).
Figure 7.
Figure 7.
Optimal rendering of mIP by using the soft kernel compared to the lung one. (a) mIP 3.3 mm with lung kernel; (b) mIP 6.5 mm with lung kernel; (c) mIP 3.3 mm with soft kernel; (d) mIP 6.5 mm with soft kernel. Whatever the slab thickness of the mIP post-processing tool, there is a lower image quality by using the lung kernel compared with the soft one. Assessment of GGO and traction bronchiectasis is much better depicted in (c, d). GGO, ground glass opacity; mIP, minimum intensity projection.
Figure 8.
Figure 8.
Paravertebral GGO (a) near a protruding osteophyte (b) must not be considered as abnormal and therefore should not be reported as pathological. Note dependent GGO in subpleural area that were reversible in prone position. GGO, ground glass opacity.
Figure 9.
Figure 9.
Schematic representation of micronodules distribution patterns. (a) Typical perilymphatic distribution involving the parahilar peribronchovascular interstitium until terminal bronchioles, the subpleural area, along the fissures or interlobular septa. A typical perilymphatic distribution is seen in sarcoidosis, lymphangitic carcinomatosis or silicosis. (b) In case of random distribution, the distribution is uniform without respect of anatomic structures. This suggests a hematogenous spread of disease, particularly miliary metastases, tuberculosis, fungal or viral infection. (c) Centrilobular distribution is characterized by the presence of multiple small nodules often ill-defined grouped within the center of the secondary pulmonary lobule, with a location at least 3 mm away from the pleura. Therefore, the key point for the recognition of this pattern is the absence of any nodule along the pleural interface. This distribution is primarily suggestive of bronchial and peribronchial disease, but may also be related to vascular or perivascular disease, and more rarely interstitial disease predominating around the centrilobular bronchiole and artery.
Figure 10.
Figure 10.
False-positive diagnosis of miliary disease. Faced with this pattern of profuse micronodules (a), this patient was diagnosed with miliary tuberculosis, and consequently treated with antituberculous quadritherapy. However, the patient experienced a worsening of dyspnea and severe cough when he returned back home. The final diagnosis was hypersensitivity pneumonitis related to a humidifier use. Note the sparing of the juxtafissural area, which allows a definite diagnosis of centrilobular nodules (arrows) (b). A miliary disease was initially diagnosed on thin slices in this other patient with severe dyspnea and hypoxemia (c). A 4 mm-thick MIP demonstrates a tree-in-bud appearance (d), with a typical sparing of the subpleural area characteristic of centrilobular nodules, more difficult to assess on thin section. In association with the tree in bud appearance, this was strongly suggestive of bronchiolitis that was related to cannabis exposure and subsequently resolved after interruption of its use. MIP, maximum intensity projection.
Figure 11.
Figure 11.
Pseudohoneycombing. Patient known for COPD presenting with cough. Honeycombing was reported on the first CT scan (a). Subsequent axial chest CT 2 months later showed disappearance of the cystic pattern that was related to a resolution of alveolar condensation after antibiotic therapy for S. pneumoniae infection (b). Note the controlateral emphysematous changes related to COPD (c). COPD, chronic obstructive pulmonary disease.
Figure 12.
Figure 12.
Patient with cystic fibrosis with mosaic perfusion pattern related to small airway disease. Mosaic perfusion pattern appears as abnormal areas of decreased attenuation associated with small vessel size (orange arrows) alternating with preserved areas in which larger vessels respond to an increase in arterial blood flow (blue arrows) (a). Note the improved visibility of normal and abnormal areas by using 4 mm-thick mIP post-processing with lowering of the window level and reduction of the window width (−820, 572 HU) (b). Such an aspect should not be confused with GGO with mosaic appearance, in which areas of GGO are the abnormal zones. GGO, ground glass opacity; HU, Hounsfield unit; mIP, minimum intensity projection.
Figure 13.
Figure 13.
Post-transplant diffuse constrictive bronchiolitis. Axial chest CT of a post-transplant 31-year-old female showing diffuse decreased attenuation of the lung parenchyma in inspiration (a) without visible air trapping on expiration (b). A severe constrictive bronchiolitis was confirmed histologically.
Figure 14.
Figure 14.
Pulmonary embolism in a patient with suspected acute exacerbation of interstitial lung disease. 73-year-old male known for drug-induced pulmonary fibrosis (a) (chemotherapy for high-grade bladder carcinoma), presenting with increasing dyspnea, fever and oxygen desaturation. Although a new GGO was observed and attributed to fibrosis exacerbation (b), pulmonary emboli were detected on this contrast-enhanced chest CT (c). Note the triangular opacity corresponding to a small intrafissural effusion in (b). This example highlights the importance of performing a contrast-enhanced CT in case of clinical worsening in patients with pulmonary fibrosis to rule out pulmonary embolism, since acute exacerbation is a diagnosis of exclusion. GGO, ground glass opacity.
Figure 15.
Figure 15.
Missed cancer in a patient known for UIP. A non-specific nodule/density at the frontier of the diseased/normal lung was not reported on the first CT scan (a). A significant increased size was subsequently observed at the follow-up CT scan 5 months later (b) with a histologically proven low differentiated lung carcinoma. Satisfaction of search which is mainly aimed at evaluating the ILD commonly overlook such focal and/or newly discovered suspicious abnormalities. ILD, interstitial lung disease; UIP, usual interstitial pneumonitis.

References

    1. Meyer KC. Diagnosis and management of interstitial lung disease. Transl Respir Med 2014; 2: 4. doi: 10.1186/2213-0802-2-4 - DOI - PMC - PubMed
    1. Raghu G, Remy-Jardin M, Myers JL, Richeldi L, Ryerson CJ, Lederer DJ, et al. Diagnosis of idiopathic pulmonary fibrosis. An official ATS/ERS/JRS/ALAT clinical practice guideline. Am J Respir Crit Care Med 2018; 198: e44–68. doi: 10.1164/rccm.201807-1255ST - DOI - PubMed
    1. Kligerman SJ, Groshong S, Brown KK, Lynch DA. Nonspecific interstitial pneumonia: radiologic, clinical, and pathologic considerations. Radiographics 2009; 29: 73–87. doi: 10.1148/rg.291085096 - DOI - PubMed
    1. Lynch DA, Sverzellati N, Travis WD, Brown KK, Colby TV, Galvin JR, et al. Diagnostic criteria for idiopathic pulmonary fibrosis: a Fleischner Society white paper. Lancet Respir Med 2018; 6: 138–53. doi: 10.1016/S2213-2600(17)30433-2 - DOI - PubMed
    1. Beigelman-Aubry C, Hill C, Guibal A, Savatovsky J, Grenier PA. Multi-detector row CT and postprocessing techniques in the assessment of diffuse lung disease. Radiographics 2005; 25: 1639–52. doi: 10.1148/rg.256055037 - DOI - PubMed