. 2021 Jan;23(1):2.
doi: 10.3892/mmr.2020.11640. Epub 2020 Nov 12.

Downregulation of lncRNA ZFAS1 inhibits the hallmarks of thyroid carcinoma via the regulation of miR‑302‑3p on cyclin D1

Affiliations

Downregulation of lncRNA ZFAS1 inhibits the hallmarks of thyroid carcinoma via the regulation of miR‑302‑3p on cyclin D1

Wenjing Chen et al. Mol Med Rep. 2021 Jan.

Abstract

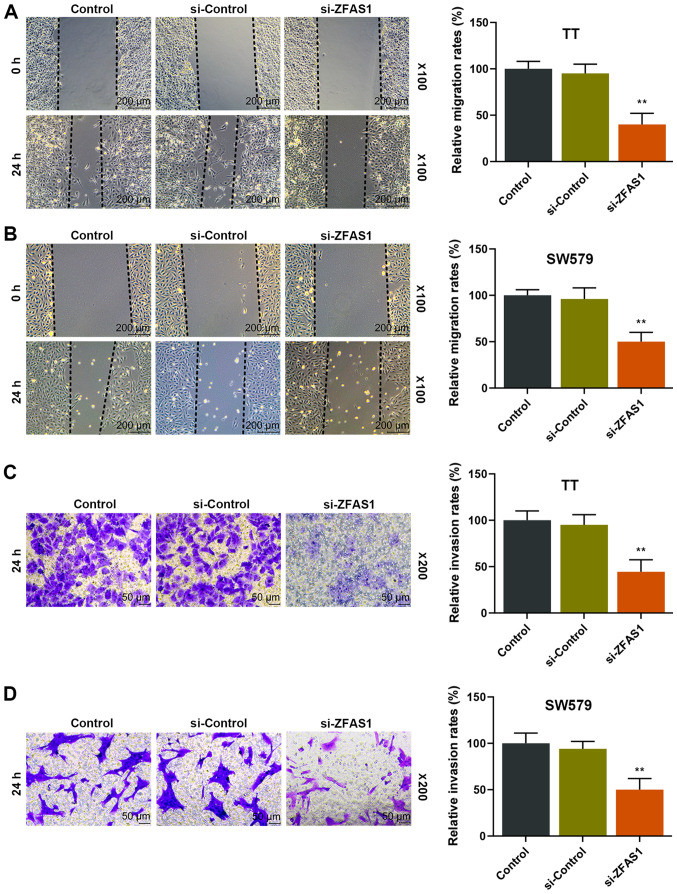
At present, treatment options for thyroid carcinoma remain limited. The present study aimed to investigate the role of ZFAS1 in various major hallmarks of cancer and the underlying mechanisms in thyroid carcinoma cells. The interactions between long non‑coding RNAs (lncRNAs), microRNAs (miRs) and target genes were predicted by bioinformatics and confirmed by performing dual‑luciferase assays. The mRNA and protein expressions were determined by reverse transcription‑quantitative PCR and western blotting. Cell invasion, migration, and viability were evaluated via Transwell, wound‑healing and Cell Counting Kit‑8 assays, respectively. The results demonstrated that lncRNA ZFAS1 expression was upregulated in thyroid carcinoma tissues, TT and SW579 cells, and was associated with the proliferation of these two cell lines. Notably, downregulation ZFAS1 reduced migration and invasion, and reversed the promotive effects of miR‑302a‑3p inhibitor on the proliferation, migration and invasion of TT and SW579 cells. Moreover, cyclin D1 (CCND1) is targeted by miR‑302a‑3p, and was regulated by ZFAS1. In addition, the downregulation of ZFAS1 not only reversed the promotive effects of miR‑302a‑3p inhibitor on CCND1 expression and the epithelial‑mesenchymal transition (EMT) of TT and SW579 cells, but also targeted and increased the expression of miR‑302a‑3p, and further reduced the expression of CCND1, resulting in suppression of the proliferation, migration, invasion and EMT of thyroid carcinoma cells.

Keywords: long non‑coding RNA ZFAS1; microRNA‑302‑3p; cyclin D1; tumorigenesis; intervention.


Figures

Figure 1.
Figure 1.
Expression levels of ZFAS1 in thyroid carcinoma tissue and cell lines, as well as the effects of downregulating ZFAS1 expression levels on cell viability. (A) Relative ZFAS1 expression in thyroid carcinoma tissue and (B) cell lines. *P<0.05, **P<0.01 vs. Adjacent tissue or Nthy-ori3-1. Relative (C) ZFAS1 expression in TT and (D) SW579 cells when ZFAS1 expression was silenced. OD value of (E) TT and (F) SW579 cells at 24, 48 and 72 h when ZFAS1 expression was silenced. *P<0.05, **P<0.01 vs. si-Control. OD, optical density; si, small interfering.
Figure 2.
Figure 2.
Effects of downregulating ZFAS1 expression levels on cell migration and invasion. Relative migration rates of (A) TT and (B) SW579 cells when ZFAS1 was silenced. Scale bar, 200 µm; magnification, ×100. Relative invasion rates of (C) TT and (D) SW579 cells when ZFAS1 was silenced. Scale, 50 µm; magnification, ×200. **P<0.01 vs. si-Control. si, small interfering.
Figure 3.
Figure 3.
Negative correlation between the expression levels of ZFAS1 and miR-302a-3p. (A) Complementary sequences of ZFAS1 and miR-302a-3p. Relative luciferase activity in (B) TT and (C) SW579 cells treated with miR-302a-3p mimic. **P<0.01 vs. Blank. (D) miR-302a-3p expression levels in adjacent or cancer tissue. **P<0.01. (E) Correlation between miR-302a-3p and ZFAS1 expression. Relative miR-302a-3p expression levels in Control, inhibitor-NC, inhibitor, inhibitor + si-ZFAS1 and si-ZFAS1 groups in (F) TT and (G) SW579 cells. **P<0.01 vs. inhibitor-NC; ##P<0.01 vs. inhibitor; ^^P<0.01 vs. inhibitor + si-ZFAS1. NC, negative control; si, small interfering; WT, wild-type; MUT, mutant; miR, microRNA.
Figure 4.
Figure 4.
Effects of downregulating ZFAS1 on the cell viability, migration and invasion of TT and SW579 cells treated with miR-302a-3p inhibitor. OD values in Control, inhibitor-NC, inhibitor, inhibitor + si-ZFAS1 and si-ZFAS1 groups in (A) TT and (B) SW579 cells. Relative migration rates of (C) TT and (D) SW579 cells in each group. Scale, 200 µm; magnification, ×100. Relative invasion rates of (E) TT and (F) SW579 cells in each group. Scale, 50 µm; magnification, ×200. **P<0.01 vs. inhibitor-NC; ##P<0.01 vs. inhibitor; ^^P<0.01 vs. inhibitor + si-ZFAS1. OD, optical density; NC, negative control; si, small interfering; miR, microRNA.
Figure 5.
Figure 5.
CCND1 is the target of miR-302a-3p. (A) Complementary sequences of CCND1 and miR-302a-3p. Relative luciferase activity in (B) TT and (C) SW579 cells treated with miR-302a-3p mimic. **P<0.01 vs. Blank. CCND1, cyclin D; miR, microRNA; wt, wild-type; mut, mutant.
Figure 6.
Figure 6.
Effects of downregulating ZFAS1 on the expression of CCND1 in TT and SW579 cells treated with miR-302a-3p inhibitor. (A) Protein blots of CCND1 expression in Control, inhibitor-NC, inhibitor, inhibitor + si-ZFAS1 and si-ZFAS1 groups in TT cells. Relative CCND1 (B) protein and (C) mRNA levels in each group of TT cells. (D) Protein blots of CCND1 expression in each group of SW579 cells. Relative CCND1 (E) protein and (F) mRNA levels in each group of SW579 cells. **P<0.01 vs. inhibitor-NC; ##P<0.01 vs. inhibitor; ^^P<0.01 vs. inhibitor + si-ZFAS1. CCND1, cyclin D1; miR, microRNA; NC, negative control; si, small interfering.
Figure 7.
Figure 7.
Effects of downregulating ZFAS1 expression on the epithelial-mesenchymal transition capability of TT and SW579 cells treated with miR-302a-3p inhibitor. Protein blots of MMP2, MMP9, E-cadherin and N-cadherin in Control, inhibitor-NC, inhibitor, inhibitor + si-ZFAS1 and si-ZFAS1 groups of (A) TT and (B) SW579 cells. Relative protein expressions of MMP2, MMP9, E-cadherin and N-cadherin in each group of (C) TT and (D) SW579 cells. Relative mRNA expressions of MMP2, MMP9, E-cadherin and N-cadherin in each group of (E) TT and (F) SW579 cells. **P<0.01 vs. inhibitor-NC; ##P<0.01 vs. inhibitor; ^^P<0.01 vs. inhibitor + si-ZFAS1. miR, microRNA; NC, negative control; si, small interfering; MMP, matrix metallopeptidase.

Similar articles

Cited by

References

    1. Liebner DA, Shah MH. Thyroid cancer: Pathogenesis and targeted therapy. Ther Adv Endocrinol Metab. 2011;2:173–195. doi: 10.1177/2042018811419889. - DOI - PMC - PubMed
    1. Pellegriti G, Frasca F, Regalbuto C, Squatrito S, Vigneri R. Worldwide increasing incidence of thyroid cancer: Update on epidemiology and risk factors. J Cancer Epidemiol. 2013;2013:965212. doi: 10.1155/2013/965212. - DOI - PMC - PubMed
    1. Siegel RL, Miller KD, Jemal A. Cancer statistics, 2019. CA Cancer J Clin. 2019;69:7–34. doi: 10.3322/caac.21551. - DOI - PubMed
    1. Ahn HS, Kim HJ, Welch HG. Korea's thyroid-cancer ‘Epidemic’-screening and overdiagnosis. N Engl J Med. 2014;371:1765–1767. doi: 10.1056/NEJMp1409841. - DOI - PubMed
    1. Colonna M, Uhry Z, Guizard AV, Delafosse P, Schvartz C, Belot A, Grosclaude P, FRANCIM network Recent trends in incidence, geographical distribution, and survival of papillary thyroid cancer in France. Cancer Epidemiol. 2015;39:511–518. doi: 10.1016/j.canep.2015.04.015. - DOI - PubMed