. 2020 Nov 12:9:e59201.
doi: 10.7554/eLife.59201.

A rat epigenetic clock recapitulates phenotypic aging and co-localizes with heterochromatin

Affiliations

A rat epigenetic clock recapitulates phenotypic aging and co-localizes with heterochromatin

Morgan Levine et al. Elife. .

Abstract

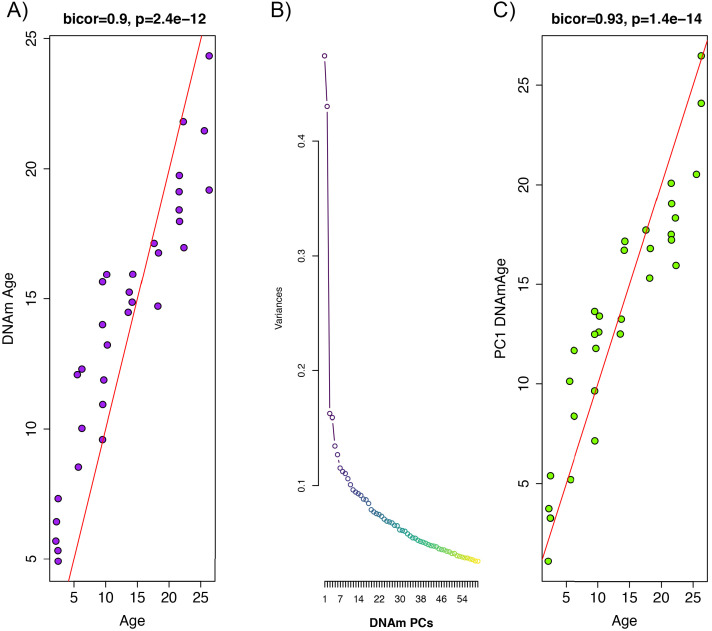
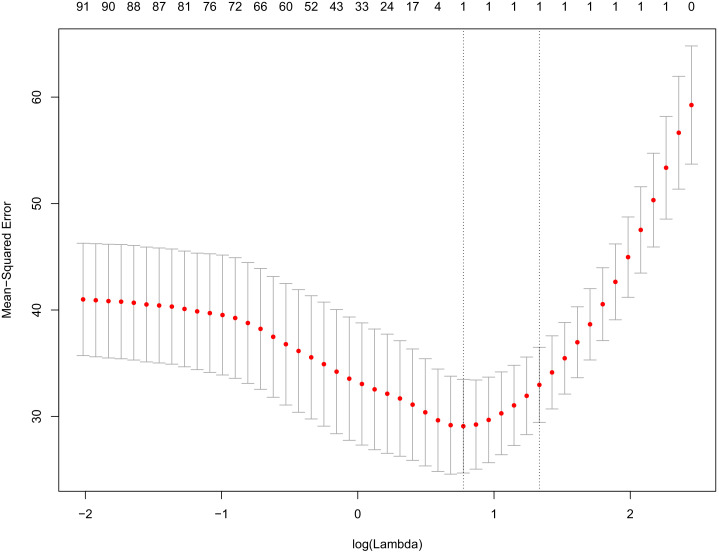
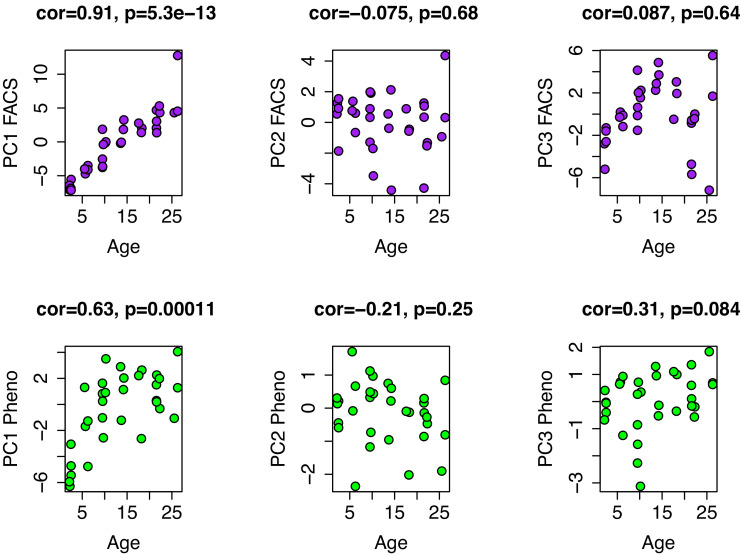
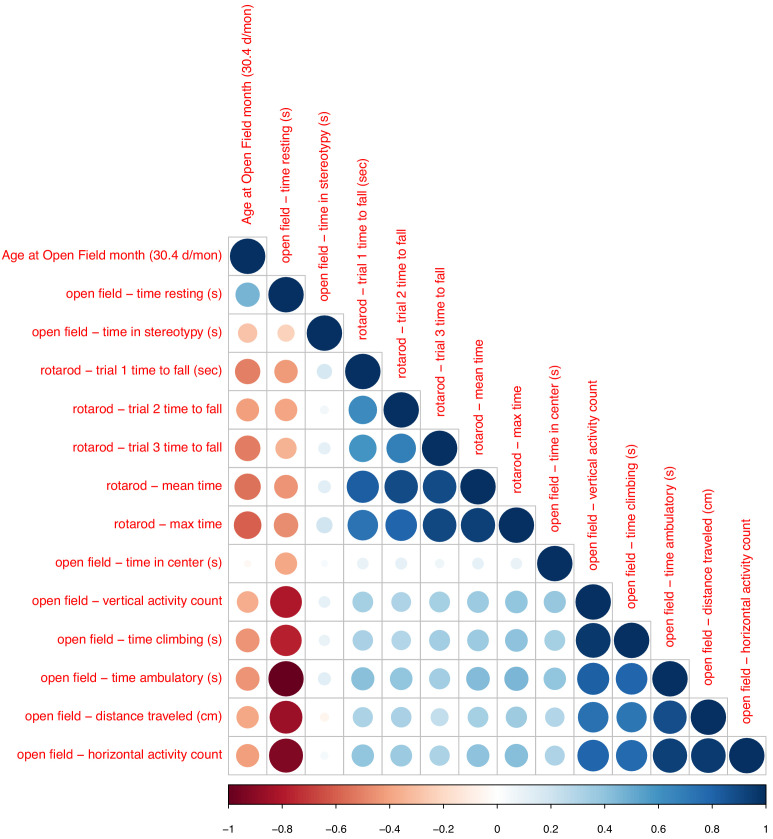
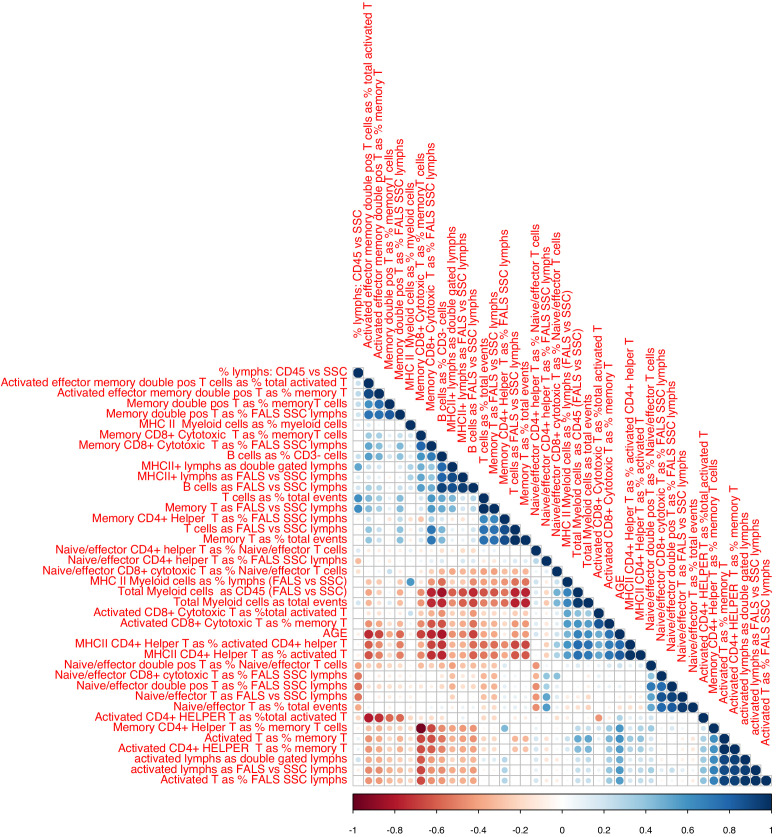
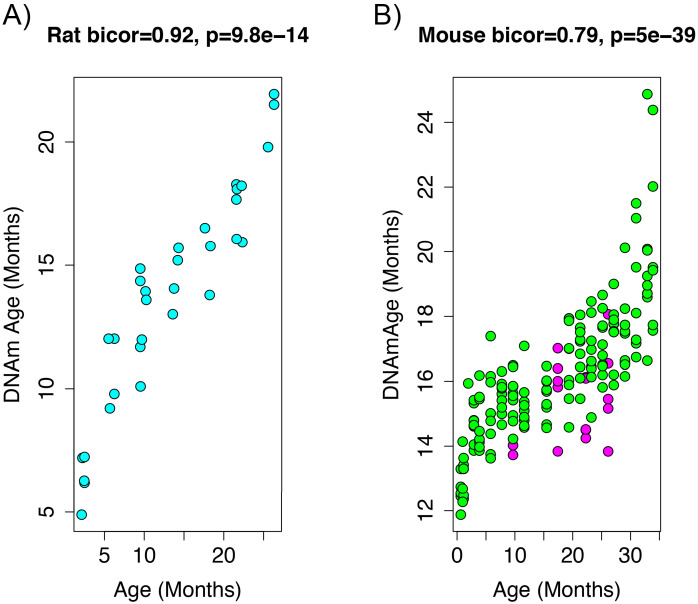
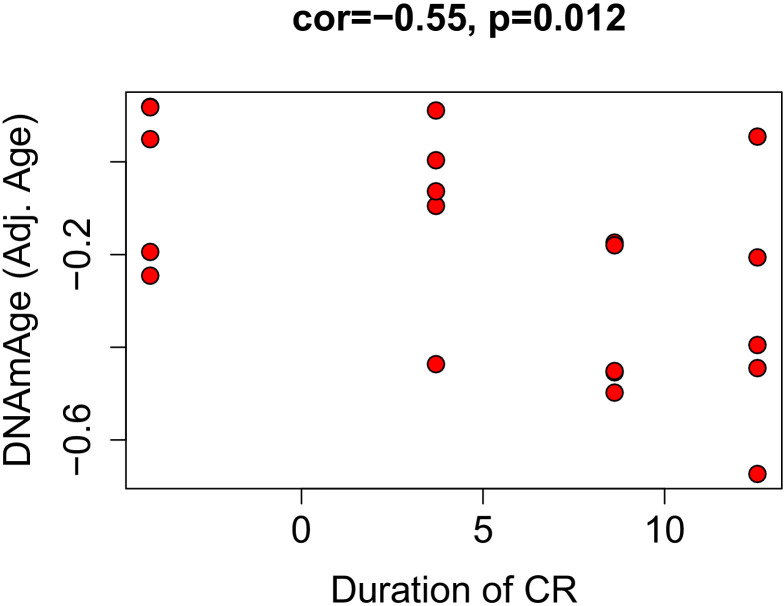
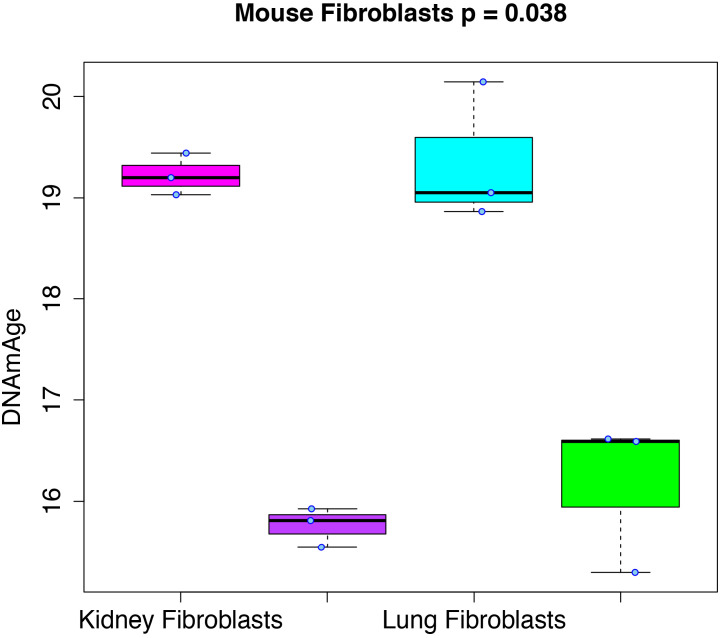
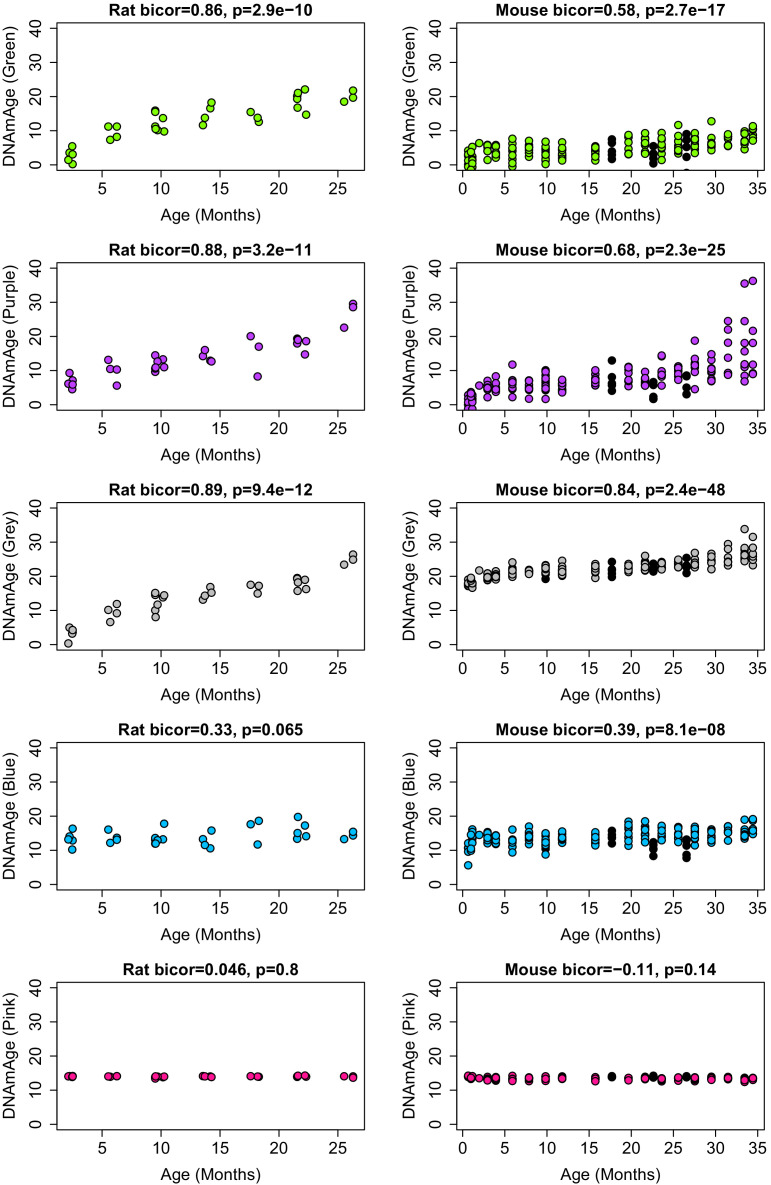
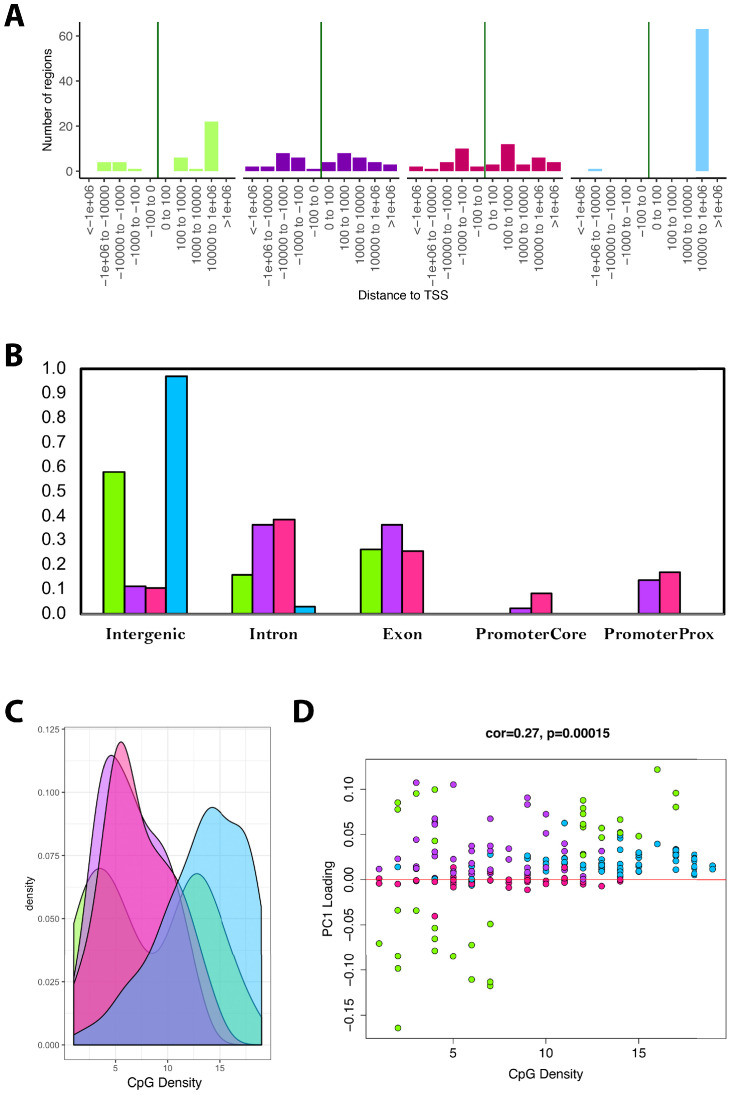
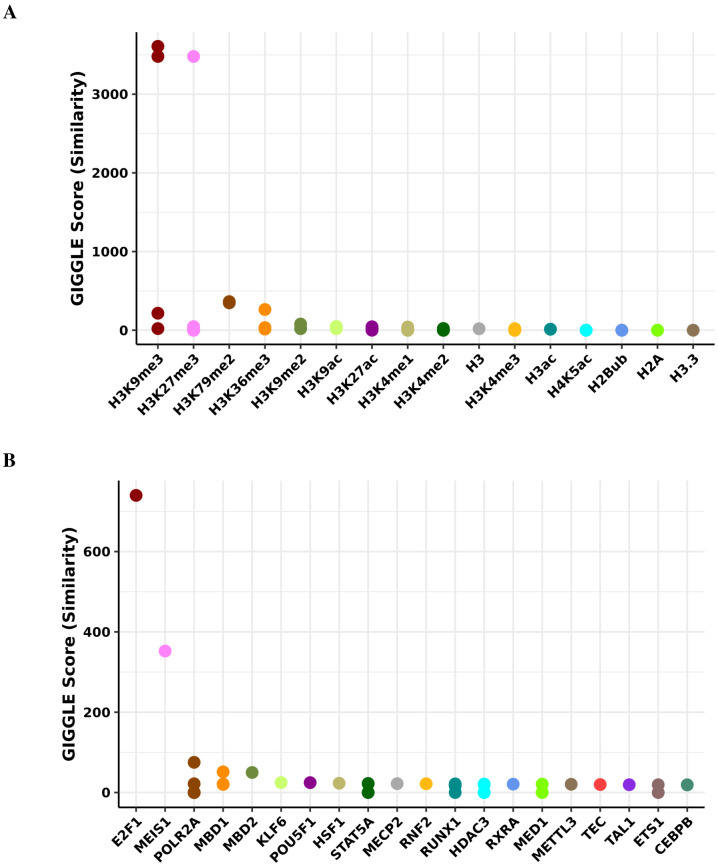
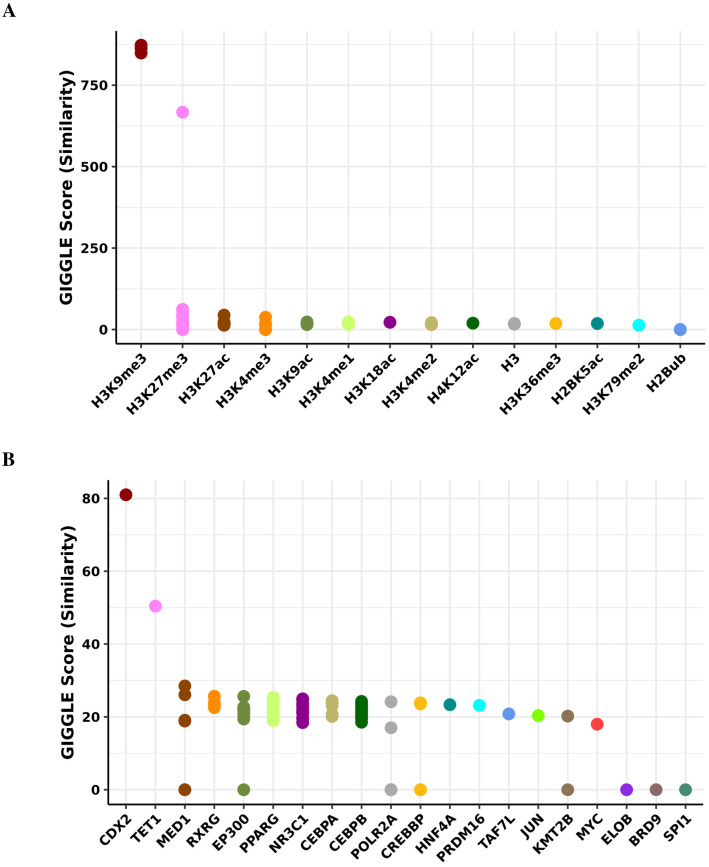
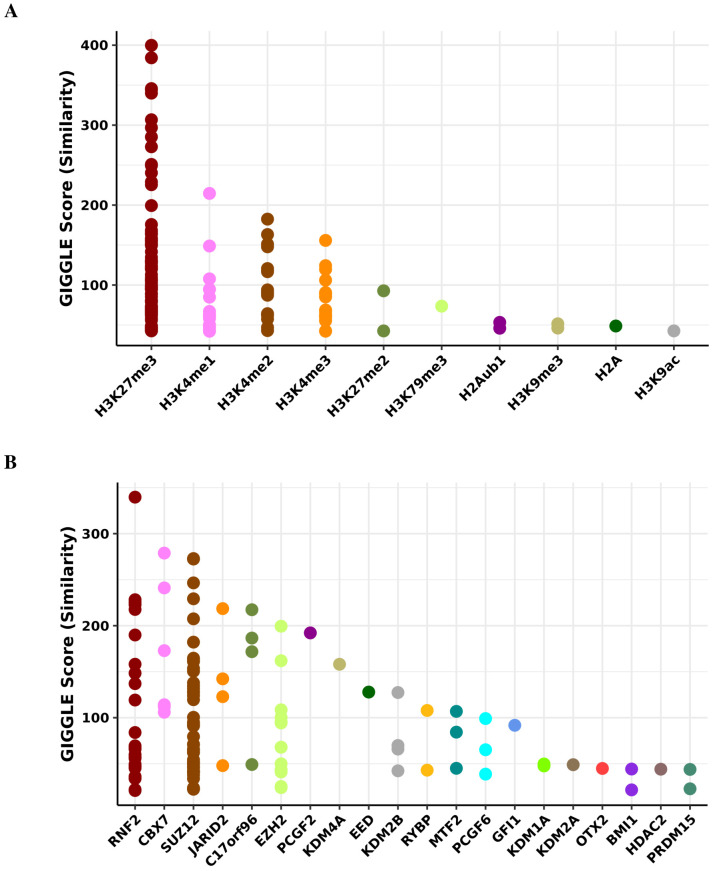
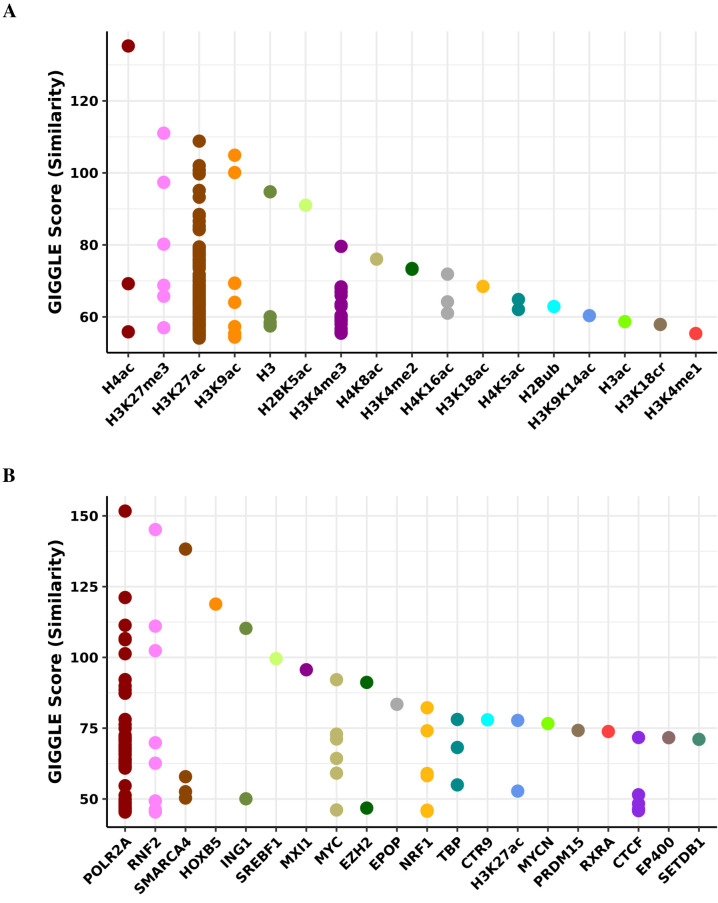
Robust biomarkers of aging have been developed from DNA methylation in humans and more recently, in mice. This study aimed to generate a novel epigenetic clock in rats-a model with unique physical, physiological, and biochemical advantages-by incorporating behavioral data, unsupervised machine learning, and network analysis to identify epigenetic signals that not only track with age, but also relates to phenotypic aging. Reduced representation bisulfite sequencing (RRBS) data was used to train an epigenetic age (DNAmAge) measure in Fischer 344 CDF (F344) rats. This measure correlated with age at (r = 0.93) in an independent sample, and related to physical functioning (p=5.9e-3), after adjusting for age and cell counts. DNAmAge was also found to correlate with age in male C57BL/6 mice (r = 0.79), and was decreased in response to caloric restriction. Our signatures driven by CpGs in intergenic regions that showed substantial overlap with H3K9me3, H3K27me3, and E2F1 transcriptional factor binding.

Keywords: DNA methylation; biological age; caloric restriction; computational biology; epigenetic clock; genetics; genomics; mouse; rat; systems biology.


Conflict of interest statement

ML, RM, MM, KP, AD, TM, CF, KT, MW, CD, MP, Rd, LF No competing interests declared

Figures

Figure 1.
Figure 1.. Principal component analysis (PCA)-based construction of DNAmAge in rats.
(A) Supervised approach: A sample of male F344 rats, ages 1 to 27 months, were split into training (n = 102) and test sets (n = 32). Using DNAm levels measured at 5,505,909 CpGs across the genome as input, we applied elastic net penalized regression to train a predictor of age. Based on training data, 68 CpGs were selected for the DNAmAge measure. The plot shows the biweight midcorrelation between age (x-axis) and DNAmAge (y-axis) in the test sample. (B) Screeplot of variance explained for PCs1-60. A large amount of the variance is captured by PCs 1 and 2, with an elbow forming around PC7, suggesting that the amount of variance explained drops-off significantly after the first six PCs. (C) Unsupervised approach: we converted PC1 (estimated based on PCA in the training sample) to units of months by regressing age on PC1 and then multiplying the coefficient by PC1 and adding the constant in the test sample. We then tested the biweight midcorrelation between PC1 DNAmAge and chronological age.
Figure 1—figure supplement 1.
Figure 1—figure supplement 1.. Tenfold cross-validation of prediction of chronological age using eigenvalues from PCA of DNAm.
Principal component analysis was run on DNAm data and the resulting eigenvalues were used as inputs to train a predictor of age using elastic net penalized regression. Based on 10-fold cross-validation, we found that the most accurate model was derived from a single variable (PC1). The x-axis represents the log of the penalty/shrinkage parameter, lambda. The y-axis depicts the MSE for the 10-fold analysis, with means plotted as red dots and standard errors plots shown. The values across the top of the graph show the number of variables selected as a function of the lambda (x-axis). The lowest MSE (left most dashed line) was for log(lambda)=0.775, which selected a model with only one variable (PC1).
Figure 1—figure supplement 2.
Figure 1—figure supplement 2.. Age associations for PCs1-3 from FACS and phenotype data.
PCs were generated from 39 variables of white blood cell composition using FACS (top row) and from ten phenotypic variables (bottom row), which included eight summarized open-field test variables and two rotarod variables (max time and mean time). In both instances, only PC1 is strongly correlated with age.
Figure 1—figure supplement 3.
Figure 1—figure supplement 3.. Associations between chronological age and phenotypic data (open field and rotarod).
Sizes and colors of circles depict correlation coefficients. Variables are ordered according to hieratical clustering.
Figure 1—figure supplement 4.
Figure 1—figure supplement 4.. Associations between chronological age and FACS data.
Sizes and colors of circles depict correlation coefficients. Variables are ordered according to hieratical clustering.
Figure 2.
Figure 2.. Age correlation in rats and mice using the restricted overlapping CpGs.
(A) PC1 DNAmAge was re-estimated using only the CpGs that were overlapped between rat and mouse (n = 3,625). Although this variable contained only 0.066% of the CpGs in the original measure, we were able to observe an equivalent age biweight midcorrelation. (B) This variable was then applied to data from C57BL/6 mice and was found to be strongly correlated with age (biweight midcorrelation). We also observed the calorie-restricted mice (magenta) trended towards lower DNAmAge than ad libitum fed animals (green)—significance was tested using OLS regression.
Figure 2—figure supplement 1.
Figure 2—figure supplement 1.. Correlations between duration of caloric restriction and epigenetic age acceleration.
Based on the equation of DNAm regressed on age in ad libitum fed mice, we calculated age adjusted DNAmAge for calorically restricted animals. This value represents how much epigenetically older/younger a mouse is compared to what is expected for its chronological age. It is similar to the delta (DNAmAge—Age), but also accounts for non-linearities and bias in over-/under-estimation with age. We found that this was correlated with duration the animal had been on CR, suggesting that a longer time spent on the intervention was associated with a greater reduction in epigenetic age.
Figure 3.
Figure 3.. Rejuvenation of fibroblast-derived iPSCs.
We applied our DNAmAge measure to data from kidney and lung fibroblast controls and derived iPSCs (GSE80672). We find that a significant reduction (Kruskal-Wallis test) in DNAmAge for lung- and kidney-derived iPSCs versus controls.
Figure 4.
Figure 4.. PC1 loadings (for overlapped CpGs from mouse data) by module.
Each of the 3625 CpGs was assigned to a module (i.e. green, purple, pink, blue, grey). The y-axis shows the loadings from PC1 that was used to signify the DNAmAge measure. The Purple and Blue modules tend to have CpGs with positive loadings, signifying that DNAm levels for CpGs in these modules were more strongly related to higher DNAmAge. The green module had CpGs with both high positive and high negative loadings, suggesting that half the CpGs in this module are hypomethylated in accordance with higher DNAmAge whereas the other half are hypermethylated with higher DNAmAge. p-Values denotes significance using Kruskal-Wallis test.
Figure 4—figure supplement 1.
Figure 4—figure supplement 1.. Dendrogram from WGCNA.
The y-axis pertains to distance, such that lower values pertain to higher topological overlap. The first column displays the module colors for each CpG—the majority of CpGs are unassigned (grey module), whereas a smaller proportion are in the green, blue, pink, or purple modules. PC1 loadings for the PC used for DNAmAge is shown in the second column (red is positive, blue is negative). CpGs in the purple and blue module tend to have strong positive loadings, whereas green has a mix of strong positive and negative loadings, that segregate based on the dendrogram.
Figure 4—figure supplement 2.
Figure 4—figure supplement 2.. Correlations between module-based DNAmAge and age in both rats and mouse.
Modules are denoted by color. Panels in the first column show biweight micorrelations between age and DNAm Age in the validation set for rats. Panels in the second column show biweight micorrelations for C57BL/6 Mice. Black dots in the right panels denote samples who underwent caloric restriction starting at 14 weeks.
Figure 5.
Figure 5.. Module characteristics.
(A) Base-pair proximities of CpGs to Transcription Start Sites (TSS), according to module assignment (denoted by color). We find a high proportion of CpGs in the blue module (and to some extent the green module) are located 10,000 to 1,000,000 downstream of TSS. (B) Proportion of CpGs in various genomic regions as a function of module (denoted by color). Results suggest that 98% of CpGs in the blue module and 60% of CpGs in the green module are in intergenic regions. (C) Distribution of surrounding CpGs densities according to module (denoted by color). CpG density was (x-axis) was calculated as the number of CpGs within a 100 bp window (50 bp on either side of the CpG of interest). We observed that the blue module tended to be comprised of CpGs located in regions of higher CpG density (island), while the green module was bimodal, with half the CpGs in it being located in high-density regions, and the other half in low-density regions. (D) We then plotted CpG density as a function of the CpG loading for PC1 that was used to estimate DNAmAge from overlapped CpGs. We find that for the green module, CpGs with strong negative loadings are in low-density regions, while those with high loadings are in both low- and high-density regions.
Figure 5—figure supplement 1.
Figure 5—figure supplement 1.. Transcription factor binding and histone mark enrichment for blue module.
Based on the genomic locations of CpGs in the blue module (n = 64), Cistrome Project database (http://cistrome.org) was used to assess enrichment for binding overlap of histone marks and variants (A) and transcription factors and chromatic regulators (B).
Figure 5—figure supplement 2.
Figure 5—figure supplement 2.. Transcription factor binding and histone mark enrichment for green module.
Based on the genomic locations of CpGs in the green module (n = 38), Cistrome Project database (http://cistrome.org) was used to assess enrichment for binding overlap of histone marks and variants (A) and transcription factors and chromatic regulators (B).
Figure 5—figure supplement 3.
Figure 5—figure supplement 3.. Transcription factor binding and histone mark enrichment for purple module.
Based on the genomic locations of CpGs in the purple module (n = 44), Cistrome Project database (http://cistrome.org) was used to assess enrichment for binding overlap of histone marks and variants (A) and transcription factors and chromatic regulators (B).
Figure 5—figure supplement 4.
Figure 5—figure supplement 4.. Transcription factor binding and histone mark enrichment for pink module.
Based on the genomic locations of CpGs in the pink module (n = 47), Cistrome Project database (http://cistrome.org) was used to assess enrichment for binding overlap of histone marks and variants (A) and transcription factors and chromatic regulators (B).

References

    1. Ambatipudi S, Horvath S, Perrier F, Cuenin C, Hernandez-Vargas H, Le Calvez-Kelm F, Durand G, Byrnes G, Ferrari P, Bouaoun L, Sklias A, Chajes V, Overvad K, Severi G, Baglietto L, Clavel-Chapelon F, Kaaks R, Barrdahl M, Boeing H, Trichopoulou A, Lagiou P, Naska A, Masala G, Agnoli C, Polidoro S, Tumino R, Panico S, Dollé M, Peeters PHM, Onland-Moret NC, Sandanger TM, Nøst TH, Weiderpass E, Quirós JR, Agudo A, Rodriguez-Barranco M, Huerta Castaño JM, Barricarte A, Fernández AM, Travis RC, Vineis P, Muller DC, Riboli E, Gunter M, Romieu I, Herceg Z. DNA methylome analysis identifies accelerated epigenetic ageing associated with postmenopausal breast Cancer susceptibility. European Journal of Cancer. 2017;75:299–307. doi: 10.1016/j.ejca.2017.01.014. - DOI - PMC - PubMed
    1. Bocklandt S, Lin W, Sehl ME, Sánchez FJ, Sinsheimer JS, Horvath S, Vilain E. Epigenetic predictor of age. PLOS ONE. 2011;6:e14821. doi: 10.1371/journal.pone.0014821. - DOI - PMC - PubMed
    1. Ellenbroek B, Youn J. Rodent models in neuroscience research: is it a rat race? Disease Models & Mechanisms. 2016;9:1079–1087. doi: 10.1242/dmm.026120. - DOI - PMC - PubMed
    1. Guo W, Fiziev P, Yan W, Cokus S, Sun X, Zhang MQ, Chen PY, Pellegrini M. BS-Seeker2: a versatile aligning pipeline for bisulfite sequencing data. BMC Genomics. 2013;14:774. doi: 10.1186/1471-2164-14-774. - DOI - PMC - PubMed
    1. Hannum G, Guinney J, Zhao L, Zhang L, Hughes G, Sadda S, Klotzle B, Bibikova M, Fan JB, Gao Y, Deconde R, Chen M, Rajapakse I, Friend S, Ideker T, Zhang K. Genome-wide methylation profiles reveal quantitative views of human aging rates. Molecular Cell. 2013;49:359–367. doi: 10.1016/j.molcel.2012.10.016. - DOI - PMC - PubMed

Publication types

Associated data