. 2021 May;70(5):1475-1488.
doi: 10.1007/s00262-020-02785-4. Epub 2020 Nov 12.

Modeling of tumor response to macrophage and T lymphocyte interactions in the liver metastatic microenvironment

Affiliations

Modeling of tumor response to macrophage and T lymphocyte interactions in the liver metastatic microenvironment

Louis T Curtis et al. Cancer Immunol Immunother. 2021 May.

Erratum in

Abstract

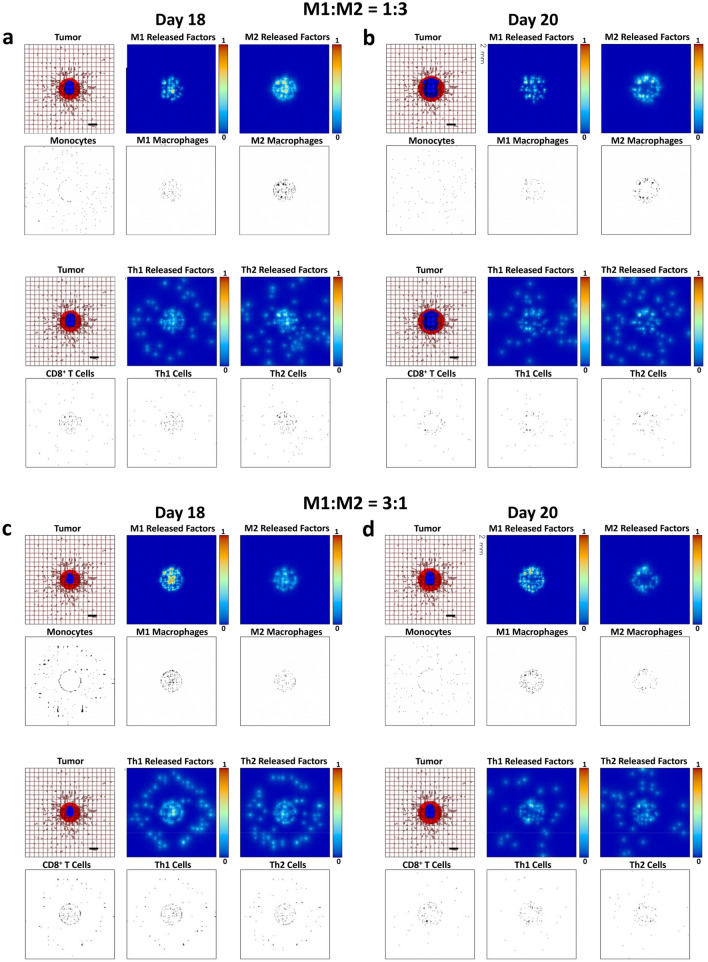
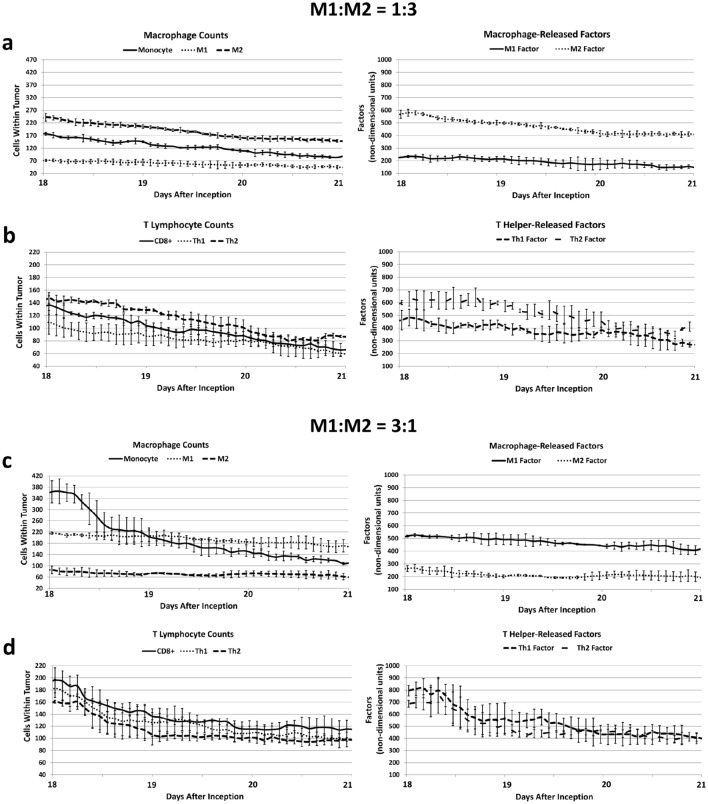
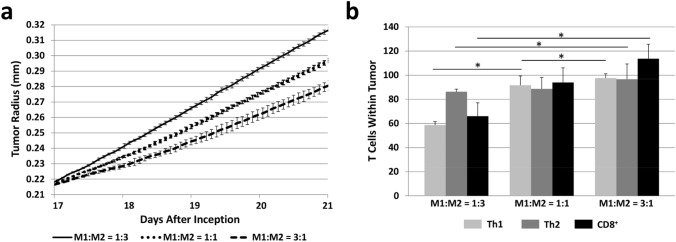
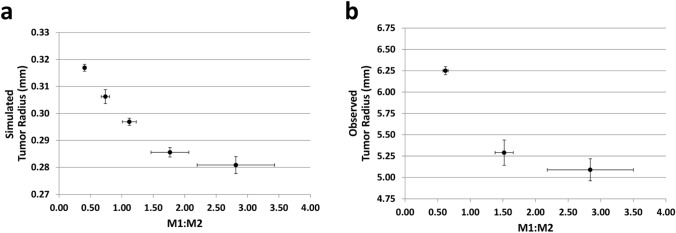
The dynamic interactions between macrophages and T-lymphocytes in the tumor microenvironment exert both antagonistic and synergistic functions affecting tumor growth. Extensive experimental effort has been expended to investigate immunotherapeutic strategies targeting macrophage polarization as well as T-cell activation with the goal to promote tumor cell killing and cancer elimination. However, these interactions remain poorly understood, and cancer immunotherapeutic strategies are often disappointing. The complex system encompassing innate and adaptive immune cell activity in response to tumor growth could benefit from a systems perspective built upon mathematical modeling. This study develops a modeling system to help evaluate the effects of macrophage and T-lymphocyte interactions on tumor growth. The system enables simulating the combined cytotoxic and tumor-promoting interactions of these two immune cell populations in a vascularized organ microenvironment, such as in liver metastases. A hypothetical immunotherapeutic strategy is simulated to increase the number of tumor-suppressive (M1-phenotype) vs. tumor-promoting (M2-phenotype) macrophages to gauge their effects on CD8+ T-cells and CD4+ T-helper cells, which in turn affect the macrophage functions. The results highlight the dynamic interactions between macrophages and T-lymphocytes in the tumor microenvironment and show that with the chosen set of parameter values, the overall cytotoxic effect from macrophages and T-lymphocytes obtained by driving the M1:M2 ratio higher could saturate and fail to achieve tumor regression. Further expansion of this modeling platform to include additional tumor-immune cell interactions, coupled with parameters representing particular tumor characteristics, could enable systematic evaluation of immunotherapeutic strategies tailored to patient-tumor specific conditions, including metastatic disease.

Keywords: Cancer immunotherapy; Cancer simulation; Liver metastasis; Mathematical modeling; T lymphocytes; Tumor-associated macrophages.


Conflict of interest statement

The authors have no conflicts to disclose.

Figures

Fig. 1
Fig. 1
Representative simulation of a tumor lesion at 18 days after inception. Left panel shows metastatic tumor proliferating (red) and hypoxic (blue) tissue embedded in a regularly vascularized capillary bed (grid lines). Irregular lines indicate vessel growth in response to angiogenic stimuli by the tumor tissue. Middle panel illustrates the oxygen concentration (normalized to the maximum in the vasculature), indicating hypoxia in the tumor interior and a ring of higher oxygenation due to developing angiogenesis surrounding the growing tumor. Right panel shows the concentration (non-dimensionalized) of immune cell chemoattractants, such as VEGF, secreted by tumor cells and diffusing into the surrounding microenvironment. Bar = 200 μm
Fig. 2
Fig. 2
Simulated immune cell activity in response to a growing tumor at 18 days and 20 days after inception. Panels a, b Untreated condition. Top row: monocytes extravasate from vasculature and up the gradient of macrophage chemoattractants towards the tumor tissue. Monocytes differentiate into an M1 or M2 phenotype in response to microenvironmental conditions favoring a ratio of 1:3. The M1 macrophages release cytotoxic factors, such as nitric oxide, while M2 macrophages secrete growth factors promoting tumor proliferation. Bottom row: T lymphocytes exit the vasculature in the vicinity of the tumor and migrate towards it, with CD8+ T cells and CD4+ T helper 1 (Th1) cells having cell killing properties and CD4+ T helper 2 (Th2) cells releasing factors promoting tumor growth. The macrophages and T lymphocytes interact with each other in the microenvironment, influencing their respective response to the tumor. Panels c, d Simulation of a hypothetical immunotherapeutic strategy that increases the M1:M2 ratio to 3:1. In comparison to panels a, b. the therapy leads to higher numbers of cytotoxic CD8+ T cells and CD4+ T helper 1 (Th1) cells, with visibly diminished tumor growth. The Th2 cell number seems to slightly increase. Colors as in Fig. 1. Bar = 200 μm
Fig. 3
Fig. 3
Simulated macrophage and T lymphocyte cell numbers over a period of tumor growth. Panels a, b Microenvironmental conditions favoring tumorigenic activity. a The ratio of M1:M2 macrophages is approximately 1:3, which promotes tumor tissue proliferation and angiogenesis via a high level of M2-secreted growth factors. b The increased M2 macrophage and tissue activity in turn promotes higher Th2 cell over Th1 and CD8+ T cell numbers, which lead to higher levels of Th2-secreted cytokines promoting tumor growth. Panels c, d Simulation of a hypothetical immunotherapeutic regimen favoring macrophage polarization towards the M1 phenotype. This therapy shifts the M1:M2 ratio to 3:1. c Compared to the untreated condition (panels a, b), M1 macrophage secreted factors are increased while M2 macrophage secreted factors are lowered. d In response, Th1 cell numbers further increase while Th2 cell numbers decrease, and their, respectively, released factors correspondingly change. The combination of these effects increases the CD8+ T cell numbers. All values: mean ± SD, n = 3
Fig. 4
Fig. 4
Quantification of simulated tumor growth subjected to a hypothetical immunotherapy that raises the M1:M2 ratio. a Tumor growth trajectory corresponding to untreated (M1:M2 = 1:3) as well as under treatment that increases M1:M2 to 1:1 and M1:M2 to 3:1. The macrophages interact with T lymphocytes in the vascularized tumor microenvironment to both counteract and promote the tumor growth. Increasing the M1:M2 ratio decreases the tumor growth but fails to restrain it. b T cells within the tumor tissue at 21 days after inception. All values: mean ± SD, n = 3, *p < 0.05
Fig. 5
Fig. 5
Tumor tissue response to an immunotherapeutic strategy that raises the M1:M2 macrophage ratio. a Simulated change in tumor radius as a function of the M1:M2 ratio (mean ± SD, n = 3). b Experimentally observed change in tumor radius as a function of the M1:M2 ratio in Lewis lung carcinoma xenografts grown in immunogenic mice (data from [48], mean ± SEM, n = 5). Tumors were subjected to M2-ablation treatment to raise this ratio
Fig. 6
Fig. 6
Simulated change of tumor radius in time (growth velocity) plotted as a function of the M1:M2 ratio being shifted by a theoretical immunotherapy targeting macrophage polarization (mean ± SD, n = 3)

References

    1. Bremnes RM, Donnem T, Al-Saad S, Al-Shibli K, Andersen S, Sirera R, Camps C, Marinez I, Busund LT. The role of tumor stroma in cancer progression and prognosis: emphasis on carcinoma-associated fibroblasts and non-small cell lung cancer. J Thorac Oncol. 2011;6(1):209–217. doi: 10.1097/JTO.0b013e3181f8a1bd. - DOI - PubMed
    1. Wu J, Lanier LL. Natural killer cells and cancer. Adv Cancer Res. 2003;90:127–156. doi: 10.1016/s0065-230x(03)90004-2. - DOI - PubMed
    1. Wu L, Saxena S, Awaji M, Singh RK. Tumor-associated neutrophils in cancer: going pro. Cancers (Basel) 2019 doi: 10.3390/cancers11040564. - DOI - PMC - PubMed
    1. Ma Y, Shurin GV, Peiyuan Z, Shurin MR. Dendritic cells in the cancer microenvironment. J Cancer. 2013;4(1):36–44. doi: 10.7150/jca.5046. - DOI - PMC - PubMed
    1. Olingy CE, Dinh HQ, Hedrick CC. Monocyte heterogeneity and functions in cancer. J Leukoc Biol. 2019;106(2):309–322. doi: 10.1002/JLB.4RI0818-311R. - DOI - PMC - PubMed