. 2020 Nov 12;15(11):e0242211.
doi: 10.1371/journal.pone.0242211. eCollection 2020.

Ikaros antagonizes DNA binding by STAT5 in pre-B cells

Affiliations

Ikaros antagonizes DNA binding by STAT5 in pre-B cells

Beate Heizmann et al. PLoS One. .

Erratum in

Abstract

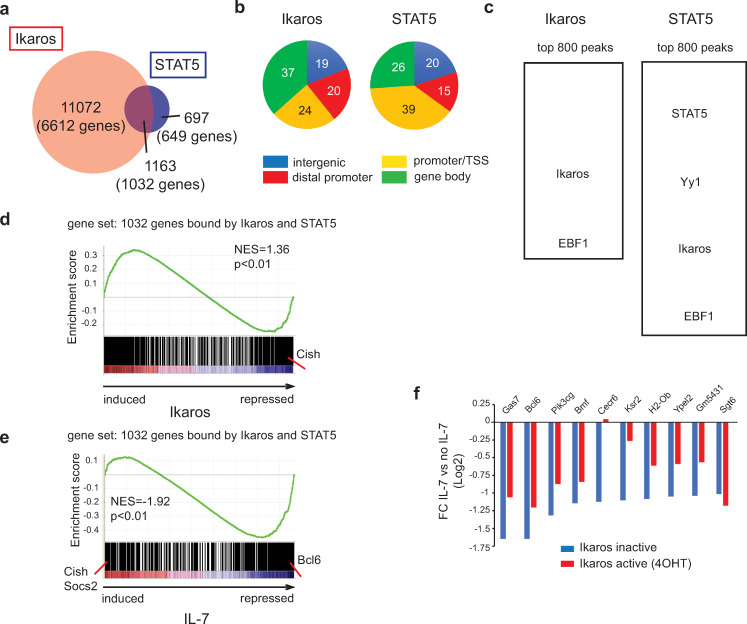
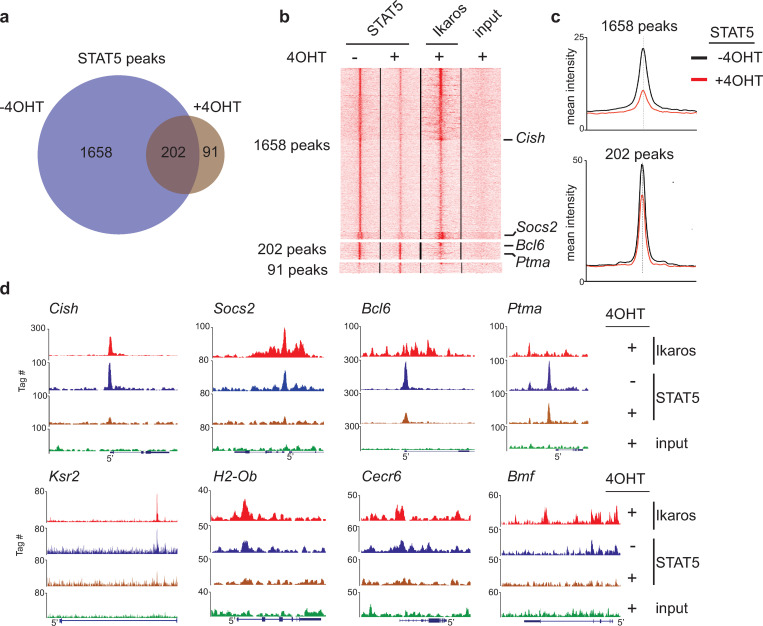
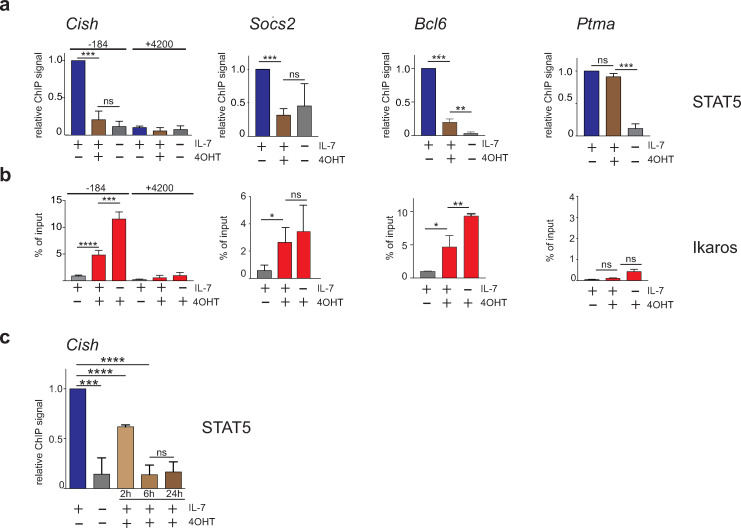
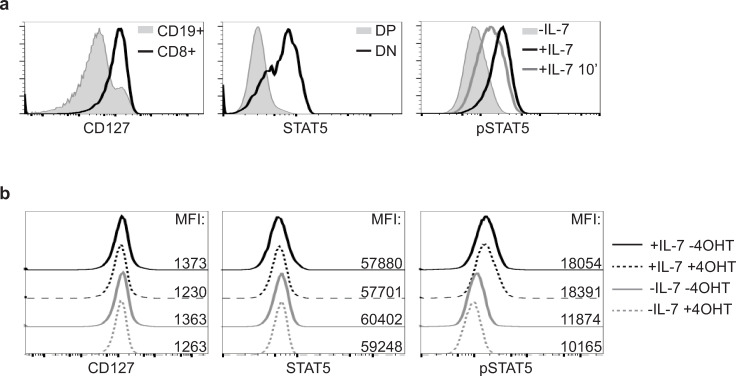
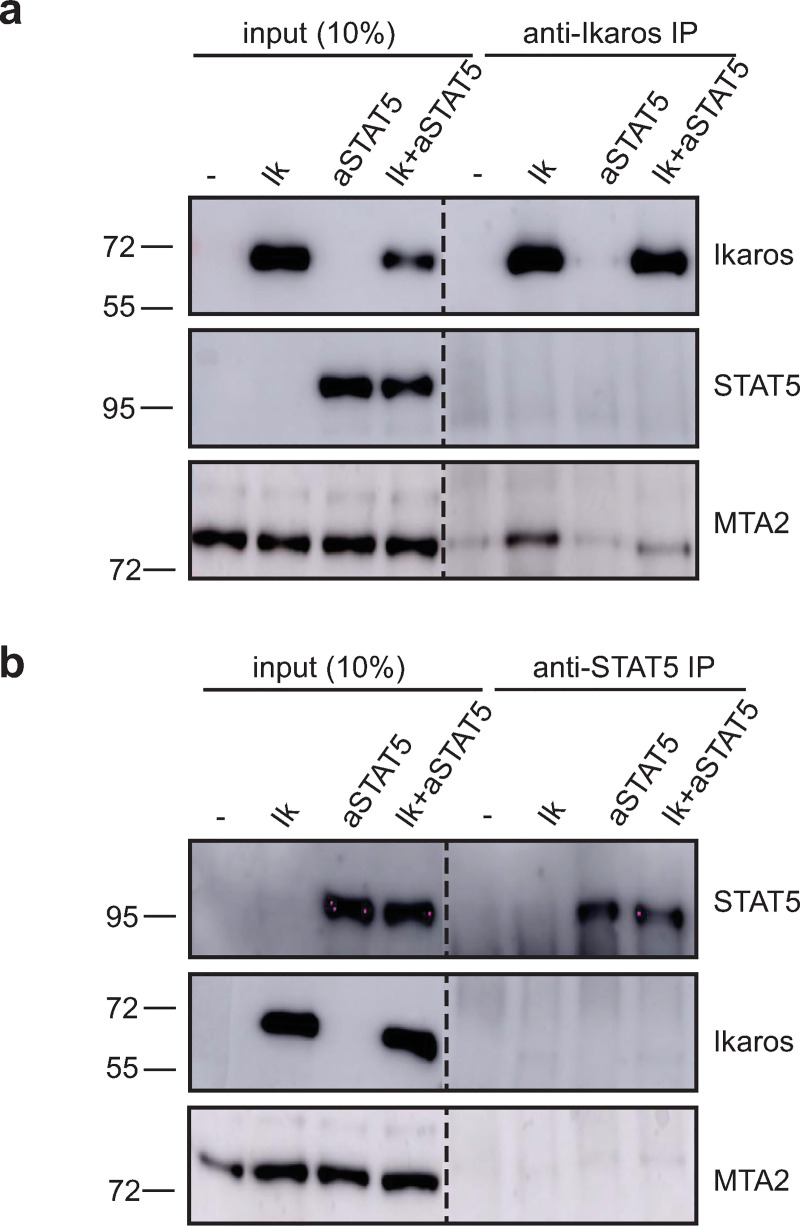
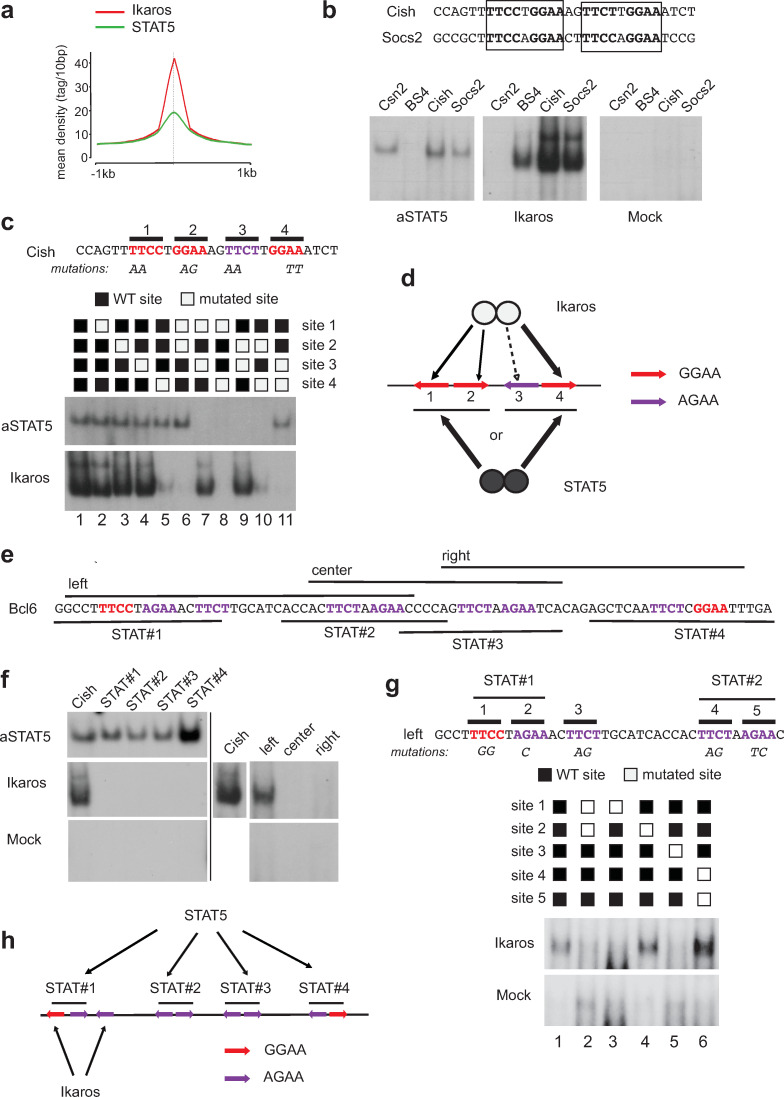
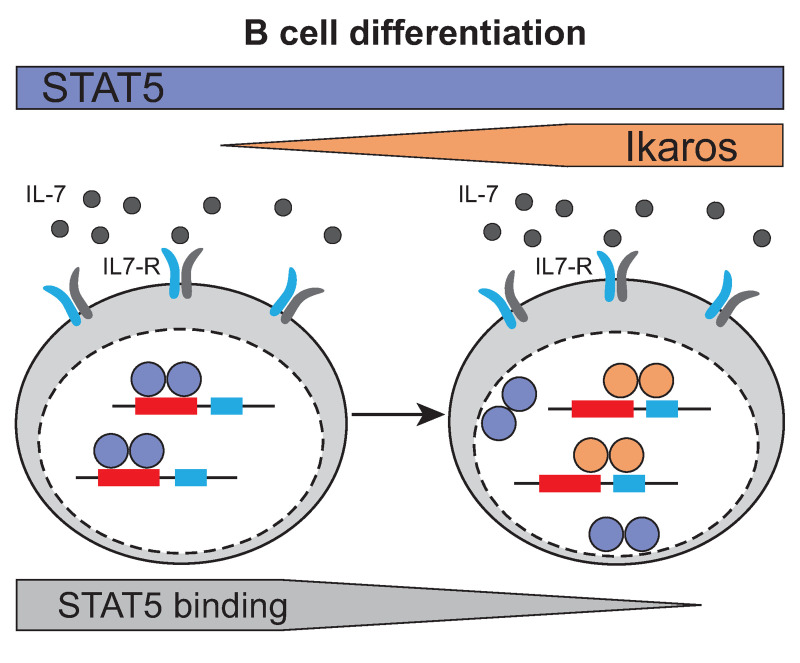
The IKZF1 gene, which encodes the Ikaros transcription factor, is frequently deleted or mutated in patients with B-cell precursor acute lymphoblastic leukemias that express oncogenes, like BCR-ABL, which activate the JAK-STAT5 pathway. Ikaros functionally antagonizes the transcriptional programs downstream of IL-7/STAT5 during B cell development, as well as STAT5 activity in leukemic cells. However, the mechanisms by which Ikaros interferes with STAT5 function is unknown. We studied the genomic distribution of Ikaros and STAT5 on chromatin in a murine pre-B cell line, and found that both proteins colocalize on >60% of STAT5 target regions. Strikingly, Ikaros activity leads to widespread loss of STAT5 binding at most of its genomic targets within two hours of Ikaros induction, suggesting a direct mechanism. Ikaros did not alter the level of total or phosphorylated STAT5 proteins, nor did it associate with STAT5. Using sequences from the Cish, Socs2 and Bcl6 genes that Ikaros and STAT5 target, we show that both proteins bind overlapping sequences at GGAA motifs. Our results demonstrate that Ikaros antagonizes STAT5 DNA binding, in part by competing for common target sequences. Our study has implications for understanding the functions of Ikaros and STAT5 in B cell development and transformation.


Conflict of interest statement

The authors have declared that no competing interests exist.

Figures

Fig 1
Fig 1. Ikaros and STAT5 DNA binding correlates with Ikaros- and IL-7-dependent gene expression.
(a) Venn diagram depicting the number and overlap of Ikaros and STAT5 binding peaks. (b) Distribution of Ikaros and STAT5 binding peaks on transcriptional start site (TSS) regions (defined as located between -1kb and +100bp of the TSS), gene body (all exons and introns), distal promoter regions (located between -20kb and -1kb of the TSS) and intergenic regions (all other regions). (c) Enriched motifs among the Ikaros and STAT5 bound peaks. Enriched motifs were identified with the MEME algorithm within an 80 bp window centered on the peak summit, and significantly enriched motifs are depicted. Motif analysis was performed on the top 800 peaks [ranked by a score corresponding to nb tags x fold enrichment over input x -10log(p-value)]. (d) GSEA using as gene set genes bound at common genomic regions by both Ikaros and STAT5, and as the ranked gene list all probesets present on the 430 2.0 array, ranked according to the fold change (FC) of expression between IL-7 deprived cells cultured in the presence or absence of 4OHT (24h). (e) GSEA of the same gene set as in (d), where the gene list was ranked according to the FC of expression values measured for cells cultured with or without IL-7 (24h), in the absence of 4OHT. NES: normalized enrichment score. In (d) and (e), the p value is calculated by GSEA on the basis of 100 random permutations of the ranked gene list. (f) Comparison of IL-7-dependent repression in the presence and absence of Ikaros. Genes that were bound by both Ikaros and STAT5 at common regions, and repressed by IL-7 more than 2-fold in the absence of 4OHT, were selected. IL-7-dependent FCs (IL-7 vs no IL-7) were calculated for cells cultured in the presence of vehicle (Ikaros inactive) or 4OHT (Ikaros active). In (d), (e) and (f), transcriptome data are from the dataset GSE51350.
Fig 2
Fig 2. Loss of STAT5 binding upon Ikaros expression at common target genes.
(a) Venn diagram depicting the size and overlap of the STAT5 bound regions in BH1-IK1ER cells cultured in the absence and presence of 4OHT. (b) K-means clustering of the tag densities around the summits of the STAT5 peaks identified in the absence or presence of 4OHT [groups of sites defined in panel (a)]. The position of the peaks illustrated in Fig 2C is indicated. (c) Mean intensity profiles for STAT5 for the sets of 1658 and 202 peaks depicted in panels (a) and (b). (d) Representative genome browser tracks for 7 genes where STAT5 binding is strongly reduced by Ikaros (Cish, Socs2, Bcl6, Ksr2, H2-Ob, Cecr6 and Bmf), and one gene (Ptma) for which STAT5 binding was not affected.
Fig 3
Fig 3. Antagonistic DNA binding by Ikaros and STAT5.
(a) ChIP-qPCR analysis of STAT5 binding to the same genomic regions as those displayed in Fig 2. Data are from 5 (Cish) and 3 (Socs2, Bcl6, Ptma) independent ChIP experiments. The +4200 region of the Cish gene is a control region where Ikaros or STAT5 binding was not detected by ChIP-seq. (b) ChIP-qPCR analysis of Ikaros binding in the same samples as those used in Fig 2, except for Cish for which data are from 4 of the samples. (c) STAT5 binding to the -184 bp region of the Cish gene in cells treated with 4OHT for various periods of time. Data are from 3 independent ChIP experiments. In (a) and (c), data were normalized to the values obtained in the condition (+IL-7, -4OHT) and statistical analysis was performed with the paired t-test. In (b), statistical analysis was performed with an unpaired t-test. (*) p<0.05; (**) p< 0,01; (***) p< 0,001; (****) p<0,0001; ns: not significant.
Fig 4
Fig 4. Ikaros does not affect the level of activated STAT5 proteins.
(a) Controls for the analysis by flow cytometry of the expression of CD127 on splenic CD19+ B cells or CD8+ T cells (left panel), total STAT5 in double negative (DN) and double positive (DP) thymocytes (middle panel) and pSTAT5 in BH1 cells cultured with or without IL-7, or re-stimulated for 10 min after IL-7 withdrawal (+IL-7 10') (right panel). (b) Flow cytometry analysis of BH1-IkER cells upon 24h culture and stained as indicated. Numbers indicate the mean fluorescence intensities (MFI) of the corresponding samples.
Fig 5
Fig 5. Ikaros and STAT5 do not associate.
Western blot analysis for the indicated proteins after immunoprecipitation with anti-Ikaros (a) and anti-STAT5 (b) antibodies. 10% input of nuclear extracts of COS cells transfected with empty vector (-), or expression vectors for Ikaros-1 (Ik) and a constitutive active form of STAT5a (aSTAT5) are shown. The dashed lines indicate two parts of the same membrane. The original and uncropped Western blot images are provided in S1 Raw images.
Fig 6
Fig 6. Ikaros and STAT5 target common sequences in the Cish and Bcl6 genes.
(a) Tag density profiles of Ikaros and STAT5 on the 1163 genomic regions bound by both proteins by ChIP-seq. For both proteins, the curve is centered on the summit of the Ikaros peak. (b) Binding of Ikaros and the constitutive STAT5a mutant (aSTAT5) by EMSA to a conserved element present under the Ikaros/STAT5 peak summits in the Cish and Socs2 genes. Csn2 and BS4 are control probes known to bind respectively STAT5 or Ikaros. Mock corresponds to nuclear extracts from COS cells transfected with an empty expression vector. (c) Mutational analysis of STAT5 and Ikaros binding to the Cish probe (EMSA). (d) Schematic model of the binding of STAT5 and Ikaros dimers to the Cish element. (e) Sequence of the Bcl6 regulatory region under the summit of the STAT5 and Ikaros peaks. STAT5 target motifs are in red, and the various probes used for EMSA (in f) are indicated. (f) Binding of Ikaros and STAT5 to the Bcl6 regulatory regions. (g) Mutational analysis of Ikaros binding to the left probe. (h) Schematic representation of the binding of Ikaros and STAT5 to the Bcl6 regulatory region. The black lines represent the 4 STAT5 target sites. The original and uncropped EMSA autoradiograms are provided in S1 Raw images.
Fig 7
Fig 7. Competition of STAT5 and Ikaros binding to common target genes during B cell differentiation.
During B cell differentiation, increasing Ikaros protein levels induce the displacement of STAT5 from DNA by the partial overlap of Ikaros/STAT5 binding sites at common target genes.

Similar articles

Cited by

References

    1. Clark MR, Mandal M, Ochiai K, Singh H. Orchestrating B cell lymphopoiesis through interplay of IL-7 receptor and pre-B cell receptor signalling. Nat Rev Immunol. 2014;14(2):69–80. 10.1038/nri3570 - DOI - PMC - PubMed
    1. Fistonich C, Zehentmeier S, Bednarski JJ, Miao R, Schjerven H, Sleckman BP, et al. Cell circuits between B cell progenitors and IL-7 + mesenchymal progenitor cells control B cell development. J Exp Med. 2018;215(10):2586–99. 10.1084/jem.20180778 - DOI - PMC - PubMed
    1. Heizmann B, Kastner P, Chan S. Ikaros is absolutely required for pre-B cell differentiation by attenuating IL-7 signals. J Exp Med. 2013;210(13):2823–32. 10.1084/jem.20131735 - DOI - PMC - PubMed
    1. Schwickert TA, Tagoh H, Gültekin S, Dakic A, Axelsson E, Minnich M, et al. Stage-specific control of early B cell development by the transcription factor Ikaros. Nat Immunol. 2014;15(3):283–93. 10.1038/ni.2828 - DOI - PMC - PubMed
    1. Joshi I, Yoshida T, Jena N, Qi X, Zhang J, Van Etten RA, et al. Loss of Ikaros DNA-binding function confers integrin-dependent survival on pre-B cells and progression to acute lymphoblastic leukemia. Nat Immunol. 2014;15(3):294–304. 10.1038/ni.2821 - DOI - PMC - PubMed

Publication types

MeSH terms