

Analysis of the SARS-CoV-2 epidemic in Italy: The role of local and interventional factors in the control of the epidemic
- PMID: 33180880
- PMCID: PMC7660511
- DOI: 10.1371/journal.pone.0242305
Analysis of the SARS-CoV-2 epidemic in Italy: The role of local and interventional factors in the control of the epidemic
Abstract
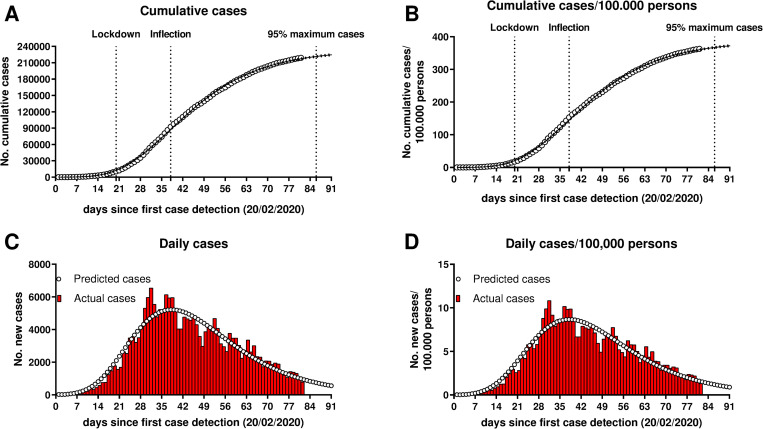
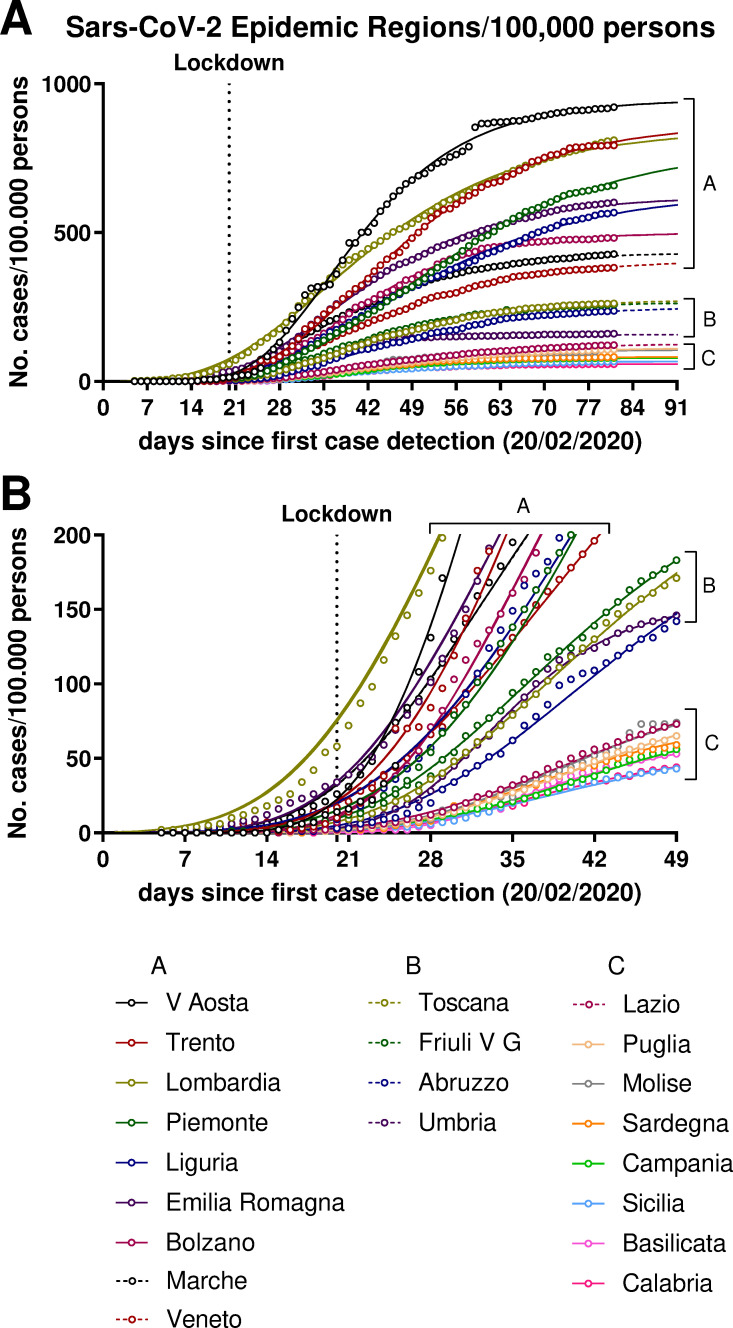
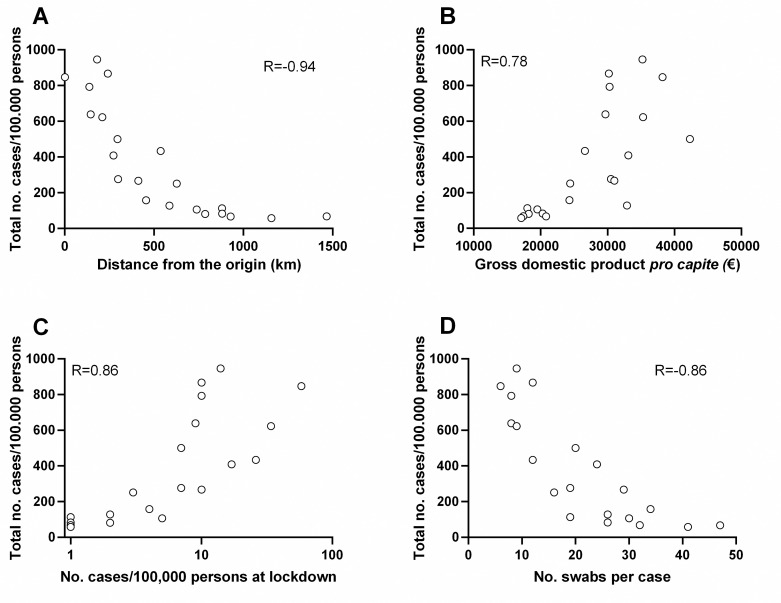
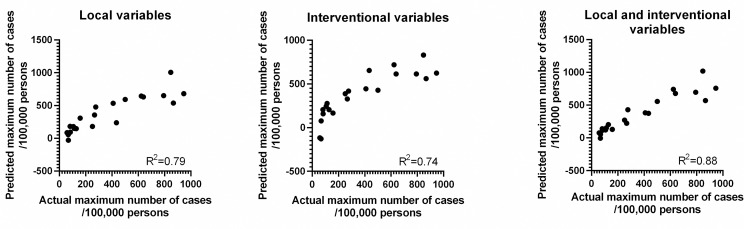
Containment measures have been applied in several countries in order to limit the diffusion of the SARS-CoV-2 epidemic. The scope of this study is to analyze the evolution of the first wave of the SARS-CoV-2 epidemic throughout Italy and factors associated to the different way it spread in the Italian Regions, starting from the day that the first indigenous cases were detected through day 81 (6 days after the end of the strict lockdown). Data were obtained from daily reports and are represented as number (and percentage) of cases/100,000 persons. A lockdown with movement restrictions, especially across Regions, was declared at day 20. At day 81, 219,070 cases (363/100,000 persons) were diagnosed. A regression analysis based on the Gompertz model predicts a total number 233,606 cases (386/100,000 persons) at the end of the epidemic. The 21 areas, divided into Italian Regions and autonomous Provinces, showed a wide range in the frequency of cases at day 81 (58-921, median 258/100,000 persons) and total predicted cases (58-946, median 267/100,000 persons). Similarly, the predicted time for the end of the wave of the epidemic (considering as surrogate marker the time at which 99% of the total cases are predicted to occur) was highly variable, ranging from 64 to 136 (median 99) days. We analyzed the impact of local and interventional variables on the epidemic curve in each Region. The number of cases correlated inversely with the distance from the area in which first cases were detected and directly also with the gross domestic product pro capite (as a marker of industrial activity) of the Region. Moreover, an earlier start of the lockdown (i.e. in the presence of a lower number of cases) and wider testing were associated with a lower final number of total cases. In conclusion, this analysis shows that population-wide testing and early lockdown enforcement appear effective in limiting the spreading of the SARS-CoV-2 epidemic.
Conflict of interest statement
The authors have declared that no competing interests exist.
Figures

References
-
- World Health Organization. Critical preparedness, readiness and response actions for COVID-19: interim guidance, 7 March 2020. https://apps.who.int/iris/handle/10665/331422.
-
- Hale T, Angrist A, Cameron-Blake E, Hallas L, Kira B, Majumdar S, Petherick A, Phillips T, Tatlow H, Webster S. “Variation in Government Responses to COVID-19” Version 7.0. Blavatnik School of Government Working Paper. May 25, 2020. www.bsg.ox.ac.uk/covidtracker [cited October 8, 2020].
-
- World Health Organization. COVID-19 explorer. https://worldhealthorg.shinyapps.io/covid/ [cited October 8 2020].
Publication types
MeSH terms
LinkOut - more resources
Full Text Sources
Miscellaneous
