. 2020 Nov 12;15(11):e0242137.
doi: 10.1371/journal.pone.0242137. eCollection 2020.

Soluble dimeric prion protein ligand activates Adgrg6 receptor but does not rescue early signs of demyelination in PrP-deficient mice

Affiliations

Soluble dimeric prion protein ligand activates Adgrg6 receptor but does not rescue early signs of demyelination in PrP-deficient mice

Anna Henzi et al. PLoS One. .

Abstract

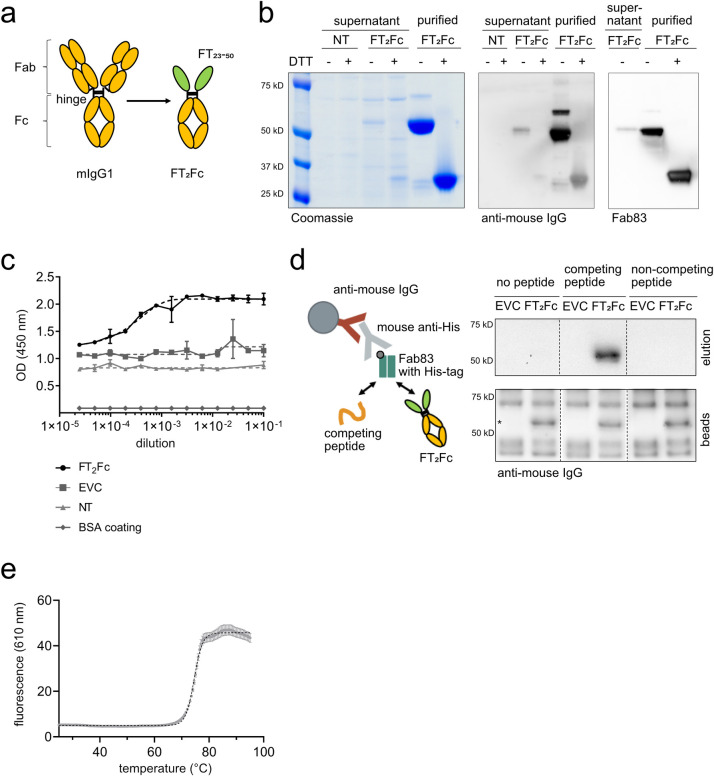
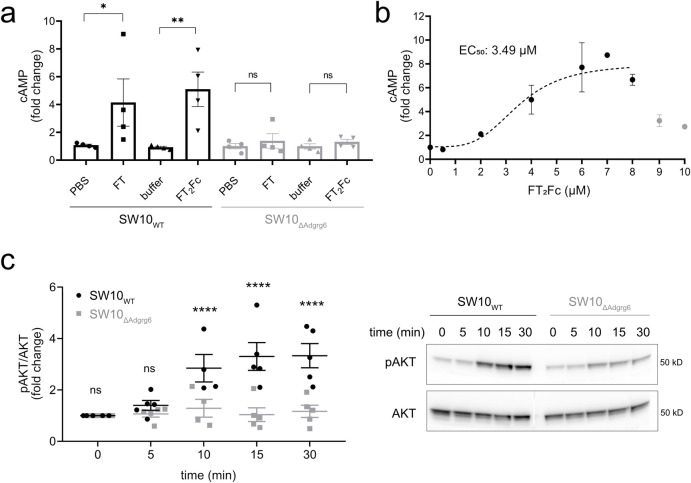
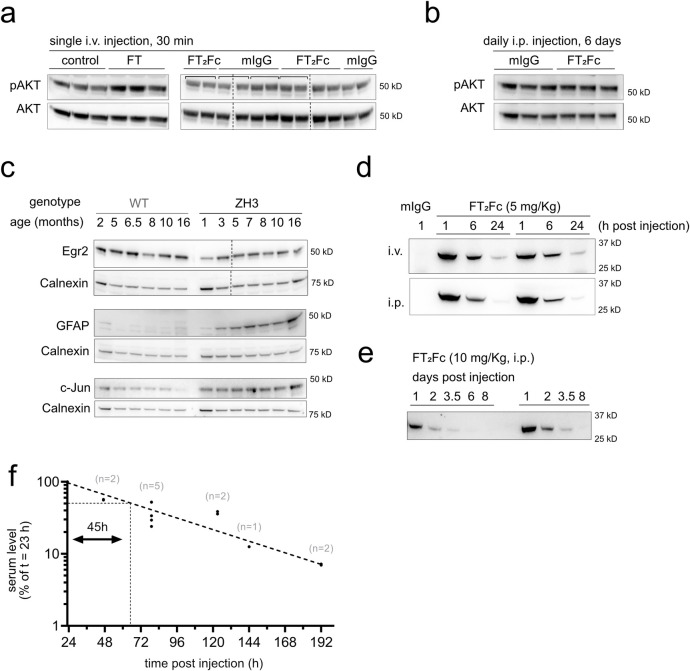
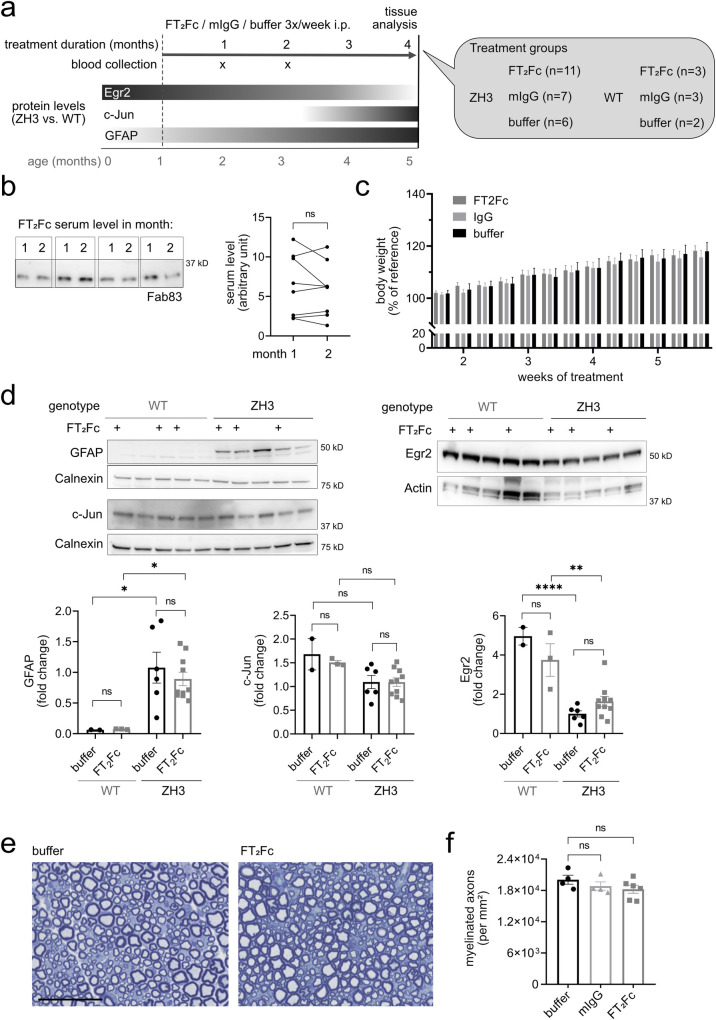
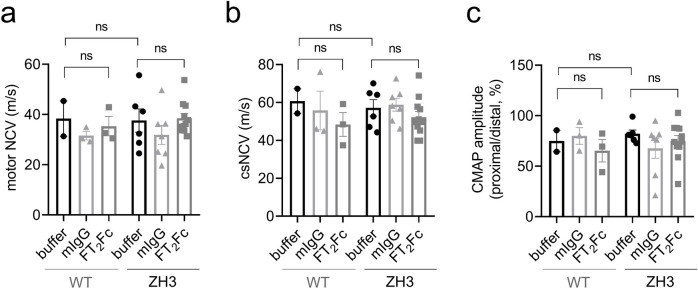
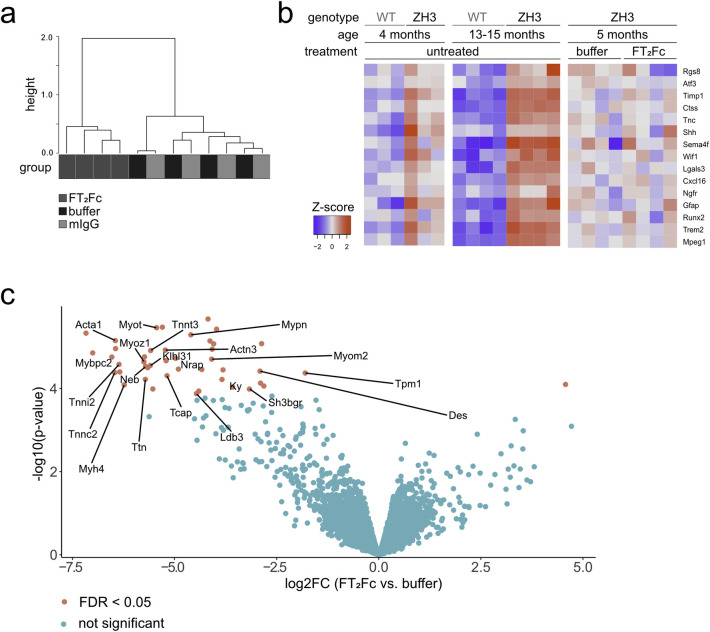
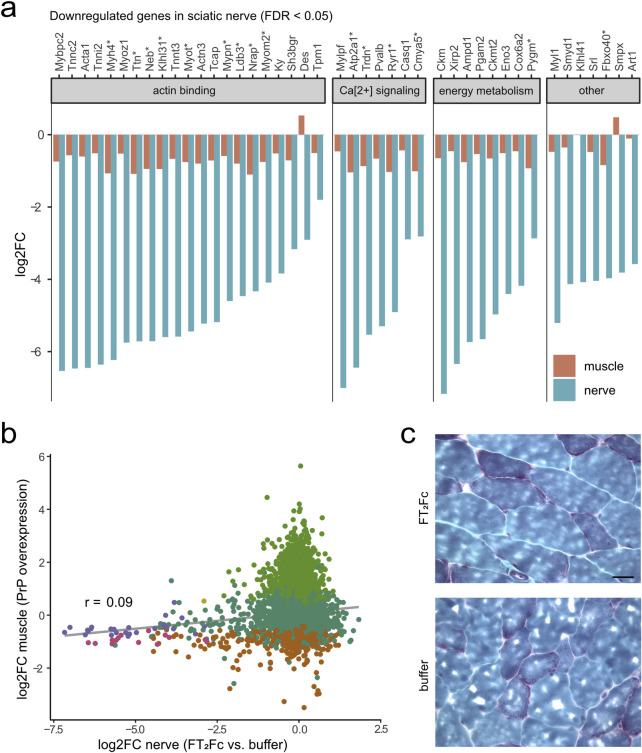
The adhesion G-protein coupled receptor Adgrg6 (formerly Gpr126) is instrumental in the development, maintenance and repair of peripheral nervous system myelin. The prion protein (PrP) is a potent activator of Adgrg6 and could be used as a potential therapeutic agent in treating peripheral demyelinating and dysmyelinating diseases. We designed a dimeric Fc-fusion protein comprising the myelinotrophic domain of PrP (FT2Fc), which activated Adgrg6 in vitro and exhibited favorable pharmacokinetic properties for in vivo treatment of peripheral neuropathies. While chronic FT2Fc treatment elicited specific transcriptomic changes in the sciatic nerves of PrP knockout mice, no amelioration of the early molecular signs demyelination was detected. Instead, RNA sequencing of sciatic nerves revealed downregulation of cytoskeletal and sarcomere genes, akin to the gene expression changes seen in myopathic skeletal muscle of PrP overexpressing mice. These results call for caution when devising myelinotrophic therapies based on PrP-derived Adgrg6 ligands. While our treatment approach was not successful, Adgrg6 remains an attractive therapeutic target to be addressed in other disease models or by using different biologically active Adgrg6 ligands.


Conflict of interest statement

The authors have declared that no competing interests exist.

Figures

Fig 1
Fig 1. Characterization of FT2Fc.
(a) Design of FT2Fc. FT was fused to mIgG1-Fc at the hinge, thereby replacing the antigen-binding fragment (Fab) and forming a homodimeric Fc-fusion protein. (b) FT2Fc was secreted by 293-F cells after transient transfection and was present in the cell culture supernatant as a homodimer with a size of 56 kD. Under reducing conditions (+DTT), FT2Fc was present as a monomer. FT2Fc was detected in western blotting by antibodies targeting the Fc-fragment and a Fab specific for FT (Fab83). Supernatant from non-transfected cells (NT) was used as negative control. (c) Sandwich ELISA of serially diluted cell culture supernatant from cells transfected with FT2Fc showed a sigmoidal curve. The optical-density (OD)—dilution curves were fitted using the four-parameter logistic nonlinear regression model (dashed lines, R2 = 0.94 for FT2Fc). Only background signal was detected in supernatant from cells transfected with the empty vector control (EVC) or non-transfected cells (NT), or when the plate was coated with BSA instead of Fab83. (d) Design of the immunoprecipitation assay (left). Western blots of eluates and beads boiled in sample loading buffer (right). FT2Fc was captured in cell culture supernatant by beads coated with Fab83 and was eluted with a peptide specifically competing for the Fab83 binding site, but not with a non-competing peptide. The western blot from the beads confirmed that FT2Fc (size of specific bands marked with *) was bound to the beads in all conditions. (e) In the thermal shift assay, the unfolding of FT2Fc with increasing temperature was monitored using a fluorescent dye. The curve was fitted to the Boltzmann equation (dashed line, R2 = 0.99). The inflection point at 74.5°C corresponds to the melting temperature of FT2Fc in 20 mM sodium phosphate, pH 7.
Fig 2
Fig 2. Activation of Adgrg6 by FT2Fc in vitro.
(a) FT and FT2Fc elicited an increase in cAMP levels in SW10WT cells, but not in SW10ΔAdgrg6 cells. cAMP levels were measured 20 min after treatment with 5 μM FT or 2.5 μM FT2Fc. To account for variability in cAMP levels across cell lines, cAMP was expressed as x-fold change to the average of the controls (PBS and 20 mM sodium phosphate buffer) for each of the 4 independent experiments. One-way ANOVA for selected comparisons, Sidak’s multiple comparisons test: in SW10WT FT vs. PBS p = 0.0392, FT2Fc vs. buffer p = 0.0035. In SW10ΔAdgrg6 FT and FT2Fc vs. controls p > 0.05. (b) SW10WT cells were incubated with increasing concentrations of FT2Fc. cAMP levels increased up to a maximum of a 9-fold change when compared to untreated cells. Nonlinear regression analysis revealed an EC50 of 3.49 μM. For the curve fitting with the four-parameter logistic regression model (dashed line, R2 = 0.78) only values from 0–8 μM (2–3 replicates per concentration) were used, because the strongly reduced activity at 9 and 10 μM would have confounded the analysis. (c) SW10WT, but not SW10ΔAdgrg6 cells showed a time-dependent increase in AKT phosphorylation upon treatment with 1 μM FT2Fc. Quantification of 5 independent experiments (left), representative western blot of cell lysates (right). Comparison of SW10WT to SW10ΔAdgrg6 cells with two-way ANOVA followed by Sidak’s multiple comparisons test: at 10 min, 15 min and 30 min p < 0.0001, at 5 min and 10 min p > 0.05. ns = not significant.
Fig 3
Fig 3. Establishment of readout and pharmacokinetics.
(a) AKT phosphorylation increased in sciatic nerves of ZH3 mice 30 min after injection of 600 μg FT. As control (ctrl), mice were injected with an inactive peptide, in which lysine residues have been replaced with alanine residues [8]. In mice injected with FT2Fc (10 mg/Kg), no significant change in AKT phosphorylation was detected after 30 min when compared to mIgG injected mice. Square brackets in western blots indicate left and right sciatic nerves taken from one mouse. The average value was used for quantification. (b) AKT phosphorylation did not increase after six consecutive FT2Fc injections. (c) Western blots of sciatic nerve cell lysates from WT and ZH3 mice. ZH3 mice exhibited a decrease in sciatic nerve Egr2 levels and a concomitant increase in GFAP and c-Jun levels. (d) ZH3 mice were i.v. (n = 2) or i.p. (n = 2) injected with FT2Fc (5 mg/Kg) and FT2Fc serum levels were monitored by western blotting with Fab83 at 1, 6 and 24 h after injection. A serum sample from a mouse injected with mIgG (5 mg/Kg) was used as negative control. The early serum level–time course was similar in i.v. and i.p. injected mice. (e) ZH3 mice were i.p. injected with 10 mg/Kg FT2Fc and blood samples were collected from 1 to 8 days post injection. The elimination of FT2Fc from serum followed first order elimination kinetics. (f) Serum level values (normalized to the level at 23 h post injection) were plotted on a semi-logarithmic graph and fitted with nonlinear least-squares analysis (dashed line, R2 = 0.92) to calculate the terminal serum half-life of FT2Fc. The serum half-life was estimated to be 45 h with a 95% confidence interval of 37–58 h. The number of mice investigated per time point (n) is indicated above the points.
Fig 4
Fig 4. Chronic administration of FT2Fc.
(a) Design of the prophylactic treatment experiment in ZH3 and WT mice. Starting at 1 month of age, ZH3 and WT mice were injected with FT2Fc (or control treatment) 3 times per week until the age of 5 months. Bars with grey shades show expected changes in protein levels with dark and light grey meaning high and low levels, respectively. (b) FT2Fc serum levels were measured 2 days after the last injection. Representative western blot showing serum levels for 4 ZH3 mice after 1 and 2 months of treatment. FT2Fc serum levels did not decrease after 2 months of treatment when compared to the level at 1 month (n = 8, paired t-test, p = 0.3529), suggesting that FT2Fc half-life was unaltered. (c) Bodyweight was not significantly different between treatment groups (as analysed by two-way repeated measures ANOVA, p > 0.05). Body weight was recorded at every injection time point for all the mice in the chronic treatment study and is here shown for week 1 to 6 of treatment as percentage of the body weight at treatment start (reference). (d) Representative western blots and quantification for levels of GFAP, c-Jun and Egr2 in sciatic nerves. GFAP levels were significantly higher in ZH3 mice compared to WT mice, but no significant change was induced by FT2Fc compared to buffer treatment (one-way ANOVA for selected comparisons, Bonferroni’s multiple comparisons test: ZH3 vs. WT for buffer treated mice p = 0.0345, for FT2Fc treated mice p = 0.0343. FT2Fc vs. buffer treated mice, both ZH3 and WT p > 0.05). C-Jun levels were not decreased in ZH3 compared to WT mice, and no significant change in c-Jun levels was induced by FT2Fc treatment (one-way ANOVA for selected comparisons, Bonferroni’s multiple comparisons test, p > 0.05). Egr2 levels were significantly lower in ZH3 mice compared to WT mice, but FT2Fc treatment did not induce a significant change in any genotype (one-way ANOVA for selected comparisons, Bonferroni’s multiple comparisons test: ZH3 vs. WT for buffer treated mice p < 0.0001, for FT2Fc treated mice p = 0.0044. FT2Fc vs. buffer treated mice, both ZH3 and WT p > 0.05). Protein levels were expressed as fold change the average level in buffer treated ZH3 mice. (e) Toluidine-blue stained semithin sections of sciatic nerves. No difference in fibre morphology was detected between treatment groups in our ZH3 mouse specimens. Scale bar 50 μM. (f) Number of myelinated axons per mm2 in sciatic nerves of ZH3 mice revealed no difference between treatment groups (comparison of FT2Fc and IgG treated to buffer treated mice by one-way ANOVA followed by Dunnett’s multiple comparisons test, p > 0.05). ns = not significant.
Fig 5
Fig 5. Electrophysiological studies.
All tests and calculations were done with the examiners masked as to treatment and strain allocation. (a) Motor nerve conduction velocities (NCV) for WT and ZH3 mice. There was no significant difference between WT and ZH3 mice, or between FT2Fc treated and buffer treated mice (one-way ANOVA for indicated comparisons, Bonferroni’s multiple comparisons test, p > 0.05). (b) Compound sensory NCV (csNCV) for WT and ZH3 mice. Again, there was no significant difference between WT and ZH3 mice, or FT2Fc treated and buffer treated mice (one-way ANOVA for indicated comparisons, Bonferroni’s multiple comparisons test, p > 0.05). (c) The ratio of proximal to distal compound muscle action potential (CMAP) amplitude was not significantly different when comparing ZH3 to WT mice or FT2Fc to buffer treated mice (one-way ANOVA for indicated comparisons, Bonferroni’s multiple comparisons test, p > 0.05). ns = not significant.
Fig 6
Fig 6. RNA sequencing of sciatic nerves from FT2Fc treated mice.
(a) Hierarchical clustering analysis based on the 100 genes with the highest variance across all samples showed a separation between FT2Fc treated mice and control mice (n = 4 per treatment). (b) Heatmap of the selected repair Schwann cell genes. The red-blue colour key is based on the row-wise Z-scores. 4 months old ZH3 mice (n = 3) showed a mild, 13–15 months old ZH3 mice (n = 4) a pronounced upregulation of these genes when compared to age-matched WT mice. No difference was detected in FT2Fc treated ZH3 mice (n = 4) compared to buffer treated mice (n = 4). (c) Volcano plot showing differentially expressed genes in sciatic nerves of FT2Fc treated compared to buffer treated mice. Genes with FDR < 0.05 were considered significantly up- or downregulated (43 downregulated genes, 1 upregulated gene). Genes involved in actin binding are labelled in the plot. Log2FC = log2 fold change.
Fig 7
Fig 7. Genes downregulated by FT2Fc show similar changes in PrP-overexpressing muscle.
(a) Log2 fold change (log2FC) for significantly downregulated genes (n = 43, based FDR < 0.05) in sciatic nerves of FT2Fc treated compared to buffer treated mice and corresponding log2FC in tibialis anterior muscle of PrP overexpressing mice. * marks genes which were also significantly downregulated in muscle based on FDR < 0.05 (n = 15). Grouping of genes according to common functions was based on a manual search in the UniProt database. (b) Scatterplot comparing gene expression changes in muscle of PrP overexpressing mice and sciatic nerves of FT2Fc treated mice. 1229 and 43 genes were significantly (FDR < 0.05) downregulated in muscle and nerve, respectively, with 15 of these genes overlapping. Grey line represents linear regression. Pearson’s correlation coefficient r = 0.09. (c) 10 μM Gomori trichrome stained frozen sections of gastrocnemius muscle from FT2Fc and buffer treated ZH3 mice. Muscle fibre morphology was similar in buffer and FT2Fc treated mice. No myopathic changes were detected in FT2Fc treated mice. Scale bar 20 μM.

Similar articles

Cited by

References

    1. Bremer J, Baumann F, Tiberi C, Wessig C, Fischer H, Schwarz P, et al. Axonal prion protein is required for peripheral myelin maintenance. Nat Neurosci. 2010;13(3):310–8. 10.1038/nn.2483 - DOI - PubMed
    1. Nishida N, Tremblay P, Sugimoto T, Shigematsu K, Shirabe S, Petromilli C, et al. A mouse prion protein transgene rescues mice deficient for the prion protein gene from purkinje cell degeneration and demyelination. Lab Invest. 1999;79(6):689–97. - PubMed
    1. Skedsmo FS, Malachin G, Vage DI, Hammervold MM, Salvesen O, Ersdal C, et al. Demyelinating polyneuropathy in goats lacking prion protein. FASEB J. 2020;34(2):2359–75. 10.1096/fj.201902588R - DOI - PubMed
    1. Koop O, Timmerman V, de Jonghe P, Ringelstein B, Young P, Kuhlenbaumer G. Absence of mutations in the prion-protein gene in a large cohort of HMSN patients. Neuromuscul Disord. 2005;15(8):549–51. 10.1016/j.nmd.2005.06.007 - DOI - PubMed
    1. Baiardi S, Redaelli V, Ripellino P, Rossi M, Franceschini A, Moggio M, et al. Prion-related peripheral neuropathy in sporadic Creutzfeldt-Jakob disease. J Neurol Neurosurg Psychiatry. 2019;90(4):424–7. 10.1136/jnnp-2018-319221 - DOI - PubMed

Publication types

MeSH terms