

Influenza A viruses limit NLRP3-NEK7-complex formation and pyroptosis in human macrophages
- PMID: 33180976
- PMCID: PMC7726813
- DOI: 10.15252/embr.202050421
Influenza A viruses limit NLRP3-NEK7-complex formation and pyroptosis in human macrophages
Abstract
Pyroptosis is a fulminant form of macrophage cell death, contributing to release of pro-inflammatory cytokines. In humans, it depends on caspase 1/4-activation of gasdermin D and is characterized by the release of cytoplasmic content. Pathogens apply strategies to avoid or antagonize this host response. We demonstrate here that a small accessory protein (PB1-F2) of contemporary H5N1 and H3N2 influenza A viruses (IAV) curtails fulminant cell death of infected human macrophages. Infection of macrophages with a PB1-F2-deficient mutant of a contemporary IAV resulted in higher levels of caspase-1 activation, cleavage of gasdermin D, and release of LDH and IL-1β. Mechanistically, PB1-F2 limits transition of NLRP3 from its auto-repressed and closed confirmation into its active state. Consequently, interaction of a recently identified licensing kinase NEK7 with NLRP3 is diminished, which is required to initiate inflammasome assembly.
Keywords: NEK7; NLRP3; PB1-F2; influenza A virus; pyroptosis.
© 2020 The Authors.
Conflict of interest statement
The authors declare that they have no conflict of interest.
Figures
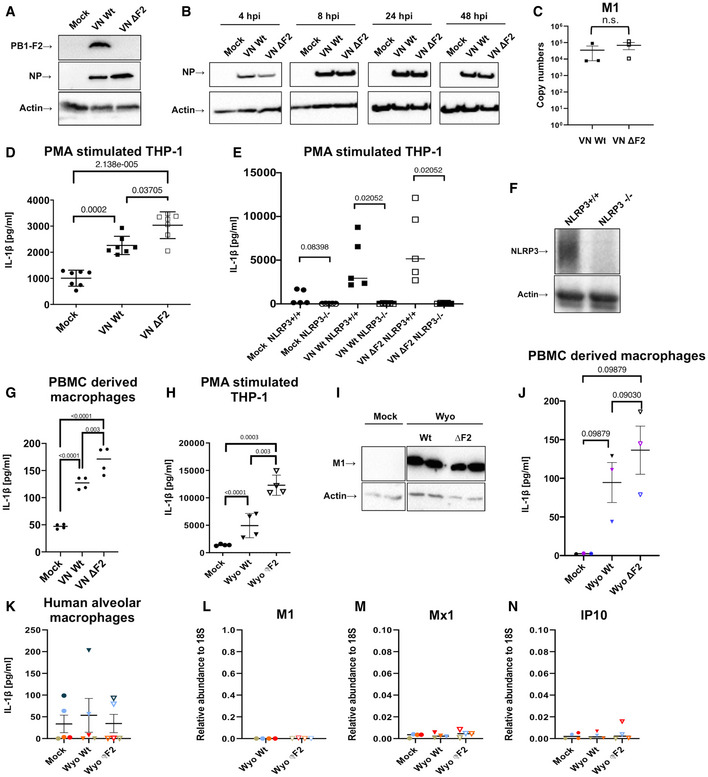
- A, B
THP‐1‐derived macrophages were infected with the wild‐type (Wt) and ΔF2 H5N1 (VN) virus at MOI 10. Viral protein expression for PB1‐F2 (A) or NP (B) was detected by immunoblotting at 24 h post‐infection (hpi) or indicated time points, respectively. Equal loading was confirmed by detection of beta actin.
- C
THP‐1‐derived macrophages were infected with the wild‐type (Wt) and ΔF2 H5N1 (VN) virus at MOI 10. Levels of viral M1 mRNA expression were detected by RT–qPCR at 16 hpi. The mean ± standard deviation of three independent biological samples is shown. Statistical analysis was performed by Student’s t‐test.
- D
THP‐1‐derived macrophages were infected with VN and PR8 Wt and ΔF2 strains for 24 h at MOI 10. Levels of IL‐1β were quantified by ELISA from the supernatants. The mean ± standard deviation of seven independent experiments is shown. Statistical analysis was performed by one‐way ANOVA, and P‐values are indicated.
- E
THP‐1 control and knockout cells for NLRP3 were mock treated or infected with the VN Wt and ΔF2 strains for 24 h at MOI 10 and IL‐1β levels were assessed by ELISA from the supernatants. The mean ± standard deviation of five independent experiments is shown. Statistical analysis was performed by one‐way ANOVA, and P‐values are indicated.
- F
Immunoblot detection for NLRP3 on control and NLRP3 knockout THP‐1 cells. Equal loading was confirmed by specific blotting against beta actin. Representative blot of three independent repeats is shown.
- G
Human primary macrophages differentiated from PBMCs from two healthy donors were infected with H5N1 Wt and ΔF2 for 5 h at MOI 10. Levels of IL‐1β were measured by ELISA in technical replicates. The mean of two independent experiments is shown. Statistical analysis was performed by one‐way ANOVA, and P‐values are indicated.
- H
THP‐1‐derived macrophages were infected with a human H3N2 IAV strain (Wyo) Wt and ΔF2 for 24 h at MOI 4. Levels of IL‐1β were measured by ELISA from the supernatants. The mean ± standard deviation of four independent experiments is shown. Statistical analysis was performed by one‐way ANOVA, and P‐values are indicated.
- I
Detection of viral matrix protein M1 by immunoblotting in cells infected with the H3N2 Wt and ΔF2 strains.
- J
Human primary macrophages isolated and differentiated from PBMCs from three healthy donors were infected with H3N2 Wt and ΔF2 for 24 h at MOI 4. Levels of IL‐1β were measured by ELISA. The mean ± standard deviation of three independent experiments is shown. Statistical analysis was performed by one‐way ANOVA, and P‐values are indicated.
- K–N
Primary human alveolar macrophages from BALF of five pediatric patients (patients are color coded) were infected with the human H3N2 strain (Wyo) Wt and ΔF2 for 16 h at MOI 1. (K) Levels of IL‐1β were measured by ELISA from the supernatants. The mean ± standard deviation is shown. Levels of viral M1 mRNA (L), Mx1 mRNA (M), and IP10 mRNA (N) expression were detected by RT–qPCR. The mean ± standard deviation for cells from four patients are shown. Individual patients are color coded.
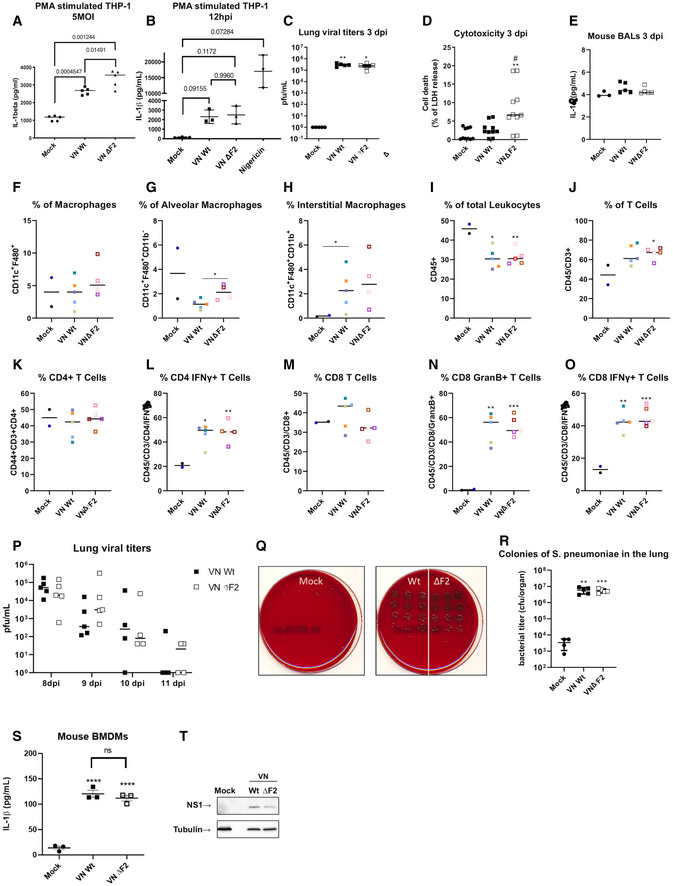
- A
THP‐1‐derived macrophages were infected with the wild‐type (Wt) and ΔF2 H5N1 (VN) virus at MOI 5 for 24 h. Levels of IL‐1β were measured by ELISA. The mean ± standard deviation of five independent experiments is shown. Statistical analysis was performed by one‐way ANOVA, and P‐values are indicated.
- B
THP‐1‐derived macrophages were infected with the wild‐type (Wt) and ΔF2 H5N1 (VN) virus at MOI 10 for 12 h. Levels of IL‐1β were measured by ELISA. The mean ± standard deviation of three independent experiments is shown. Statistical analysis was performed by one‐way ANOVA, and P‐values are indicated.
- C
Lung viral loads from 5 individual mice on day 3 post‐infection were assessed by plaque assay on MDCK cells. Median titers are indicated Statistical analysis was performed by Student’s t‐test as compared to mock samples (*P < 0.05, **P < 0.01).
- D
Groups of n = 5 mice were mock treated or infected with 40 pfu of the VN Wt or VN ΔF2 strains for 3 days. LDH assay was performed on BAL samples in technical duplicates (# P < 0.05 compared with wt **P < 0.01 compared with mock).
- E
ELISA for IL‐1β in BALF of mock (n = 3), VN Wt (n = 5) or VN ΔF2 (n = 5) infected mice.
- F–O
Groups of mice were mock treated (n = 2) or infected with 40 pfu of the VN Wt (n = 5) or VN ΔF2 (n = 4–5, of note for F–H the staining for macrophages for the red sample failed due to technical problems and is not indicated) for 7 days. Flow cytometry data for indicated cell populations. Statistical analysis was performed by one‐way ANOVA, and P‐values are indicated. (*P < 0.05, **P < 0.01, ***P < 0.001).
- P
Groups of n = 3–5 mice were infected with 40 pfu of the VN Wt or VN ΔF2 strains for 8–11 days. Lung viral loads were assessed by plaque assay on MDCK cells.
- Q
Streptococcus pneumoniae colonies in serial dilutions of lung homogenate are shown in trypcase soy agar +5% sheep blood plates. Representative results are shown in technical triplicates
- R
Streptococcus pneumoniae bacteria in the lungs (cfu/organ) 24 h post‐infection from mock treated, VN Wt or VN ΔF2 pre‐infected animals (mock n = 4, virus infected n = 5). Median values ± SD are indicated. Statistical analysis was performed by one‐way ANOVA P‐values toward mock samples are indicated. (**P < 0.01, ***P < 0.001).
- S
ELISA for IL‐1β secretion in BMDMs (n = 3) mock treated of infected with VNWt and ΔF2 strains. Statistical analysis was performed by one‐way ANOVA, and P‐values are indicated. Median values ± SD are indicated. P‐values toward mock samples are indicated. (****P < 0.0001).
- T
Immunoblot of cell lysates from (S). For all panels, the median of the indicated independent experiments is shown.
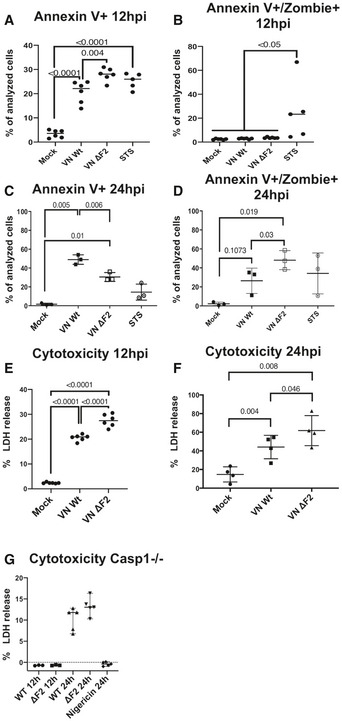
- A–D
THP‐1 cells were infected with the wild‐type (Wt) and ΔF2 H5N1 (VN) virus at MOI 10. Flow cytometry results for annexin V single positive (A and C) and annexin V and zombie dye double positive (B and D) cells. The percentage of positive cells are depicted at 12 hpi or 24 hpi.
- E, F
THP‐1 cells were infected with the wild‐type (Wt) and ΔF2 H5N1 (VN) virus at MOI 10. LDH release measured from supernatants of mock treated or infected cells at 12 hpi (E) or 24 hpi (F).
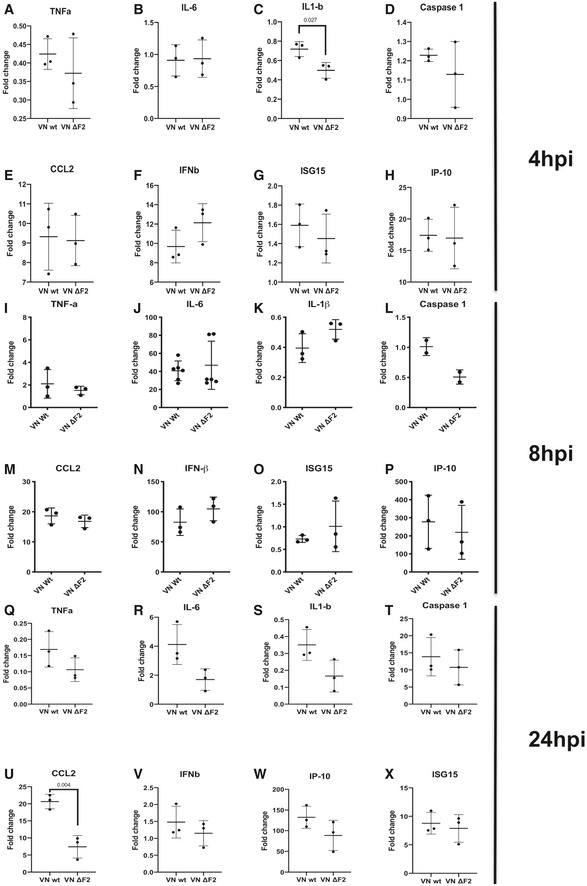
- A–X
THP‐1 cells were mock treated or infected with the VN Wt and ΔF2 strains for 4 h (A–H), 8 h (I–O), 18 h (P), and 24 h (Q–X) at MOI MOI 6 (I–O)‐10 (A–H and P–X). Relative expression levels normalized to the average of mock were determined by RT–qPCR for indicated mRNAs normalized to 18S rRNA and calibrated to mock. The mean ± standard deviation of 2–6 independent experiments with at least two technical replicates each is shown (each dot represents an independent biological sample). Statistical analysis was performed by paired two‐tailed Student’s t‐test, and P‐values are indicated.
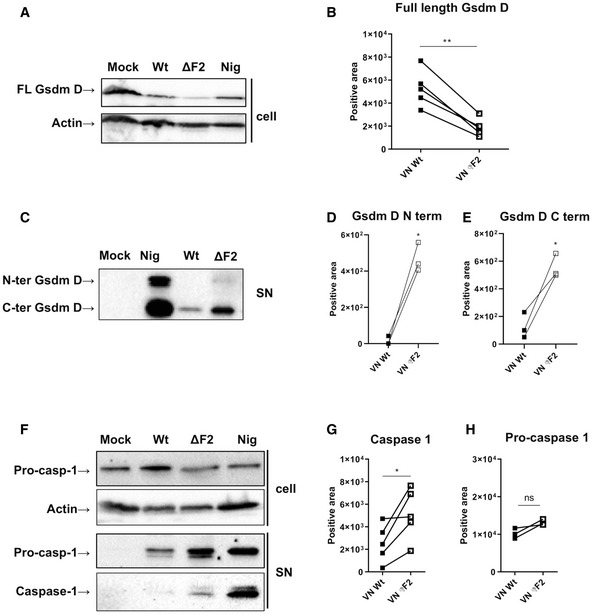
THP‐1 cells infected with VN Wt and ΔF2 virus at a MOI 10 for 24 h or treated with 6.7 μM of nigericin (nig) for 45 min were analyzed by immunoblotting. Detection of the full‐length gasdermin D. Equal loading was confirmed by beta actin. One representative blot of five independent repeats is shown.
Quantification of band intensity for the gasdermin D full‐length isoform. The mean ± standard deviation five independent experiments is shown. Statistical analysis was performed by the paired two‐tailed Student’s t‐test. The asterisk (*) marks a significant difference when compared to the mock group **P < 0.01.
THP‐1 cells infected with VN Wt and ΔF2 virus at a MOI 10 for 24 h or treated with 6.7 μM of nigericin (nig) for 45 min were analyzed by immunoblotting. Detection of cleaved gasdermin D N‐terminal and C‐terminal isoforms by immunoblot in supernatants; one representative experiment of three independent repeats is shown.
Quantification of band intensity for N‐terminal gasdermin D isoform band. Three independent experiments are shown. Statistical analysis was performed by the paired two‐tailed Student’s t‐test. *P < 0.05.
Quantification of band intensity for C‐terminal gasdermin D isoform band. Three independent experiments are shown. Statistical analysis was performed by the paired two‐tailed Student’s t‐test. *P < 0.05.
THP‐1 cells infected with VN Wt and ΔF2 virus at a MOI 10 for 24 h or treated with 6.7 μM of nigericin (nig) for 45 min were analyzed by immunoblotting. Pro‐caspase‐1 and active caspase‐1 were detected by immunoblot in cell lysates (cell, upper panels) and supernatants (sup, lower panels) from the same experiment. One representative experiment of three independent repeats is shown.
Quantification of band intensity for active caspase‐1 band. Five independent experiments are shown. Statistical analysis was performed by the paired two‐tailed Student’s t‐test. *P < 0.05.
Levels of total pro‐caspase‐1 were quantified on pellets and respective supernatants. Three independent experiments are shown. Statistical analysis was performed by the paired two‐tailed Student’s t‐test.
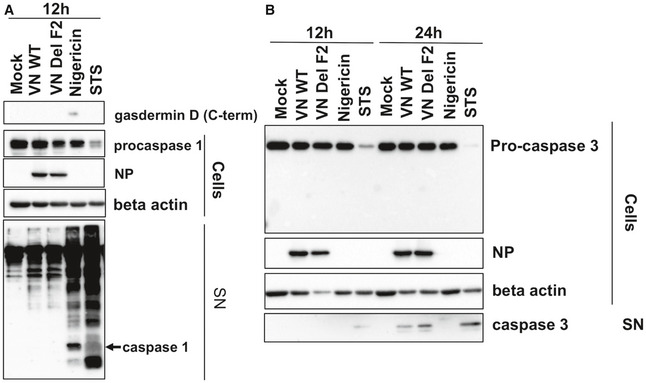
Supernatants of THP‐1 cells infected with VN Wt and ΔF2 virus at a MOI 10 for 12 h or treated with 6.7 μM of nigericin for 45 min or treated with 1 µM of staurosporine for 12 h or 24 h were analyzed by immunoblotting against gasdermin D, caspase 1, NP, and beta actin (n = 3).
Supernatants and cell lysates of THP‐1 cells infected with VN Wt and ΔF2 virus at a MOI 10 for 12 h or treated with 6.7 μM of nigericin for 45 min or treated with 1 µM of staurosporin for 12 h were analyzed by immunoblotting against caspase 1, NP, and beta actin (n = 3).
Western blot analysis of whole cell lysate (input) and Flag‐specific immunoprecipitation (IP) from 293T cells co‐transfected with expression plasmids encoding V5‐NLRP3 and Flag ZsGreen‐PB1‐F2 from indicated viral strains for 24 h. Representative blot of three independent repeats is shown.
Quantification of the NLRP3 IP band was normalized to the respective NLRP3 input band (n = 3 independent biological replicates, normalized to the respective input). Mean values ± SD are indicated.
Alignment of PB1‐F2 sequence from two avian IAV strains (VN (H5N1) and Sha (H7N9)) and two mammalian/human IAV strains (PR8 (H1N1) and Wyo (H3N2)) (Combet et al, 2000). * above the sequence shows a conserved amino acid between the four strains while ↑ on the bottom shows a different amino acid for PR8 in comparison with the other strains.
Schematic diagrams showing the truncated versions of Flag ZsGreen PB1 F2 used in (E) (not to scale).
293T cells co‐transfected with expression plasmids encoding different truncation mutants for Flag Zsgreen‐PB1‐F2 from VN (H5N1) and V5‐NLRP3 were processed as described in (A). Representative blot of three independent repeats is shown.
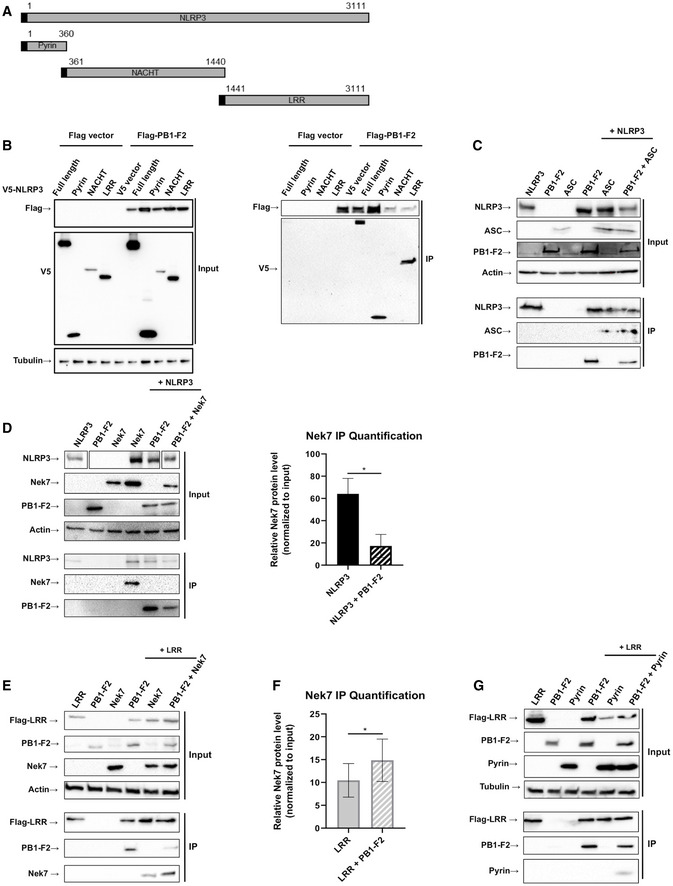
Schematic diagrams showing the NLRP3 constructs used in (B).
293T cells were co‐transfected with expression plasmids encoding for the indicated V5‐tagged domains of NLRP3 for 24 h. Whole cell lysate (left blot) and flag‐specific IP (right blot) were analyzed by immunoblotting. Equal loading was confirmed by blotting against tubulin. Representative blots of two independent experiments are shown.
293T cells were co‐transfected with expression plasmids encoding Flag‐NLRP3, V5‐PB1‐F2, and V5‐ASC for 24 h. Whole cell lysate and flag‐specific IP were analyzed by immunoblotting for indicated antigens. Equal loading of whole cell lysate was assured by blotting against beta actin. Representative blot of two independent repeats is shown.
293T cells were co‐transfected with expression plasmids encoding for Flag‐NLRP3, PB1‐F2 or NEK7 or combinations thereof as indicated. Whole cell lysate and Flag IP were analyzed by immunoblotting. Equal loading was confirmed by blotting against beta actin. Representative blots of three independent experiments are shown. Right panel: Quantification of IP bands’ intensity relative to their input. The mean ± standard deviation of three independent experiments is shown. Statistical analysis was performed by paired two‐tailed Student’s t‐test (*P < 0.05).
As in (D): 293T cells were co‐transfected with expression plasmids encoding for Flag‐NLRP3‐LRR, PB1‐F2 or NEK7 or combinations thereof as indicated. Whole cell lysate and NLRP3‐LRR IP were analyzed by immunoblotting. Equal loading was confirmed by blotting against beta actin. Representative blots of three independent experiments are shown.
Quantification of IP bands’ intensity relative to their input. The mean ± standard deviation of three independent experiments is shown. Statistical analysis was performed by paired two‐tailed Student’s t‐test (*P < 0.05).
As in (D and E): 293T cells were co‐transfected with expression plasmids encoding for Flag‐NLRP3‐LRR, PB1‐F2, or V5‐NLRP3‐Pyrin or combinations thereof as indicated. Whole cell lysate and NLRP3‐LRR IP were analyzed by immunoblotting. Equal loading was confirmed by blotting against tubulin. Representative blots of three independent experiments are shown.
References
-
- Aglietti RA, Dueber EC (2017) Recent insights into the molecular mechanisms underlying pyroptosis and gasdermin family functions. Trends Immunol 38: 261–271 - PubMed
-
- Anchisi S, Goncalves AR, Mazel‐Sanchez B, Cordey S, Schmolke M (2018) Influenza A virus genetic tools: from clinical sample to molecular clone. Methods Mol Biol 1836: 33–58 - PubMed
Publication types
MeSH terms
Substances
Grants and funding
- SNF 310030_155949/Schweizerischer Nationalfonds zur Förderung der Wissenschaftlichen Forschung (SNF)
- SNF 310030_155949/2/Schweizerischer Nationalfonds zur Förderung der Wissenschaftlichen Forschung (SNF)
- SNF 310030_182475/1/Schweizerischer Nationalfonds zur Förderung der Wissenschaftlichen Forschung (SNF)
- 310030-185255/Schweizerischer Nationalfonds zur Förderung der Wissenschaftlichen Forschung (SNF)
- EXC 2155-390874280/Deutsche Forschungsgemeinschaft (DFG)
LinkOut - more resources
Full Text Sources
Other Literature Sources
Medical
Miscellaneous
