. 2021 Jan 6;109(1):91-104.e5.
doi: 10.1016/j.neuron.2020.10.003. Epub 2020 Nov 11.

A Functional Topographic Map for Spinal Sensorimotor Reflexes

Affiliations

A Functional Topographic Map for Spinal Sensorimotor Reflexes

Graziana Gatto et al. Neuron. .

Abstract

Cutaneous somatosensory modalities play pivotal roles in generating a wide range of sensorimotor behaviors, including protective and corrective reflexes that dynamically adapt ongoing movement and posture. How interneurons (INs) in the dorsal horn encode these modalities and transform them into stimulus-appropriate motor behaviors is not known. Here, we use an intersectional genetic approach to functionally assess the contribution that eight classes of dorsal excitatory INs make to sensorimotor reflex responses. We demonstrate that the dorsal horn is organized into spatially restricted excitatory modules composed of molecularly heterogeneous cell types. Laminae I/II INs drive chemical itch-induced scratching, laminae II/III INs generate paw withdrawal movements, and laminae III/IV INs modulate dynamic corrective reflexes. These data reveal a key principle in spinal somatosensory processing, namely, sensorimotor reflexes are driven by the differential spatial recruitment of excitatory neurons.

Keywords: Corrective Reflexes; Innate Behavior; Itch; Protective Reflexes; Sensorimotor Integration; Somatosensation; Somatosensory coding; Spinal Circuits; Touch.


Conflict of interest statement

Declaration of Interests The authors declare no competing interests.

Figures

Figure 1.
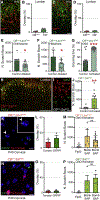
Figure 1.. Sensory-modality specific neuronal activation peaks in distinct laminar patterns
(A,C,E,G) 30 μm sections through the cervical (A,C) or lumbar (E,G) cord of P56 mice stained with antibodies to c-Fos (green) and PKCγ (red) after subcutaneous injection of chloroquine (A) and histamine (C) into the nape of the neck, and after pinprick (E) or light brush (G) stimulation of the ipsilateral hindpaw. Scale bar 100 μm. (B,D,F,H) Absolute number of c-Fos+ neurons (30 μm hemisection) present in each lamina after stimulation with chloroquine (B), histamine (D), pinprick (F) or light brush (H). Data are presented as mean ± SEM. N= 3 mice for pruritogens and brush, and N=4 mice for pinprick. (G) Non-linear fit distributions of the percentage of c-Fos+ neurons present across the different spinal laminae of mice stimulated with chloroquine (cyan), histamine (cobalt blue), pinprick (magenta) or brush (green). Shaded areas represent the SEM of each distribution. The four curve fits were compared. Significance of pruritogens vs pinprick and brush is shown with magenta and green asterisks, respectively. Brush and pinprick responses were not significantly different. (H) Schematic showing the distributions of c-Fos+ neurons across the distinct spinal laminae. Each dot represents 3 neurons. See also Figure S1 and Table S1.
Figure 2.
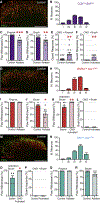
Figure 2.. Spatial distribution and molecular identity define distinct spinal circuits
(A,D) 40 μm transverse sections through the lumbar dorsal spinal cord of CRCre;Lbx1FlpO;R26ds-Tom (A) and CCKCre;Lbx1FlpO;R26ds-Tom (D) mice. Each section was stained with antibodies to Td-Tomato (red) and PKCγ (green). Scale bar 100 μm. (B,E) Schematic illustrating the average distribution across the lumbar dorsal spinal laminae of INs targeted using CRCre;Lbx1FlpO (B) and CCKCre;Lbx1FlpO (E) lineage tracings. (C,F) Absolute numbers of CRCre;Lbx1FlpO INs (C) and CCKCre;Lbx1FlpO INs (F) per 40 μm hemisection of the lumbar spinal cord. N=10 mice for CRCre;Lbx1FlpO and 3 for CCKCre;Lbx1FlpO. (I,J) 30 μm transverse sections through the lumbar dorsal spinal cord of CRCre (I) and CCKCre (J) mice injected unilaterally at L3-L5 with AAV1-Syp::Tomato. Each section was stained with antibodies to Td-Tomato. Scale bar 100 μm. (K,L) Percentages of ipsilateral/contralateral (K) and dorso/ventral (L) synaptic puncta compared to total projections of CRCre INs (K) and CCKCre INs (L) per 30 μm hemisection of the lumbar spinal cord. N=3 mice per genotype. Statistical analysis was done using two-way ANOVA, followed by Bonferroni’s post hoc test, with *p<0.05 and ***p<0.001. (G, H) 30-μm transverse sections through the lumbar dorsal spinal cord of CRCre (I) and CCKCre (J) mice injected unilaterally at L3–L5 with AAV1-Syp::Tomato. Each section was stained with antibodies to Td-Tomato. Scale bar: 100 μm Both instances of Cre are superscript. CRCre CCKCre Data are presented as mean ± SEM. See also Figure S2 and Table S1.
Figure 3.
Figure 3.. Scratch and withdrawal reflexes are driven by distinct spatially confined excitatory networks.
(A) CNO-induced neuronal activation in CRCre;Lbx1FlpO INs, but not in CCKCre;Lbx1FlpO INs, elicits a spontaneous scratch response. Darker bar colors indicate the control mice lacking the Lbx1FlpO allele. (B,C) Decreased paw sensitivity to noxious (B) and non-noxious (C) mechanical stimuli in mice upon ablation (Abl) of CCKCre;Lbx1FlpO INs but not CRCre;Lbx1FlpO INs. Controls (Ctrl) are either CRCre; Lbx1FlpO mice treated with saline or CCKCre and FlpO-negative mice treated with DTX. (D,F) Increased frequency of paw held in guard position upon noxious (D) and non-noxious (F) mechanical stimulation of the footpad after CNO-induced activation of CCKCre;Lbx1FlpO INs but not CRCre;Lbx1FlpO INs. Controls are FlpO-negative mice treated with CNO. (E) Increased percentage of withdrawal response to non-noxious mechanical stimulus observed upon CNO-driven neuron activation in CCKCre;Lbx1FlpO but not in CRCre;Lbx1FlpO mice. Controls are FlpO-negative mice treated with CNO. Data are presented as mean ± SEM. Statistical analysis was done using one-way ANOVA followed by Dunnett’s post hoc test with all genotypes compared to CRCre;Lbx1FlpO− (A) or CRCre;Lbx1FlpO+ saline-treated (C,D,F) or CCKCre;Lbx1FlpO− (E) mice, with *p<0.05, ***p<0.001. Each mouse analyzed is represented with a grey filled circle. See also Figure S3, Videos S1–S5 and Table S1.
Figure 4.
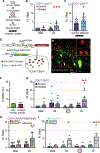
Figure 4.. Population coding theory accounts for the chemical itch-induced scratch reflex
(A,C) 20 μm transverse sections through the P10 CBCre;R26Ai14-Tom (A) and CRCre;Lbx1FlpO;R26ds-Tom (C) lumbar dorsal spinal cords stained with antibodies to RFP (red) and CR (A) or CB (C) (green). Scale bar 40 μm. (B,D) Graphs showing the percentage of neurons co-expressing Cre and CR (B) or CB (D) compared to the total number of Cre+ INs or the total CR+ (B) or CB+ INs (D). (E,F) CBCre;Lbx1FlpO IN-ablated mice show a significant decrease in the scratch response to subcutaneous chloroquine (E) and histamine (F) injection compared to littermate controls. Controls are Cre+ and FlpO+ mice treated with saline instead of DTX. (G) CNO-induced neuronal activation in CBCre;Lbx1FlpO mice elicits a strong grooming behavior. Controls are FlpO-negative mice treated with CNO. (H) 40 μm transverse sections through P56 CBCre;SstFlpO;R26ds-Tom lumbar dorsal spinal cord stained with antibodies to Td-Tomato (red) and PKCγ (green). Scale bar 100 μm. (I) 20 μm transverse sections through the P10 CBCre;SstFlpO;Tauds-DTR;R26ds-Tom lumbar dorsal spinal cords stained with antibodies to Td-Tomato (red) and LacZ (green). Scale bar 40 μm. (J) Increased scratch response observed after CNO-activation in CBCre;SstFlpO mice compared to FlpO-negative littermate controls. (K,N) 14 μm transverse sections through the P40 CRCre;Lbx1FlpO;R26ds-Tom (K) and CBCre;SstFlpO;R26ds-Tom (N) cervical dorsal spinal cords stained with RNAscope probes to Td-Tomato (red) and GRPR (green) mRNA. Scale bar 10 μm. (L,O) Graphs showing the percentage of neurons co-expressing CRCre;Lbx1FlpO;R26ds-Tom (L) or CBCre;SstFlpO;R26ds-Tom (O) and GRPR compared to the total number of intersectionally labeled INs (red bar) or the total number of GRPR+ INs (green bar). (M,P) No changes in the spontaneous scratch behavior elicited upon CNO-driven activation of CRCre;Lbx1FlpO INs (M) and CBCre;SstFlpO INs (P) following ablation of GRPR+ INs (Bomb-Sap) compared to controls (Blank-Sap). Note the increase in scratching in both conditions compared to FlpO-negative littermate controls. Statistical analysis was done using one-way ANOVA, followed by Dunnett’s post hoc test with all genotypes compared to Blank-Sap treatment. Data are presented as mean ± SEM. Statistical analysis was done using two-tailed Student’s t-test with *p<0.05, **p<0.01 and ***p<0.001, unless otherwise stated. Each mouse analyzed is represented with a grey filled circle. See also Figure S4 and Table S1.
Figure 5.
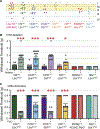
Figure 5.. Distinct subsets of excitatory INs in laminae II/III cooperate to elicit the withdrawal reflex
(A,G,M) 40 μm transverse sections through P56 CCKCre;SstFlpO;R26ds-Tom (A), RORαCre;Lbx1FlpO;R26ds-Tom (G) and NtsCre;Lbx1FlpO;R26ds-Tom (M) lumbar dorsal spinal cord stained with antibodies to Td-Tomato (red) and PKCγ (green). Scale bar 100 μm. (B,H,N) Absolute numbers of CCKCre;SstFlpO INs (B), RORαCre;Lbx1FlpO INs (H) and NtsCre;Lbx1FlpO INs (N) per 40 μm hemisection of the lumbar spinal cord. N=6 mice for CCKCre;SstFlpO, N=4 for RORαCre;Lbx1FlpO and N=3 for NtsCre;Lbx1FlpO. (C,I,Q) Decreased paw sensitivity to noxious pinprick upon ablation of CCKCre;SstFlpO INs but no changes following the loss of RORαCre;Lbx1FlpO (I) and NtsCre;Lbx1FlpO INs (Q). Controls are Cre+ and FlpO+ mice treated with saline instead of DTX. (D,J,R) Decreased paw sensitivity to non-noxious brush upon ablation of CCKCre;SstFlp (C), RORαCre;Lbx1FlpO INs but no significant changes upon the loss of NtsCre;Lbx1FlpO INs (R). Controls are Cre+ and FlpO+ mice treated with saline instead of DTX. (E,F) Increased frequency of paw held in guard position upon noxious (E) and non-noxious (F) mechanical stimulation of the footpad after CNO-activation of CCKCre;SstFlpO INs, as opposed to similarly treated FlpO-negative controls. (K,O) Increased percentage of withdrawal response to non-noxious mechanical stimulus observed upon CNO-driven neuron activation in RORαCre;hCdx2::FlpO (K) and NtsCre;Lbx1FlpO (O) mice compared to FlpO-negative controls. (L,P) Absence of paw held in guard position upon non-noxious mechanical stimulation of the footpad after CNO-induced activation of RORαCre;Lbx1FlpO INs (L) and NtsCre;Lbx1FlpO INs (P), and in similarly treated FlpO-negative controls. Data are presented as mean ± SEM. Each mouse analyzed is represented with a grey filled circle. Statistical analysis was done using two-tailed Student’s t-test with *p<0.1, **p<0.01 and ***p<0.001. See also Figure S5.
Figure 6.
Figure 6.. Excitatory INs that span lamina II determine the threshold of mechanical sensitivity
(A) Schematic representation of the distributions of the intersectionally labeled spinal IN populations across the dorsal horn. Each dot represents 20 neurons per 40 μm hemisection. (B) Increased threshold of paw sensitivity to mechanical stimuli in mice with DTX-induced ablation of CBCre;Lbx1FlpO INs, CCKCre;Lbx1FlpO INs, CCKCre;SstFlpO INs and CRCre;Lbx1FlpO INs. Controls are either saline-treated Cre+ and FlpO+ mice or CCKCre FlpO-negative mice treated with DTX. (C) Increased sensitivity to von Frey stimulation after CNO-driven neuronal activation in CBCre;Lbx1FlpO, CCKCre;Lbx1FlpO, CCKCre;SstFlpO and CRCre; Lbx1FlpO mice compared to FlpO-negative littermate controls, and to RORαCre;hCdx2::FlpO and NtsCre;Lbx1FlpO mice. Data are presented as mean ± SEM. Each mouse analyzed is represented with a grey filled circle. Statistical analysis was done using one-way ANOVA followed by Dunnett’s post hoc test comparing all genotypes to CCKCre;Lbx1FlpO− mice, with **p<0.01, ***p<0.001. See also Figure S6 and Table S1.
Figure 7.
Figure 7.. Excitatory neurons in laminae III/IV encode corrective tactile responses
(A) Schematic showing the beam legend for this Figure. (B,C) Increased number of foot slips following ablation of CCKCre;Lbx1FlpO INs in mice crossing narrow beams (B) or uneven ladder (C). Controls are FlpO-negative mice treated with DTX. (D) Schematic showing the intersectional genetic and viral strategy used to target the superficial (CCKCre;SstFlpO) and deep (AAV8-flex-GFP) subsets of CCKCre INs. (E) 30 μm transverse sections through P56 CCKCre;SstFlpO;R26ds-Tom lumbar dorsal horn transduced with AAV8-flex-GFP and stained with antibodies to Td-Tomato (red) and GFP (green). Scale bar 40 μm. (F) Graph showing the limited overlap of lineage-traced CCKCre;SstFlpO;R26ds-Tom INs and AAV-labeled CCKCre INs compared to the total number of genetically (red bar) or virally (green bar) targeted INs. (G) Increased number of foot slips on narrow circular beam following ablation of CCKCre;SstFlpO INs. Control (Cre+;FlpO+) mice were treated with saline. (H) Increased number of foot slips on narrow beam following PSEM89S-induced silencing of CCKCre mice transduced with AAV8-GlyR compared to saline treatment. (I) Increased number of foot slips during beam crossings following ablation of NtsCre;Lbx1FlpO INs. Control (Cre+;FlpO+) mice were treated with saline. Data are presented as mean ± SEM. Each mouse analyzed is represented with a grey filled circle. Statistical analysis was done using two-way ANOVA followed by Bonferroni’s post hoc test, with *p<0.05, **p<0.01 and ***p<0.001. See also Figure S7 and Table S1.

Comment in

References

    1. Abraira VE, and Ginty DD (2013). The Sensory Neurons of Touch. Neuron 79, 618–639. - PMC - PubMed
    1. Abraira VE, Kuehn ED, Chirila AM, Springel MW, Toliver AA, Zimmerman AL, Orefice LL, Boyle KA, Bai L, Song BJ, et al. (2017). The Cellular and Synaptic Architecture of the Mechanosensory Dorsal Horn. Cell 168, 295–310.e19. - PMC - PubMed
    1. Akiyama T, Merrill AW, Zanotto K, Carstens MI, and Carstens E (2009). Scratching behavior and Fos expression in superficial dorsal horn elicited by protease-activated receptor agonists and other itch mediators in mice. J. Pharmacol. Exp. Ther. 329, 945–951. - PMC - PubMed
    1. Albisetti GW, Pagani M, Platonova E, Hösli L, Johannssen HC, Fritschy J-M, Wildner H, and Zeilhofer HU (2019). Dorsal Horn Gastrin-Releasing Peptide Expressing Neurons Transmit Spinal Itch But Not Pain Signals. J. Neurosci. 39, 2238–2250. - PMC - PubMed
    1. Arcourt A, Gorham L, Dhandapani R, Prato V, Taberner FJ, Wende H, Gangadharan V, Birchmeier C, Heppenstall PA, and Lechner SG (2017). Touch Receptor-Derived Sensory Information Alleviates Acute Pain Signaling and Fine-Tunes Nociceptive Reflex Coordination. Neuron 93, 179–193. - PubMed

Publication types

LinkOut - more resources