. 2021 Feb:115:154431.
doi: 10.1016/j.metabol.2020.154431. Epub 2020 Nov 10.

A requirement for PAK1 to support mitochondrial function and maintain cellular redox balance via electron transport chain proteins to prevent β-cell apoptosis

Affiliations

A requirement for PAK1 to support mitochondrial function and maintain cellular redox balance via electron transport chain proteins to prevent β-cell apoptosis

Miwon Ahn et al. Metabolism. 2021 Feb.

Abstract

Objective: p21 (Cdc42/Rac1) activated Kinase 1 (PAK1) is a candidate susceptibility factor for type 2 diabetes (T2D). PAK1 is depleted in the islets from T2D donors, compared to control individuals. In addition, whole-body PAK1 knock out (PAK1-KO) in mice worsens the T2D-like effects of high-fat diet. The current study tested the effects of modulating PAK1 levels only in β-cells.

Materials/methods: β-cell-specific inducible PAK1 KO (βPAK1-iKO) mice were generated and used with human β-cells and T2D islets to evaluate β-cell function.

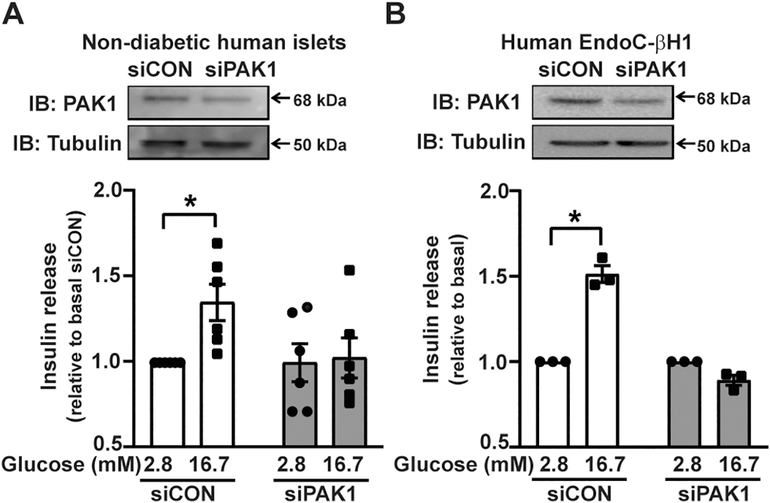
Results: βPAK1-iKO mice exhibited glucose intolerance and elevated β-cell apoptosis, but without peripheral insulin resistance. β-cells from βPAK-iKO mice also contained fewer mitochondria per cell. At the cellular level, human PAK1-deficient β-cells showed blunted glucose-stimulated insulin secretion and reduced mitochondrial function. Mitochondria from human PAK1-deficient β-cells were deficient in the electron transport chain (ETC) subunits CI, CIII, and CIV; NDUFA12, a CI complex protein, was identified as a novel PAK1 binding partner, and was significantly reduced with PAK1 knockdown. PAK1 knockdown disrupted the NAD+/NADH and NADP+/NADPH ratios, and elevated ROS. An imbalance of the redox state due to mitochondrial dysfunction leads to ER stress in β-cells. PAK1 replenishment in the β-cells of T2D human islets ameliorated levels of ER stress markers.

Conclusions: These findings support a protective function for PAK1 in β-cells. The results support a new model whereby the PAK1 in the β-cell plays a required role upstream of mitochondrial function, via maintaining ETC protein levels and averting stress-induced β-cell apoptosis to retain healthy functional β-cell mass.

Keywords: Diabetes; Electron transport chain; Mitochondrial number; Redox imbalance; β-Cell mass.


Conflict of interest statement

Declaration of competing interest The authors declare no conflicts of interest.

Figures

Fig. 1.
Fig. 1.
PAK1 depletion in human β-cells ablates glucose stimulated insulin secretion (GSIS). (A) Dispersed human islets were transfected with siRNA (siPAK1 or siCON) and insulin release was measured in response to 2.8 mM or 16.7 mM glucose exposure. Insulin released into the buffer was normalized to total protein content in the corresponding cell lysates to obtain ng/insulin released/mg total protein for each data point per set of independent human islet donor batches (n = 6 donor batches). (B) Human EndoC-βH1 cells (n = 3 experiments using independent passages of cells), relative to cells expressing control siRNA (siCON). Each experiment is normalized to protein concentration, to obtain ng insulin/mg total protein. For comparisons between groups, data are shown as the stimulation index, glucose-stimulated insulin secretion/basal insulin release, for each independent experiment/cell passage. Data are shown as the mean ± SEM; *p < 0.05 using Student’s t-test.
Fig. 2.
Fig. 2.
PAK1 depletion consistently disrupts mitochondrial function in multiple species of β-cells. Mitochondrial function was measured in human EndoC-βH1 (A–B), INS1–832/13 (C–D) and MIN6 (E–F) β-cells transfected with siPAK1 or siCON. Individual OCR parameters (Basal respiration, Proton Leak, Spare respiratory capacity and ATP Production) were calculated and expressed relative to the siCON. Data are shown as mean ± SEM (human EndoC-βH1, n = 5; INS1–832/13, n = 5; MIN6, n = 3; with all replicates representing independent passages of cells). Statistical significance was evaluated using ANOVA (A, C and E), or paired two-tailed Student’s t-test (B, D and F); *p < 0.05, **p < 0.01, ***p < 0.005 and ****p < 0.0001, versus siCON.
Fig. 3.
Fig. 3.
In human β-cells, PAK1 depletion disrupts mitochondria membrane potential, electron transport chain protein expression and redox balance, and elevates ROS. (A) siRNA-transfected human EndoC-βH1 cells were incubated with MitoTracker and fixed. The mitochondria (shown pseudocolored white) were visualized using Keyence fluorescence microscopy. (B) Quantitation of MitoTracker staining intensity in human EndoC-βH1 cells transfected with either siCON or siPAK1 (PAK1-kd). At least three randomly selected microscopic fields were used to calculate staining in each of the three independent cell passages. Values are given as mean ± SEM, *p < 0.05 by Student’s t-test. (C) Protein expression of ETC CI (NUDFB8), CII (SDHB), CIII (UQCRC2), CIV (MTCO1) and CV (ATP5A) were determined by immunoblot in human EndoC-βH1 cells transfected with either siCON or siPAK1. (D) The bar graph quantitation of ETC immunoblots represents the mean ± SEM, for PAK1-kd and siCON human EndoC-βH1 cells. Each ETC factor in siPAK1-kd lysates was normalized to the paired siCON band set equal to one in each of the five independent sets of cell passages. (E) CellRox intensity (shown, pseudocolored white) was visualized by Keyence fluorescence microscopy in three randomly selected fields in each of the independent passages of INS1–832/13 cells transfected with siPAK1 or siCON. H2O2 treatment serves as positive control in each passage for CellRox detection of ROS. (F) Quantitation of CellRox staining intensity in at least three randomly selected microscopic fields were used to calculate staining. Values are given as mean ± SEM, *p < 0.05 by Student’s t-test. (G) The total NAD+/NADH levels, as well as the total NADPH and NADP+ levels (H–I), and the NADP+/NADPH ratio (J), are shown for siPAK1 and siCON cells. The NADP+/NADPH ratio was calculated (NADPtotal-NADPH)/NADPH. *p < 0.05, **p < 0.01, ***p < 0.005 and ****p < 0.0001 vs siCON by Student’s t-test.
Fig. 4.
Fig. 4.
βPAK1-iKO mice show defective islet response to glucose in vivo. (A) Efficient PAK1 deletion in β-cells was determined by western blot, with nooff-target effects in hypothalamus or cerebellum. (B) βPAK1-iKO mice showed an impaired insulin response following an acute 10 min glucose challenge compared to control mice (CON = fl/fl;cre/+, vehicle-gavaged). (C) βPAK1-iKO mice show an impaired stimulation index (glucose-stimulated/fasted insulin) compared to control (CON) mice. (D) Intraperitoneal glucose tolerance test (IPGTT) results and area under the IPGTT curve (AUC) for (D, E) male and (G, H) female βPAK1-iKO or control mice. Intraperitoneal insulin tolerance test (IPITT) results for male (F) and female (I) βPAK1-iKO or control mice. Data are shown as mean ± SEM for 4–7 mice. Statistics were calculated using two-way ANOVA (B,D,F,G and I), or Student’s t-test (C, E and H) *p < 0.05, **p < 0.01, ***p < 0.005 and ****p < 0.0001.
Fig. 5.
Fig. 5.
PAK1-deficient β-cells show increased apoptosis and reduced mitochondrial number. (A) TUNEL immunofluorescence staining (left) and quantification of TUNEL-positive cells as a percentage of total β-cells (right) from pancreata of fed control (CON) or βPAK1-iKO mice. Yellow arrows denote TUNEL-positive: insulin-positive β-cells. Scale bar = 50 μm. (B) TEM of isolated islets from βPAK1-iKO and control mice. Mitochondria numbers were counted in a blinded manner, from 10 to 18 sections/cohort (2 pancreata per group per cohort). TEM scale bar = 2 μm. *p < 0.05, ****p < 0.0001 by Student’s t-test.
Fig. 6.
Fig. 6.
PAK1 enrichment in T2D human islets reduces endoplasmic reticulum (ER) stress markers and enhances insulin secretion. (A) ER stress was assessed using immunoblotting analysis of phospho- and total eIF2α, along with CHOP, normalized to tubulin in AdRIP-human (h)PAK1 or -CON transduced T2D human islets. (B) The bar graphs represent immunoblot quantification of four independent batches of human T2D donor islets. **p < 0.01 vs AdRIP-CON by Student’s t-test. AdRIP-hPAK1 overexpression in three independent batches of T2D human islets results in increased insulin release in perifusion analyses. Insulin was measured by radioimmunoassay in cases I (C), II (D) and III (E).
Fig. 7.
Fig. 7.
PAK1 interacts with NDUFA12 and regulates its protein abundance in β-cells. (A) INS1–832/13 cells were transduced with AdRIP-hPAK1 or AdRIP control vector (CON) and left unstimulated (2.8 mM glucose) or stimulated with 20 mM glucose for 30 min; cells transfected with siPAK1 were used as control for specificity. AdRIP-hPAK1 and siPAK1 lysates were divided into two coimmunoprecipitation reactions containing anti-PAK1 or anti-NDUFA12. IgG control immunoprecipitation reaction used pooled un/stimulated AdRIP-hPAK1 lysates. Results are representative of three independent sets of cell lysates used in immunoprecipitation experiments. Vertical dashed lines indicate splicing of lanes from within the same gel exposure. (B) Bar graph quantitation of NDUFA12 protein levels detected in siPAK1 or siCon lysates, *p < 0.05. (C) Bar graph quantitation of NDUFA12 protein levels in the hPAK1 overexpressing input lysates used in (A); no significant differences were detected using ANOVA. (D) NDUFA12 mRNA levels detected by qRT-PCR. Cells transfected with siPAK1 (with siCon as control), or transduced with AdRIP-hPAK1 (with AdRIP-vector as control) for 48 h were harvested from complete medium, washed with PBS, and RNA extracted. N.S., not significant.

References

    1. CDC. Centers for disease control and prevention: national diabetes statistics report, 2017. Atlanta, GA: Centers for Disease Control and Prevention, US Department of Health and Human Services; 2017.
    1. Tripathy D, Eriksson KF, Orho-Melander M, Fredriksson J, Ahlqvist G, Groop L. Parallel manifestation of insulin resistance and beta cell decompensation is compatible with a common defect in type 2 diabetes. Diabetologia. 2004;47:782–93. - PubMed
    1. Cohrs CM, Panzer JK, Drotar DM, Enos SJ, Kipke N, Chen C, et al. Dysfunction of persisting β cells is a key feature of early type 2 diabetes pathogenesis. Cell Rep. 2020;31:107469. - PubMed
    1. Butler AE, Janson J, Bonner-Weir S, Ritzel R, Rizza RA, Butler PC. Beta-cell deficit and increased beta-cell apoptosis in humans with type 2 diabetes. Diabetes. 2003;52: 102–10. - PubMed
    1. Salunkhe VA, Veluthakal R, Kahn SE, Thurmond DC. Novel approaches to restore beta cell function in prediabetes and type 2 diabetes. Diabetologia. 2018;61: 1895–901. - PMC - PubMed

Publication types

MeSH terms

Substances