. 2021 Feb;99(2):699-728.
doi: 10.1002/jnr.24754. Epub 2020 Nov 12.

HCN channels in the mammalian cochlea: Expression pattern, subcellular location, and age-dependent changes

Affiliations

HCN channels in the mammalian cochlea: Expression pattern, subcellular location, and age-dependent changes

Maria Luque et al. J Neurosci Res. 2021 Feb.

Abstract

Neuronal diversity in the cochlea is largely determined by ion channels. Among voltage-gated channels, hyperpolarization-activated cyclic nucleotide-gated (HCN) channels open with hyperpolarization and depolarize the cell until the resting membrane potential. The functions for hearing are not well elucidated and knowledge about localization is controversial. We created a detailed map of subcellular location and co-expression of all four HCN subunits across different mammalian species including CBA/J, C57Bl/6N, Ly5.1 mice, guinea pigs, cats, and human subjects. We correlated age-related hearing deterioration in CBA/J and C57Bl/6N with expression levels of HCN1, -2, and -4 in individual auditory neurons from the same cohort. Spatiotemporal expression during murine postnatal development exposed HCN2 and HCN4 involvement in a critical phase of hair cell innervation. The huge diversity of subunit composition, but lack of relevant heteromeric pairing along the perisomatic membrane and axon initial segments, highlighted an active role for auditory neurons. Neuron clusters were found to be the hot spots of HCN1, -2, and -4 immunostaining. HCN channels were also located in afferent and efferent fibers of the sensory epithelium. Age-related changes on HCN subtype expression were not uniform among mice and could not be directly correlated with audiometric data. The oldest mice groups revealed HCN channel up- or downregulation, depending on the mouse strain. The unexpected involvement of HCN channels in outer hair cell function where HCN3 overlaps prestin location emphasized the importance for auditory function. A better understanding may open up new possibilities to tune neuronal responses evoked through electrical stimulation by cochlear implants.

Keywords: HCN channels; RRID:AB_2039906; RRID:AB_2302038; RRID:AB_2313584; RRID:AB_2313726; RRID:AB_2336419; RRID:AB_2336420; RRID:AB_2336790; RRID:AB_2340452; RRID:AB_2340477; RRID:AB_2340593; RRID:AB_2341028; RRID:AB_2617143; RRID:AB_2756625; RRID:AB_2756742; RRID:AB_90725; RRID:SCR_002865; RRID:SCR_013652; RRID:SCR_014823; auditory development; auditory neuron diversity; axon initial segment; prestin; sound coding; spiral ganglion neurons; voltage gated.


Conflict of interest statement

There is no conflict of interest to declare.

Figures

FIGURE 1
FIGURE 1
HCN1 expression in the adult mammalian cochlea. HCN1 channel subunits were highly expressed in neurons with intense cytoplasmatic and perisomatic membrane staining. a, CBA/J spiral ganglion neurons (SGNs) somatic staining with DAB. There was no visible gradient across SGNs of the middle (SGm) and basal (SGb) turns. The central cochlear nerve (CN) and axons in the osseous spiral lamina (OSL) were weakly stained. Confocal imaging in C57Bl/6N showed highest intensity of HCN1 at neuronal clusters (arrows) in the apical turn (b); neuron soma membrane staining in the basal turn (c). d, No specific staining was found in the sensory epithelia; inner hair cell (IHC). e, Intense staining at the axon hillock and central axon initial segment (cAIS, arrows). No staining was detected at the peripheral AIS. f, Double staining of HCN1 (f1) with contactin‐associated protein 1 (CASPR, f2, arrow) identified HCN1 staining to overlap with the cAIS. g, Neurons in Ly5.1 presented staining with higher intensity. Cat (h) and human (i) shared equal HCN1 distribution at the neuron soma and cAIS (arrows). j, Double staining with peripherin (PRPH), a specific type II SGN marker does not co‐express with HCN1 in C57Bl/6N (asterisk), but in cat (k) and human (l). A type II SGNs cluster in human presented different intensities of HCN1 (l1). f1, j1, k1, l1, DAB channel (HCN1), f2, j2, k2, l2 AEC channel (CASPR1 and PRPH) after color deconvolution. B6, C57Bl/6N; CBA, CBA/J; P, postnatal day
FIGURE 2
FIGURE 2
HCN2 expression in the adult mammalian SGNs. HCN2 presented staining at the neuronal soma membrane and axons. a, Midmodiolar view exposed immunostaining in the organ of Corti (OC) and a rather homogeneous staining along the tonotopical axis in CBA/J across the spiral ganglion in the apical (SGa), middle (SGm), and basal (SGb) turn. b, Super‐resolution confocal imaging with calretinin as neuronal counterstaining and DAPI nuclear stain. b1, direct‐conjugated HCN2 antibody signal, b2, calretinin immunoreactivity. HCN2 was present only in perisomatic SGN membranes, axons (arrows) are void of any HCN2‐LI. c, High intensity of the staining was visible in a Ly5.1 mouse in the apical turn within a neuron cluster (arrow), along the osseous spiral lamina (OSL) and in the organ of Corti (OC). d–i, Comparison of neuronal staining in three inbreed mouse strains identified similar expression levels of HCN2 in CBA/J (d, g) and C57Bl/6N (e, h) but higher intensity of staining in Ly5.1 mice (f, i). HCN2 in type I neurons of a guinea pig (j), type I and peripherin (PRPH)‐positive type II neurons in cat (k) and human (l–p); k1 DAB channel (HCN2), k2, AEC channel (PRPH), after color deconvolution. l, Peripheral nerve fibers (PNF) appear weakly positive in human. m, Small human type II neurons were heavily stained for HCN2 (arrows). n, High magnification of human type I SGNs showed intense staining at the soma membrane, and weaker in the cytoplasm; postsomatic segment (asterisks) and the satellite glia cell (SGC) were void of reactivity. Double staining with PRPH was positive for HCN2 in human type II neurons (arrows) (o, p), but negative in CBA/J mice (q) and C57Bl/6N (r). B6, C57Bl/6N; CBA, CBA/J; P, postnatal day
FIGURE 3
FIGURE 3
HCN2 expression in the adult mammalian sensory epithelia. HCN2 was present at afferent and efferent nerve fibers innervating the organ of Corti. a, Differential interference contrast image (DIC) of DAB visualized immunostaining showed presence in C57Bl/6N neurons, osseous spiral lamina (OSL), and underneath the inner hair cell (IHC). The inset with a magnified view of the organ of Corti exposed staining at the inner spiral plexus (isp) underneath the IHC, boutons and nerve fibers between outer hair cells (OHCs) and supporting cells (arrows) and the efferent fibers of the tunnel spiral bundle (tsb). b, Similar staining in CBA/J in the organ of Corti with expression underneath IHC and OHCs (arrows). Positive bigger caliber tunnel crossing fibers (tcf) account for the medial efferent innervation. c, DIC of a CBA/J horizontal orientation, inset: high magnification clearly showed staining in the large efferent synapses (asterisk), while smaller putative afferent type II terminals (arrow) were void of immunoreactivity. d, Ly5.1 mice HCN2 staining underneath the IHC, fibers traveling at the base of the tunnel (basilar fibers, bf) and thin caliber tcf (arrows) represent type II afferent fibers. Large boutons underneath OHCs correspond to the efferent innervation. Guinea pig (e) and cat (f) organ of Corti showed the same HCN2 staining pattern like Ly5.1 mice with type I and type II afferent and efferent fibers stained. In cat, the inset shows staining in the large synapses underneath OHCs from the medial efferent fibers (asterisk) and smaller putative type II terminals (arrow). Human sensory epithelia presented high levels of HCN2 expression at equal localization as in animals (g‐m) emphasized in the massive staining in outer spiral bundles (osb) typical for human. g, Immunopositive isp and bf (type II afferents), as well as medial efferent fibers of the tsb. The prominent osb comprises type II afferent as well as efferent fibers shown in (h) in transmission electron microscopy. The figure expose the different nerve fibers of the osb that are difficult to distinguish at light microscopic level. Big caliber efferent (medial olivocochlear fibers, MOC) intermingle with small‐sized type II afferents that are numerous in human. i, Bigger efferent nerve terminals (asterisk) adhere around the basal pole of OHCs together with smaller putative type II afferent terminals (arrow, DC, Deiters cell). j, Horizontal orientated sections from the human organ of Corti confirmed HCN2 staining in isp, osb and fibers crossing Corti's tunnel, (OP, outer pillar; IP, inner pillar). k, Scanning electron microscopy of human OHCs depicts thin caliber nerve fibers (colored nerve fibers) that climb up OHCs as far as the reticular lamina (yellow‐colored fiber). These fibers are positively labeled for HCN2 in human (l, arrow) and mice (d) marked with arrows. The function of these fibers is unknown. l, Another human specimen with positive HCN2 staining m, High magnification of human IHCs identified type I afferents nerve terminals positive for HCN2. B6, C57Bl/6N; CBA, CBA/J; P, postnatal day
FIGURE 4
FIGURE 4
HCN3 expression in the adult mammalian cochlea. HCN3 was weakly expressed in spiral ganglion neuron (SGN) cytoplasm of mice (a–d), guinea pig (i), cat (k), and human (o). In guinea pig and cat HCN3 was detected at the level of outer hair cells (OHCs) (e–f and j). a, In a mid‐modiolar view of C57Bl/6N SGNs presented weak staining. A tonotopic gradient was observed from apex to base. b, CBA/J showed weak staining in neuron cytoplasm. c–d, A more sensitive immunostaining protocol with alkaline phosphatase detection as marker enzyme was performed in Ly5.1; reactivity in apical neuron clusters (d, arrow) was more intense than in basal neurons (c). OHCs in the guinea pig showed specific staining at the lateral membrane (e–f). Staining pattern was similar to the motor protein prestin (g–h). i, HCN3 was also present in the guinea pig SGNs, in cat OHCs (j) as well as cat SGNs (k). l–n, Thin unmyelinated fibers at the peripheral (l, n) and central axon (m) were positive in cat. o, human tissue revealed similar staining as in animal tissue. Most, but not all neurons (arrows) appeared stained. Double staining with peripherin (PRPH) confirmed the presence of HCN3 in type II SGNs (arrows and asterisk) in cat (p), human apical turn SGNs (q) and in C57Bl/6N (r) with varying intensities. p1, q1, r1, DAB channel (HCN3), p2, q2, r2, AEC channel (PRPH) after color deconvolution. B6, C57Bl/6N; CBA, CBA/J; P, postnatal day
FIGURE 5
FIGURE 5
HCN4 expression in the adult mammalian cochlea. a, Mid‐modiolar view of a section from a C57Bl/6N mouse presented visually a tonotopical apex to base gradient. Neurons of the apical turn, especially in neuron clusters were intensely stained. b, Confocal microscopy confirmed the high expression of HCN4 at the neuronal membrane, especially between neurons of a cluster. c–e, HCN4 presented higher intensity of staining in Ly5.1 (e), compared to CBA/J (c) and C57Bl/6N (d). f–h, Confocal microscopy showed HCN4 to be present at the neuronal membrane of type I neurons as well as the peripheral axon initial segment (pAIS) and central axon initial segment (cAIS) in guinea pig (f). CASPR 1 was used as a marker for the distal end of the AISs. AISs lengths differed considerably (f, h). f1, h1, HCN4 staining, f2, h2, CASPR 1 staining, f3, nuclear staining (DAPI). Cat type II neurons presented immunoreactivity in single (i, arrow) and double‐stained sections with additional peripherin (PRPH) staining (j). j1, DAB channel (HCN4), j2, AEC channel (PRPH). Human sections (k–m) presented staining at the perisomatic membrane as well as the cAIS and pAIS. Type II neurons with their delicate unmyelinated axons in humans are positively stained for HCN4 (k). l–m, cAIS length in human varied from very short (l) up to more than 30 µm here (m, arrows). SGN membranes were immunopositive especially in the neuron clusters (arrow, l). n, Double staining with PRPH in a CBA/J mouse showed no co‐expression with HCN4 above background level, n1, DAB channel (HCN4), n2, AEC channel (PRPH) after color deconvolution. o–v, HCN4 expression in the sensory epithelia differed among species: in adult mice, no staining is visible in CBA/J and C57Bl/6N while in Ly5.1 showed staining in young (o) as well as old individuals (p, q). Guinea pig sections presented HCN4 mainly at type I afferents (r), while for cat mainly type II fibers (s, t) were positive. Standard immunohistochemistry methods were not sensitive enough to detect HCN4 in the human organ of Corti (u), but highly sensitive visualization methods using alkaline phosphatase enzymes exposed weak staining underneath the IHC (v). B6, C57Bl/6N; CBA, CBA/J; P, postnatal day
FIGURE 6
FIGURE 6
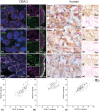
HCN channel co‐expression in SGNs. Co‐expression of HCN1, HCN2, and HCN4 shown in spiral ganglion neurons (SGNs) of 33‐day‐old CBA/J mice and in human. Confocal microscopy was used to unravel the distribution of these channels at the neuronal membrane in basal–middle turn (a–r). Colorimetric immunohistochemistry showed co‐expression in human SGNs in the apical–middle turn (e–u). a–d, HCN1 and HCN2 co‐expression in CBA/J. a, Co‐expression of HCN1 and HCN2 channels at the neuronal membrane. b, c, Single channel expression for HCN1 (b) and HCN2 (c). d, High magnification of the neuronal membrane showed a spotted distribution without color overlapping suggesting homomeric channels. e–g, Co‐expression of HCN1 and HCN2 in human showed a more balanced expression of these subunits, asterisks mark putative type II cells. HCN1 (DAB, f) and HCN2 (AEC, g) channels after color deconvolution. h–k, HCN1 and HCN4 co‐expression revealed a patchy distribution of staining without color overlaps (h). i–j, Single channel staining for HCN1 (i) and HCN4 (j). k, High magnification of the membrane suggested predominant presence of homomeric channels. l–n, HCN1 and HCN4 co‐expression in human (l). Single channel staining for HCN1 (DAB, m) and HCN4 (AEC, n) after color deconvolution showed single‐stained neurons for HCN4 with a large central axon initial segment (asterisk). o–r, HCN2 and HCN4 co‐expression in mice showed higher correlation of staining with partial overlapping fluorescent light (o). Single channel images for HCN2 (p) and HCN4 (q). r, High magnification of the membrane showed overlapping emission spectra (white color). The presence of heteromeric channels cannot be excluded here. s–u, HCN2 and HCN4 co‐expression in human showed a very heterogeneous distribution pattern (s). Single channel staining for HCN2 (DAB, t) and HCN4 (AEC, u) after color deconvolution. v–x, HCN fluorescent staining intensities from different sections in each cochlear turn were plotted as XY‐diagrams with its relative mean intensities of HCN1 versus HCN2 (v), HCN1 versus HCN4 (w) and HCN2 versus HCN4 (x)
FIGURE 7
FIGURE 7
HCN1 and HCN3 postnatal expression until the onset of hearing. HCN1 and HCN3 were only visible at the neuron soma. Differences in the expression of these channels were evaluated during maturation from the first postnatal day until the onset of hearing at 16 days in C57Bl/6N. a–h, HCN1 expression in 1‐, 7‐, 9‐, and 16‐day‐old mice. a, b, HCN1 in P1 C57Bl/6N mice showed an apical–basal gradient (a). Staining in neuron soma (b). c, d, Apical–basal gradient was present at P7 (c), staining intensity decreased at the soma and HCN1 was found mainly at the membrane (d). e, f, At P9, the gradient of staining between different turns faded (e), and HCN1 was mainly present at the neuronal membranes (f). g, h, At the onset of hearing, the apical turn presented high expression in neuronal clusters (g) and overall intensity increased in the perisomatic membranes and the cytoplasm (h). i‐p, HCN3 expression at 1‐, 7‐, 9‐, and 16‐day‐old C57Bl/6N. i–j, at P1 no gradient for HCN3 between turns was observed (i), but high expression of HCN3 in the neuronal soma (j). k–p, no visible gradient was detected at P7 (k, l) or P9 (m, n) until onset of hearing (o, p) and the cytoplasmic staining decreases (P7, l; P9, n; P16, p)
FIGURE 8
FIGURE 8
HCN2 and HCN4 postnatal expression until the onset of hearing. HCN2 and HCN4 were expressed in spiral ganglion neurons (SGNs) and the organ of Corti of C57Bl/6N mice as early as P1 and changed expression during maturation until onset of hearing. a–l, HCN2 expression at 1, 7, 9, and 16 days after birth. a–c, HCN2 was highly expressed at P1 without any visible tonotopical gradient (a). Staining located at the soma (b) as well as in the organ of Corti at afferent fibers underneath the inner hair cell (IHC), (c). d–f, At P7 the staining decreases in neurons (d, e) as well as sensory epithelium (f). g–i, at P9, neurons presented similar staining compared to P7 (g, h) but the intensity underneath the IHC increased and a faint staining underneath the outer hair cells (OHCs) appeared (i). j–l, around the onset of hearing, SGNs presented a more intense staining at the perisomatic neuron membranes compared to P9 and P7 (j, k). The now functional organ of Corti expressed HCN2 in putative type I afferents as well as in the efferent fibers underneath the OHCs (l). m–x: HCN4 expression in 1‐, 7‐, 9‐, and 16‐day‐old C57Bl/6N. m–o, High intensity staining of HCN4 was present at P1 at the soma membrane of SGNs in each turn (m–n). Prominent staining was visible underneath the IHCs and OHCs corresponding to afferent fibers at that developmental stage (o). p–r: at P7 a tonotopical gradient was visible with most intense reactivity in apical clusters (p). Staining intensity decreased at the neuron membrane (q) but prominent staining was still present in the afferent fibers of the organ of Corti (r). s–u, similar staining pattern was present in P9 neurons (s, t) and organ of Corti (u). v–w, after the onset of hearing, the tonotopical gradient faded with similar levels of staining in all turns (v), while overall staining in single neurons remained constant (w). No visible specific staining was detectable in the organ of Corti (x)
FIGURE 9
FIGURE 9
Hearing performance in C57Bl/6N and CBA/J with age. Evoked auditory brainstem responses (eABRs) thresholds of hearing for 4 kHz, 8 kHz, 16 kHz, and 32 kHz in CBA/J (a) and C57Bl/6N (b): tables underneath each figure represent the p‐value (Kruskal–Wallis test for nonparametric data and Dunn's post hoc test with Bonferroni correction, a, b).A value ofp < 0.05 was considered as statistically significant, white represented no statistical difference
FIGURE 10
FIGURE 10
Differential expression of HCN channels in spiral ganglion neuron membrane with aging. HCN staining intensities at the perisomatic membrane of CBA/J and C57Bl/6N strains was semi‐quantified for HCN1, HCN2, and HCN4. Age groups spanned 3 months starting from the onset of hearing until 19‐month‐old mice. a–c, C57Bl/6N semi‐quantification of HCN1 (a), HCN2 (b), and HCN4 (c). d–g, CBA/J semi‐quantification of HCN1 (d), HCN2 (e), and HCN4 (f). Evoked auditory brainstem responses results are plotted as a second y axis representing pure‐tone hearing thresholds (compare to Figure 9). The nonparametric Kruskal–Wallis test and Dunn's post hoc test with Bonferroni correction was applied andp < 0.05 was considered statistically significant
FIGURE 11
FIGURE 11
Graphical representation of statistical p‐value of HCN channel expression levels in SGN membrane in different cochlear turns for each age group. Representation of p‐values for CBA/J (a) and C57Bl/6N (b) of the significance of differences in HCN staining between the three cochlear turns (a, apex; m, middle; b, base). Kruskal–Wallis test was applied followed by Dunn's post hoc test with Bonferroni correction for pairwise comparison. BOH, before onset of hearing. P‐values are indicated in colors, white represents no statistical difference
FIGURE 12
FIGURE 12
Graphical representation of statistical p‐value of HCN channel expression levels in SGN membrane with aging. Representation of HCN1 (a, b), HCN 2 (c, d), and HCN 4(e, f) p‐values of the significance of differences in HCN staining in different age groups of CBA/J (a, c, e) and C57Bl/6N mice (b, d, f) corresponding to Figure 10. The Kruskal–Wallis test was applied for comparison between the turns at different ages. Dunn's post hoc test with the Bonferroni correction was performed for pairwise comparison and p‐values are shown with a color code. White color code marked no statistical significance. BOH; before onset of hearing; a, apex; m, middle; b, base; p, p‐value

Similar articles

Cited by

References

    1. Almanza, A. , Luis, E. , Mercado, F. , Vega, R. , & Soto, E. (2012). Molecular identity, ontogeny, and cAMP modulation of the hyperpolarization‐activated current in vestibular ganglion neurons. Journal of Neurophysiology, 108(8), 2264–2275. 10.1152/jn.00337.2012 - DOI - PubMed
    1. Arifin, W. N. , & Zahiruddin, W. M. (2017). Sample size calculation in animal studies using resource equation approach. Malaysian Journal of Medical Sciences, 24(5), 101–105. 10.21315/mjms2017.24.5.11 - DOI - PMC - PubMed
    1. Arnold, W. (1987). Myelination of the human spiral ganglion. Acta Oto‐Laryngologica. Supplement, 436, 76–84. 10.3109/00016488709124979 - DOI - PubMed
    1. Babola, T. A. , Li, S. , Gribizis, A. , Lee, B. J. , Issa, J. B. , Wang, H. C. , Crair, M. C. , & Bergles, D. E. (2018). Homeostatic control of spontaneous activity in the developing auditory system. Neuron, 99(3), 511–524.e5. 10.1016/j.neuron.2018.07.004 - DOI - PMC - PubMed
    1. Bakondi, G. , Por, A. , Kovacs, I. , Szucs, G. , & Rusznak, Z. (2009). Hyperpolarization‐activated, cyclic nucleotide‐gated, cation non‐selective channel subunit expression pattern of guinea‐pig spiral ganglion cells. Neuroscience, 158(4), 1469–1477. 10.1016/j.neuroscience.2008.10.056 - DOI - PubMed

Publication types

MeSH terms

Substances