

CD4 and CD8 Lymphocyte Counts as Surrogate Early Markers for Progression in SARS-CoV-2 Pneumonia: A Prospective Study
- PMID: 33182268
- PMCID: PMC7695272
- DOI: 10.3390/v12111277
CD4 and CD8 Lymphocyte Counts as Surrogate Early Markers for Progression in SARS-CoV-2 Pneumonia: A Prospective Study
Abstract
Background: COVID-19 pathophysiology and the predictive factors involved are not fully understood, but lymphocytes dysregulation appears to play a role. This paper aims to evaluate lymphocyte subsets in the pathophysiology of COVID-19 and as predictive factors for severe disease.
Patient and methods: A prospective cohort study of patients with SARS-CoV-2 bilateral pneumonia recruited at hospital admission. Demographics, medical history, and data regarding SARS-CoV-2 infection were recorded. Patients systematically underwent complete laboratory tests, including parameters related to COVID-19 as well as lymphocyte subsets study at the time of admission. Severe disease criteria were established at admission, and patients were classified on remote follow-up according to disease evolution. Linear regression models were used to assess associations with disease evolution, and Receiver Operating Characteristic (ROC) and the corresponding Area Under the Curve (AUC) were used to evaluate predictive values.
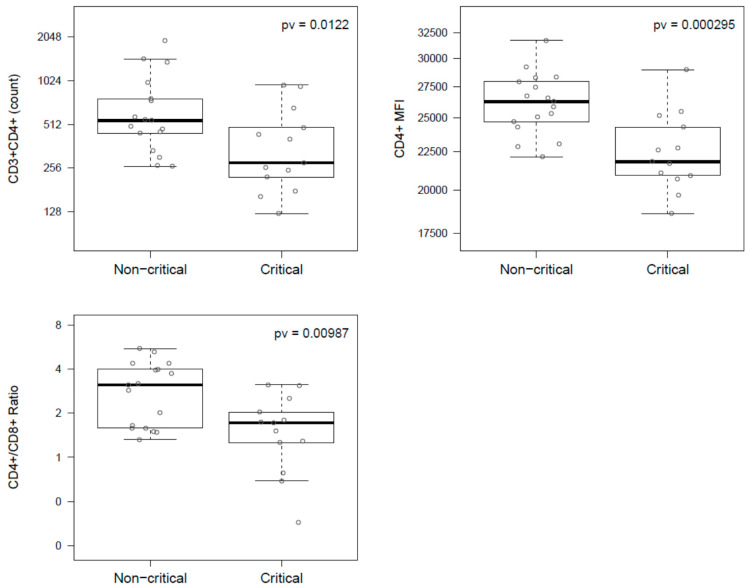
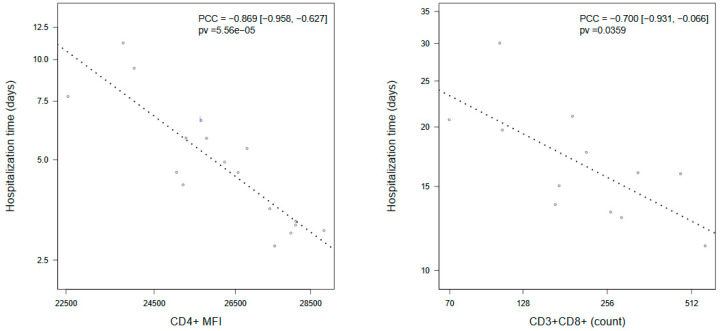
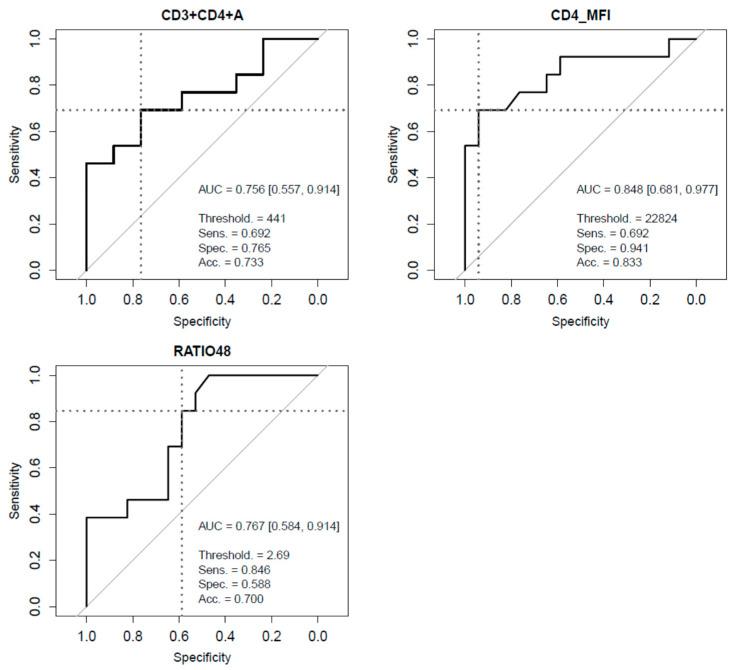
Results: Patients with critical COVID-19 showed a decrease in CD3+CD4+ T cells count compared to non-critical (278 (485 IQR) vs. 545 (322 IQR)), a decrease in median CD4+/CD8+ ratio (1.7, (1.7 IQR) vs. 3.1 (2.4 IQR)), and a decrease in median CD4+MFI (21,820 (4491 IQR) vs. 26,259 (3256 IQR)), which persisted after adjustment. CD3+CD8+ T cells count had a high correlation with time to hospital discharge (PC = -0.700 (-0.931, -0.066)). ROC curves for predictive value showed lymphocyte subsets achieving the best performances, specifically CD3+CD4+ T cells (AUC = 0.756), CD4+/CD8+ ratio (AUC = 0.767), and CD4+MFI (AUC = 0.848).
Conclusions: A predictive value and treatment considerations for lymphocyte subsets are suggested, especially for CD3CD4+ T cells. Lymphocyte subsets determination at hospital admission is recommended.
Keywords: CD4+ T cells; COVID-19; lymphocyte subsets; predictive value; severity.
Conflict of interest statement
All authors declare no competing interest and non-financial disclosures.
Figures
References
-
- Giamarellos-Bourboulis E.J., Netea M.G., Rovina N., Akinosoglou K., Antoniadou A., Antonakos N., Damoraki G., Gkavogianni T., Adami M.-E., Katsaounou P., et al. Complex Immune Dysregulation in COVID-19 Patients with Severe Respiratory Failure. Cell Host Microbe. 2020;27:992–1000. doi: 10.1016/j.chom.2020.04.009. - DOI - PMC - PubMed
MeSH terms
Substances
Grants and funding
LinkOut - more resources
Full Text Sources
Medical
Research Materials
Miscellaneous
