. 2020 Nov 9;12(11):3432.
doi: 10.3390/nu12113432.

Kefir Peptides Prevent Estrogen Deficiency-Induced Bone Loss and Modulate the Structure of the Gut Microbiota in Ovariectomized Mice

Affiliations

Kefir Peptides Prevent Estrogen Deficiency-Induced Bone Loss and Modulate the Structure of the Gut Microbiota in Ovariectomized Mice

Min-Yu Tu et al. Nutrients. .

Abstract

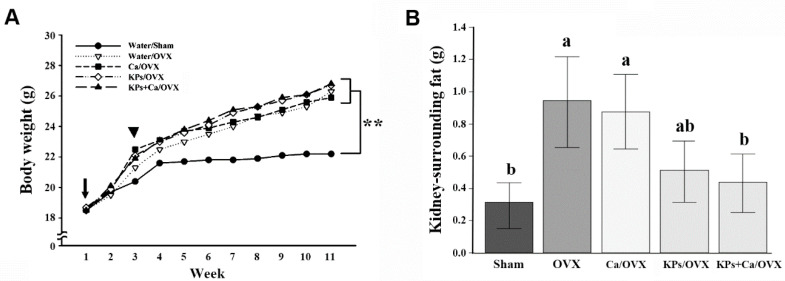
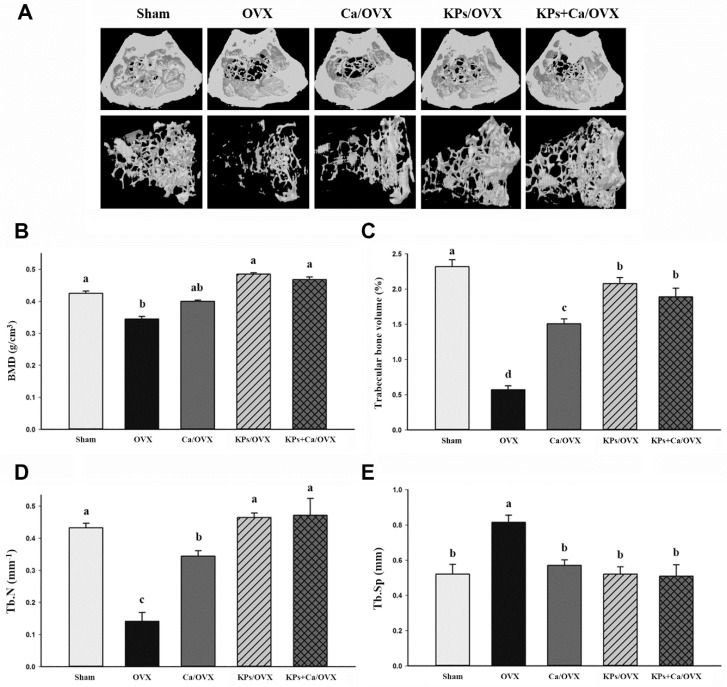
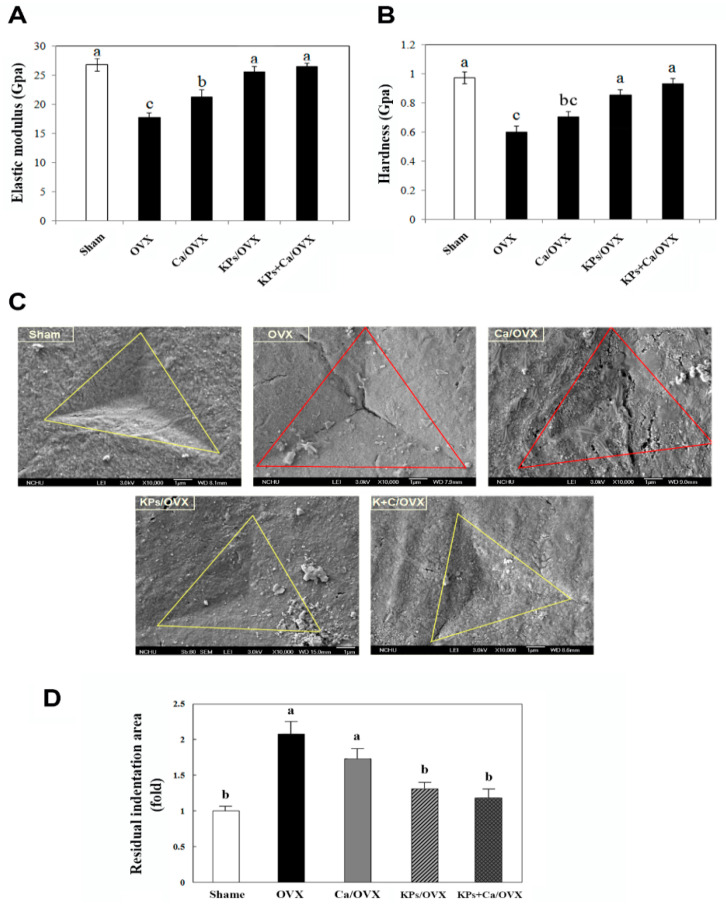
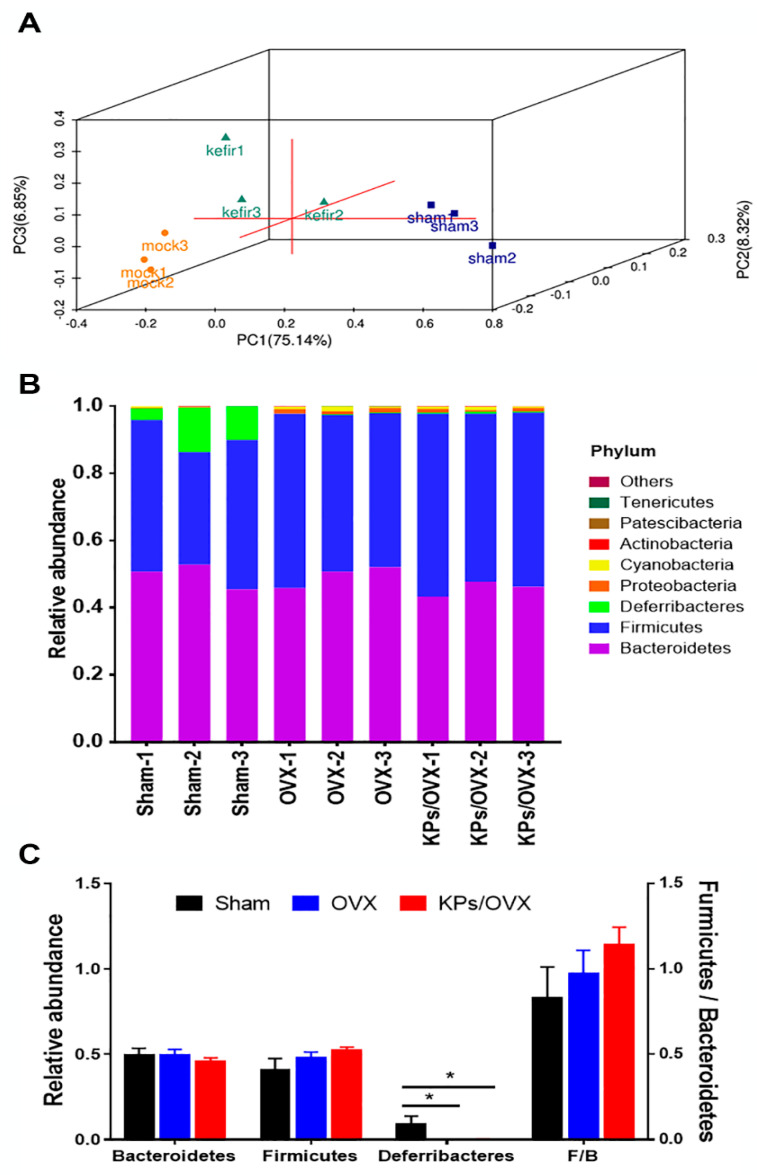
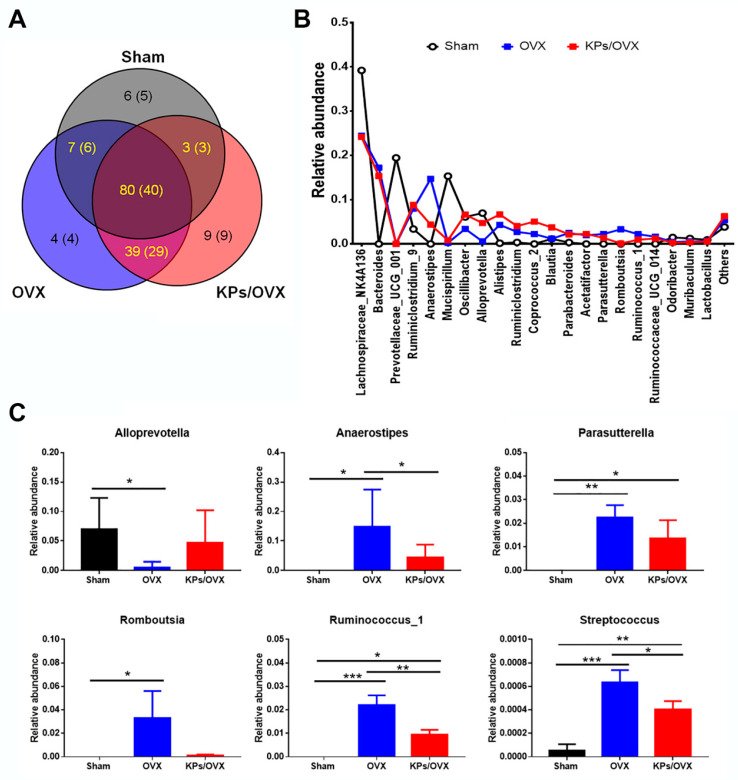
Osteoporosis is a major skeletal disease associated with estrogen deficiency in postmenopausal women. Kefir-fermented peptides (KPs) are bioactive peptides with health-promoting benefits that are produced from the degradation of dairy milk proteins by the probiotic microflora in kefir grains. This study aimed to evaluate the effects of KPs on osteoporosis prevention and the modulation of the composition of the gut microbiota in ovariectomized (OVX) mice. OVX mice receiving an 8-week oral gavage of 100 mg of KPs and 100 mg of KPs + 10 mg Ca exhibited lower trabecular separation (Tb. Sp), and higher bone mineral density (BMD), trabecular number (Tb. N) and bone volume (BV/TV), than OVX groups receiving Ca alone and untreated mice, and these effects were also reflected in bones with better mechanical properties of strength and fracture toughness. The gut microbiota of the cecal contents was examined by 16S rDNA amplicon sequencing. α-Diversity analysis indicated that the gut microbiota of OVX mice was enriched more than that of sham mice, but the diversity was not changed significantly. Treatment with KPs caused increased microbiota richness and diversity in OVX mice compared with those in sham mice. The microbiota composition changed markedly in OVX mice compared with that in sham mice. Following the oral administration of KPs for 8 weeks, the abundances of Alloprevotella, Anaerostipes, Parasutterella, Romboutsia, Ruminococcus_1 and Streptococcus genera were restored to levels close to those in the sham group. However, the correlation of these bacterial populations with bone metabolism needs further investigation. Taken together, KPs prevent menopausal osteoporosis and mildly modulate the structure of the gut microbiota in OVX mice.

Keywords: 16S rDNA; dairy milk protein; gut microbiota; kefir peptides; osteoporosis; ovariectomized (OVX) mice.


Conflict of interest statement

The authors declare no conflict of interest. The funders had no role in the design of the study; in the collection, analyses, or interpretation of data; in the writing of the manuscript, or in the decision to publish the results.

Figures

Figure 1
Figure 1
Body weight and kidney-surrounding fat. (A) The body weight was measured weekly from the onset of ovariectomy surgery to the end of the experiment. Water/Sham group: blank surgery mice fed with ddH2O, Water/OVX group: ovariectomy surgery mice fed with ddH2O; Ca/OVX group: ovariectomy surgery mice fed with 10 mg/kg CaCO3; KPs/OVX group: ovariectomy surgery mice fed with 100 mg/kg kefir peptides; KPs+Ca/OVX group: ovariectomy surgery mice fed with 100 mg/kg kefir peptides + 10 mg/kg CaCO3. In this panel, the arrow indicates the onset of surgery and the arrowhead indicates the beginning of oral administration. The mean body weights were higher in all the OVX groups than in the sham group (**, p < 0.01). (B) The kidney-surrounding fat was removed and measured immediately at the end of the experiment. The data are presented as means ± SEM (n = 6). Statistical analysis was performed by one-way ANOVA and Duncan’s post hoc test, and statistical significances are indicated by different letters (a, b; p < 0.05).
Figure 2
Figure 2
Micro-CT analysis of the femur. (A) Three-dimensional images of the distal femur. The images in the upper panel show the transverse section of the femur, and images in the lower panel show the structure of the trabecular bone. (BE) show the morphological parameters of μ-CT analysis, including bone mineral density (B), trabecular bone volume (Tb. BV/TV) (C), trabecular number (Tb. N) (D) and trabecular separation (Tb. Sp) (E). The data are presented as means ± SEM (n = 6). Statistical analysis was performed by one-way ANOVA and Duncan’s post hoc test, and statistical significances are indicated by different letters (a, b, c; p < 0.05).
Figure 3
Figure 3
Nanoindentation analysis of the mechanical properties of cortical femoral bones at the end of oral administration. Each sample was analyzed by at least three series of outer-to-inner indentation tests (15 points) across the transverse section of the cortical bone shell (130–160 µm in thickness). The mechanical properties of the elastic modulus (A) and hardness (B) were compared among the groups. (C) The indented surfaces were further examined by scanning electron microscopy. The residual nanoindentation areas are marked by triangles and were quantitated using ImageJ software. The relative residual nanoindentation areas were calculated by comparison with the sham group (D). The data are presented as means ± SEM (n = 6). Statistical analysis was performed by one-way ANOVA and Duncan’s post hoc test, and statistical significances are indicated by different letters (p < 0.05).
Figure 4
Figure 4
Analysis of the gut microbiota by 16S rDNA amplicon sequencing. (A) Principal co-ordinates analysis (PCoA), a common method of β-diversity index analysis, was used to evaluate the differential significance of the total abundance of the gut microbiota among the groups. PC1: Pricipal coordinate analysis axis 1; PC2: Pricipal coordinate analysis axis 2; PC3: Pricipal coordinate analysis axis 3. (B) Structural comparison of the gut microbiota at the phylum level. (C) Relative abundances of the phyla Bacteroidetes Firmicutes and Deferribacteres, and the ratio of Firmicutes to Bacteroidetes (F/B), a marker of obesity. Statistical analysis was performed by one-way ANOVA and Tukey’s post hoc test. Statistical significances are indicated by asterisks (*, p < 0.05).
Figure 5
Figure 5
Structural comparison of the gut microbiota at the genus level. (A) Venn diagram comparing the observed operational taxonomic units in the gut microbiota of sham, OVX and KPs/OVX mice. (B) Major bacterial genera identified in this study. (C) Mean relative abundances of the genera Alloprevotella, Anaerostipes, Parasutterella, Romboutsia, Ruminococcus_1 and Streptococcus. Compared with the sham group, these bacterial genera were inhibited or enriched in the OVX group but were reversed in the KPs/OVX group. The data are presented as means ± standard deviation (SD) (n = 3). Statistical analysis was performed by one-way ANOVA and Tukey’s post hoc test. Statistical significances are indicated by asterisks (*, p < 0.05; **, p < 0.01 and ***, p < 0.001).

Similar articles

Cited by

References

    1. Sozen T., Ozisik L., Basaran N.C. An overview and management of osteoporosis. Eur. J. Rheumatol. 2017;4:46–56. doi: 10.5152/eurjrheum.2016.048. - DOI - PMC - PubMed
    1. Burge R., Dawson-Hughes B., Solomon D.H., Wong J.B., King A., Tosteson A. Incidence and Economic Burden of Osteoporosis-Related Fractures in the United States, 2005–2025. J. Bone Miner. Res. 2006;22:465–475. doi: 10.1359/jbmr.061113. - DOI - PubMed
    1. Fardellone P. The effect of milk consumption on bone and fracture incidence, an update. Aging Clin. Exp. Res. 2019;31:759–764. doi: 10.1007/s40520-019-01192-9. - DOI - PubMed
    1. Bourrie B.C.T., Willing B.P., Cotter P.D. The Microbiota and Health Promoting Characteristics of the Fermented Beverage Kefir. Front. Microbiol. 2016;7:647. doi: 10.3389/fmicb.2016.00647. - DOI - PMC - PubMed
    1. Guzel-Seydim Z.B., Kök-Taş T., Greene A.K., Seydim A.C. Review: Functional Properties of Kefir. Crit. Rev. Food Sci. Nutr. 2011;51:261–268. doi: 10.1080/10408390903579029. - DOI - PubMed