. 2020 Nov 9;12(11):1071.
doi: 10.3390/pharmaceutics12111071.

Antimicrobial Peptide against Mycobacterium Tuberculosis That Activates Autophagy Is an Effective Treatment for Tuberculosis

Affiliations

Antimicrobial Peptide against Mycobacterium Tuberculosis That Activates Autophagy Is an Effective Treatment for Tuberculosis

Erika A Peláez Coyotl et al. Pharmaceutics. .

Abstract

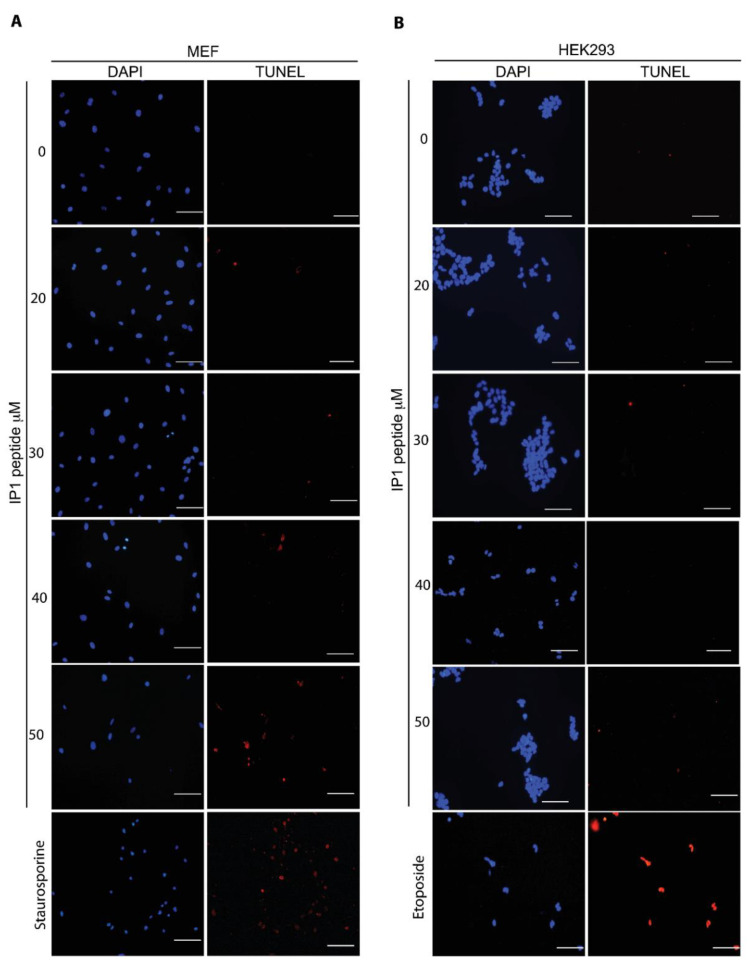
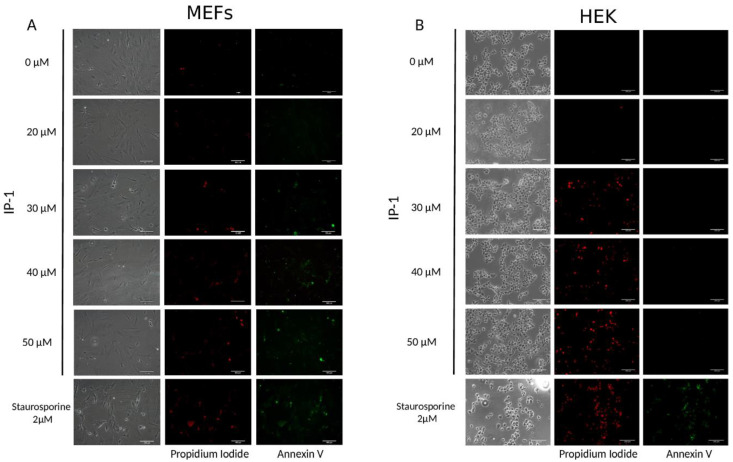
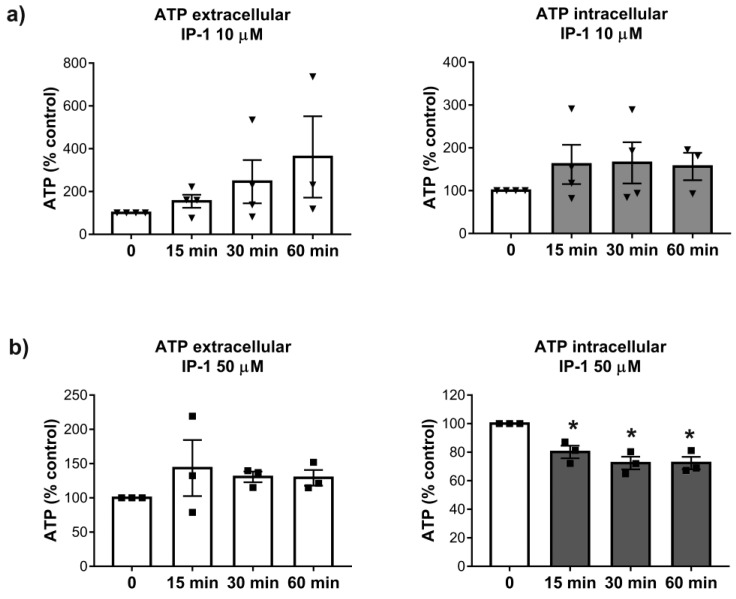
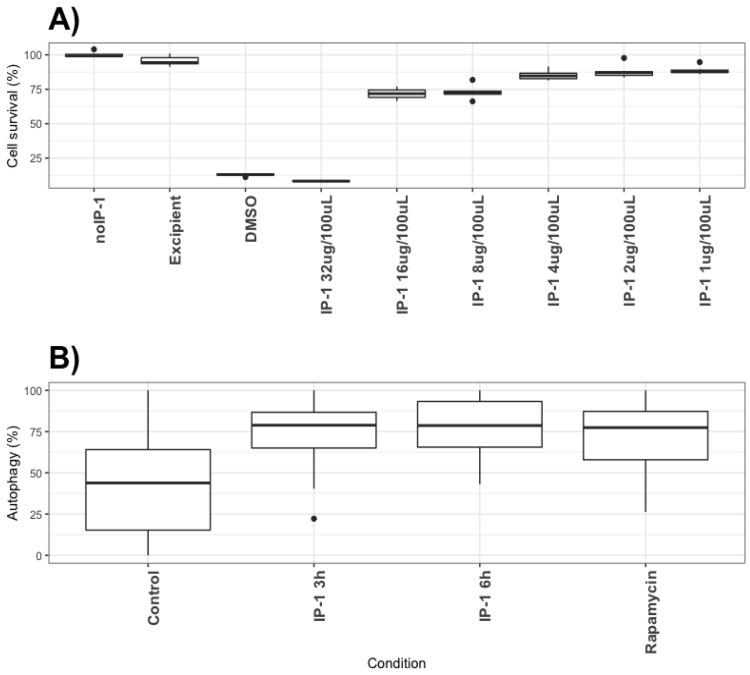
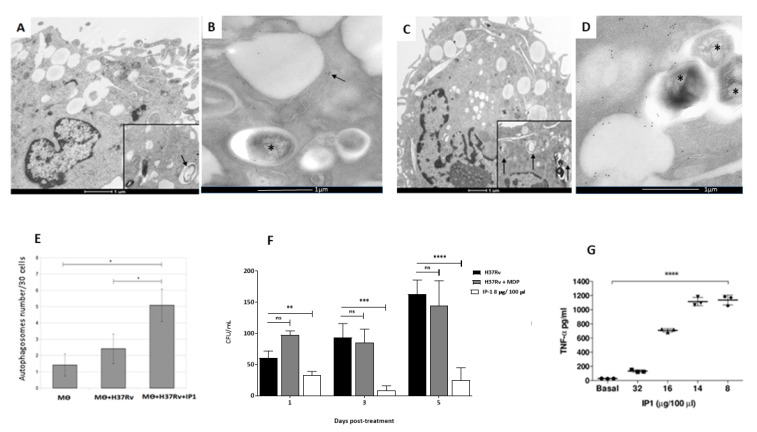
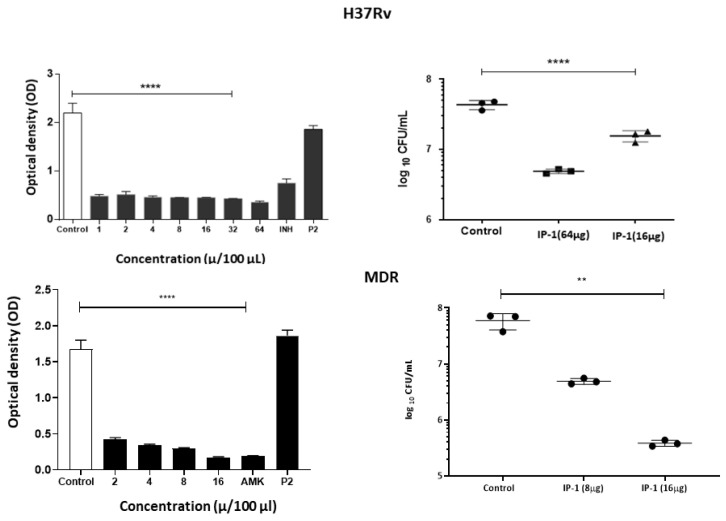
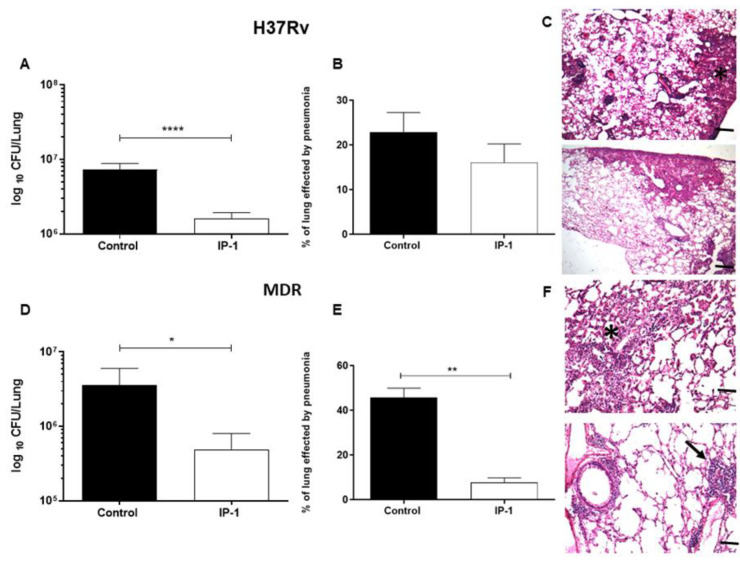
Mycobacterium tuberculosis (MTB) is the principal cause of human tuberculosis (TB), which is a serious health problem worldwide. The development of innovative therapeutic modalities to treat TB is mainly due to the emergence of multi drug resistant (MDR) TB. Autophagy is a cell-host defense process. Previous studies have reported that autophagy-activating agents eliminate intracellular MDR MTB. Thus, combining a direct antibiotic activity against circulating bacteria with autophagy activation to eliminate bacteria residing inside cells could treat MDR TB. We show that the synthetic peptide, IP-1 (KFLNRFWHWLQLKPGQPMY), induced autophagy in HEK293T cells and macrophages at a low dose (10 μM), while increasing the dose (50 μM) induced cell death; IP-1 induced the secretion of TNFα in macrophages and killed Mtb at a dose where macrophages are not killed by IP-1. Moreover, IP-1 showed significant therapeutic activity in a mice model of progressive pulmonary TB. In terms of the mechanism of action, IP-1 sequesters ATP in vitro and inside living cells. Thus, IP-1 is the first antimicrobial peptide that eliminates MDR MTB infection by combining four activities: reducing ATP levels, bactericidal activity, autophagy activation, and TNFα secretion.

Keywords: antimicrobial peptide; autophagy; iztli peptide; multidrug resistant; tuberculosis.


Conflict of interest statement

The authors declare no conflict of interest. The funders had no role in the design of the study; in the collection, analyses, or interpretation of data; in the writing of the manuscript, or in the decision to publish the results.

Figures

Figure 1
Figure 1
IP-1 induces DNA fragmentation in mammalian cells. Mouse Embryonic Fibroblasts (MEFs) (A) or HEK293T cells (B) were incubated for 6 h with the indicated concentrations of IP-1 peptide. As positive controls, MEFS were treated with 2 μM Staurosporine (A) and HEK293T cells were treated with 400 μM etoposide for 2 h. Notice an increasing number of TUNEL-positive cells, which indicates DNA fragmentation, in cells treated with increasing concentrations of IP-1; the experiments were conducted once and were validated with annexin V staining (see below). Nuclei were labeled with DAPI. Scale bar represents 100 μm.
Figure 2
Figure 2
IP-1 induces apoptosis at low doses in MEF cells and necrosis at higher doses in HEK293T cells. MEF (A) and HEK293T (B) cells were treated with IP-1 at the indicated concentrations or with 2 μM Staurosporine for 2 h as positive control. Then, the cells were stained with Annexin V-FITC in order to detect PS exposed to the outer layer of the cell membrane, an event related to apoptosis induction. Additionally, cells that have lost membrane integrity also incorporate propidium iodide, showing red fluorescent staining. As shown in (A), starting at 30 μM of IP-1, MEF cells present Annexin V or propidium iodide staining, unlike to HEK293T cells that only incorporated propidium iodide. Experiments were conducted twice; the images are representative. Scale bar represents 100 μM.
Figure 3
Figure 3
Intra and extracelullar ATP levels of HEK293T cells treated with PI-1. Upper panel (a) shows the extra (left) and intracellular (right) ATP levels of HEK293T cells exposed at IP-1 10 μM. Lower panel (b) shows the extracellular (left) and intracellular (right) ATP levels of HEK293T cells exposed at IP-1 50 μM. The image was generated using R package. Each plot represents the normalized ATP levels of 4 different experiments on HEK293T cells (see Materials and Methods). Each symbol (Triangles, squares) represent an independent determination. Asterisk represents statistical significance p < 0.05 with respect to measurements at time 0.
Figure 4
Figure 4
Cytotoxicity and autophagy induction of IP-1 on macrophages. Top panel: (A) Percentage of macrophages (J774.1) staining with violet dye, as an indicator of cell survival (see Materials and Methods section). noIP-1 and Excipient shows percentage of staining on cells without IP-1; DMSO is a toxic agent to macrophages and serves as positive control for dead cells; different concentrations of IP-1 were used (1, 2, 4, 8, 16, and 32 μM) to test for the survival of macrophages. The data were derived from at least 3 to 6 independent experiments. Bottom panel: (B) The percentage of cells showing green dots as indicative of autophagy as detected by Cyto-ID (see Materials and Methods section). Control are cells not exposed to IP-1, Rapamycin show the results of cells exposed to the autophagy-inducer rapamycin, and the autophagy detected at 3 and 6 h in the presence of IP-1 are shown. These data were derived from at least 30 photographs obtained from 3 independent experiments. The statistical comparison between groups was performed using ANOVA test and the p-values were obtained from a Post-hoc analysis with Tukey test (see [34]). The black circles represent outliers.
Figure 5
Figure 5
Effect of IP-1 on macrophages infected in-vitro with M. tuberculosis strain H37Rv. Representative electron microscopy micrographs of: (A) macrophage after one hour infection showing a phagocytosed bacteria and in the inset occasional double membrane vacuoles that correspond to autophagosomes (arrow). (B) Subcellular detection of autophagosomes by immunolabeling with specific antibodies against LC3, macrophage after 24 h of infection showing a phagosome with bacteria (asterisk) near to vacuoles/lysosomes surrounded by LC-3 detected by gold labeled antibodies (black dots, arrow). (C) Infected macrophage and incubated with IP-1 showing bacterial debris and in the inset several autophagosomes (arrows). (D) Infected macrophage incubated with LC-3 showing bacteria into phagosomes (asterisks) near to several LC-3 immunogold labeled vacuoles/lysosomes (black dots). (E) The morphometric study confirms significantly more autophagosomes (y-axis) in infected macrophages incubated with IP-1. (F) Determination of intracellular bacillary loads by colony forming units counts (CFU) in infected macrophages with mycobacteria strain H37Rv, after one, three and five days of incubation with MDP (muramil dipeptide control) or with 16 µg/100 µL of IP-1; all the studied times showed significant decrease of live bacillary counts. (G) Macrophages were infected with mycobacteria strain H37Rv, and after 24 h of incubation with the indicated concentration of IP-1 the supernatants were collected and used to determine TNFα by ELISA, low IP-1 concentrations (8 and 16 μg/100 μL) induced significant amount of TNFα, while larger IP-1 concentration (32 μg/100 μL) reduced its production. Each symbol represents one independent experiment. Each symbol (Triangles, squares, circles) represents one independent experiment. Asterisk represents statistical significance (* p < 0.05, ** p < 0.003, *** p < 0.002, **** p < 0.0005). ns: not significant.
Figure 6
Figure 6
Effect of IP-1 against M. tuberculosis (top panel H37Rv, bottom panel MDR strain) in vitro. Left figures show the MICs determined by broth microdilution evaluated by a colorimetric assay using Cell Titer 96® Aqueous, and right figures show viability of the bacteria by counting the colony-forming units after treatment with the indicated IP-1 concentrations; each symbol (Triangles, squares, circles) represent an independent determination. All the IP-1 concentrations showed significant activity against mycobacteria, being MDR strain more susceptible to IP-1 and similar to the MIC control that corresponded to amikacin (AMK), an antibiotic for which this strain is highly susceptible, and for drug-sensible H37Rv strain isoniazid (INH) that is the most efficient primary antibiotic. As negative control we include P2, a synthetic peptide derived from arachnid AMP at 64 μg. Each result is reported as the mean ± SD, asterisk represents statistical significance (** p < 0.003, **** p < 0.0005).
Figure 7
Figure 7
Effect of IP-1 treatment in BALB/c mice at 60 days post-infection with the drug-sensitive or drug resistant MTB strains. (A) Groups of mice infected with drug sensitive H37Rv strain were treated with 8 µg of IP-1 by intratracheal route each other day during one month, right lung was used to determinate bacillary loads by colony forming units (CFU), treated mice showed a significant decrease of live bacilli in comparison with control mice. (B) Left lungs were perfused with formaldehyde and used to determine pneumonia by automated morphometry, in comparison with control mice, a non-significant decrease of lung consolidation was seen in treated animals. (C) Representative micrographs of control non-treated mouse infected with H37Rv strain (top figure) shows similar lung surface area affected by pneumonia (asterisk) that in mouse treated with IP-1 (bottom figure). (D) The same treatment in mice infected with MDR strain showed a significant decrease of bacillary loads and lung surface affected by pneumonia. (E) Asterisk represents statistical significance (p < 0.05). (F) Representative micrograph of control non-treated mouse infected with MDR strain showing areas of pneumonia (asterisk, top figure), in comparison with MDR infected mouse treated with IP-1 that exhibits small patches of pneumonia (arrow, bottom figure) and perivascular inflammation (H/E staining, magnification 100×). The images correspond with one representative experiment. The bars in images (C) and (F) represent 200 μm. Asterisk represents statistical significance (* p < 0.05, ** p < 0.003, **** p < 0.0005).

Similar articles

Cited by

References

    1. Barbier M., Wirth T. Tuberculosis and the Tubercle Bacillus. 2nd ed. American Society of Microbiology; Washington, DC, USA: 2016. The Evolutionary History, Demography, and Spread of the Mycobacterium tuberculosis Complex; pp. 453–473. - PubMed
    1. Andam C.P., Worby C.J., Chang Q., Campana M.G. Microbial Genomics of Ancient Plagues and Outbreaks. Trends Microbiol. 2016;24:978–990. doi: 10.1016/j.tim.2016.08.004. - DOI - PubMed
    1. Tiberi S., Pontali E., Tadolini M., D’Ambrosio L., Migliori G.B. Challenging MDR-TB clinical problems—The case for a new Global TB Consilium supporting the compassionate use of new anti-TB drugs. Int. J. Infect. Dis. 2019;80:S68–S72. doi: 10.1016/j.ijid.2019.01.040. - DOI - PubMed
    1. Tan S., Russell D.G. Trans-species communication in the Mycobacterium tuberculosis-infected macrophage. Immunol. Rev. 2015;264:233–248. doi: 10.1111/imr.12254. - DOI - PMC - PubMed
    1. Al-Saeedi M., Al-Hajoj S. Diversity and evolution of drug resistance mechanisms in Mycobacterium tuberculosis. Infect. Drug Resist. 2017;10:333. doi: 10.2147/IDR.S144446. - DOI - PMC - PubMed

LinkOut - more resources