

Laron Syndrome Research Paves the Way for New Insights in Oncological Investigation
- PMID: 33182502
- PMCID: PMC7696416
- DOI: 10.3390/cells9112446
Laron Syndrome Research Paves the Way for New Insights in Oncological Investigation
Abstract
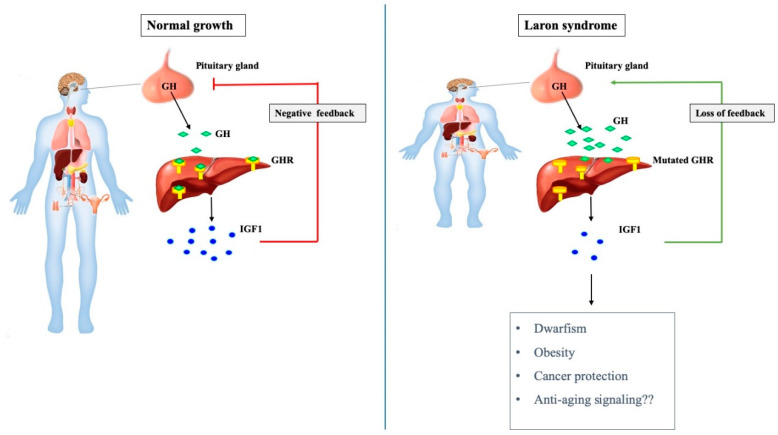
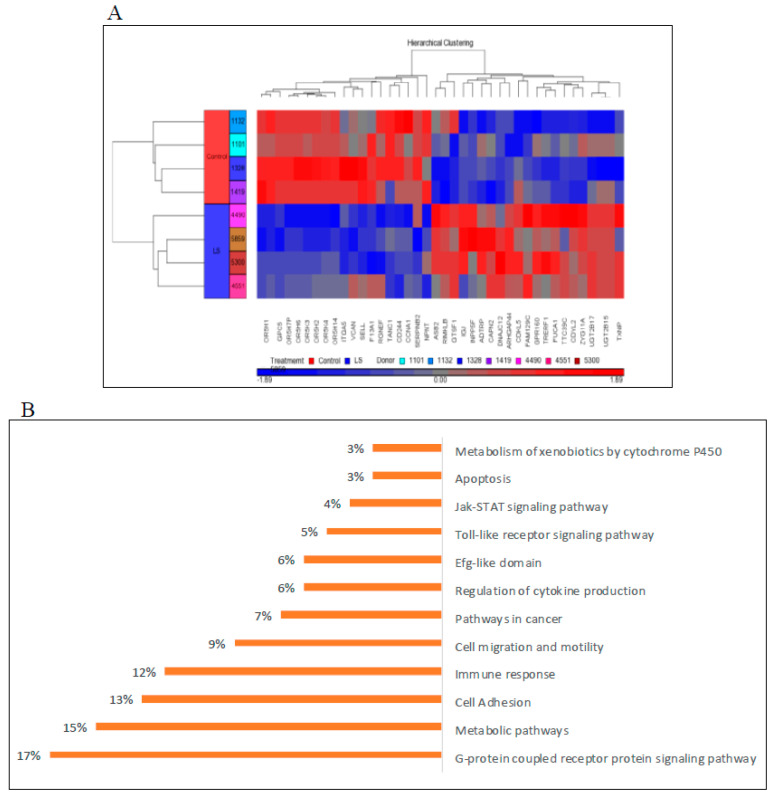
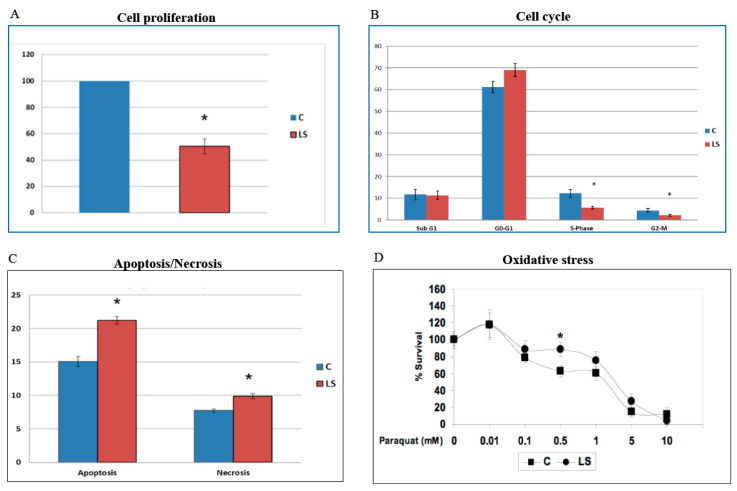
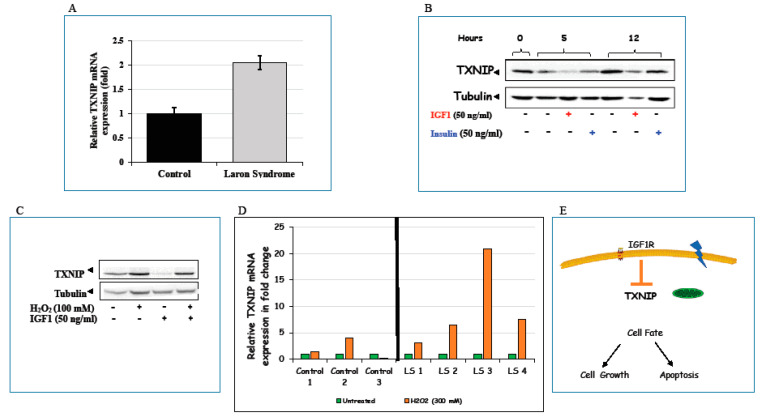
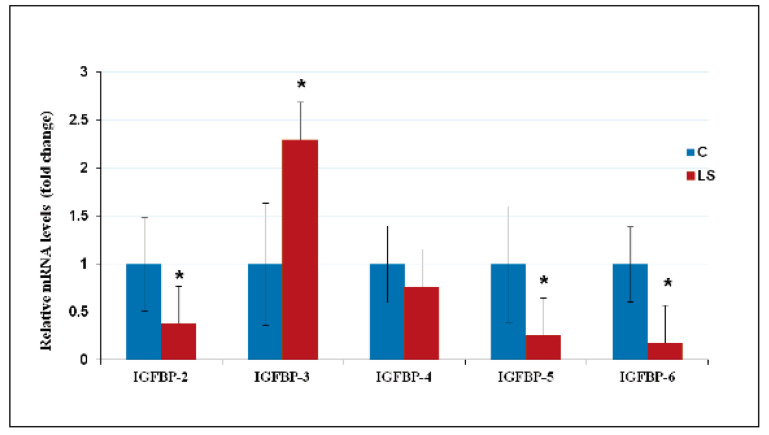
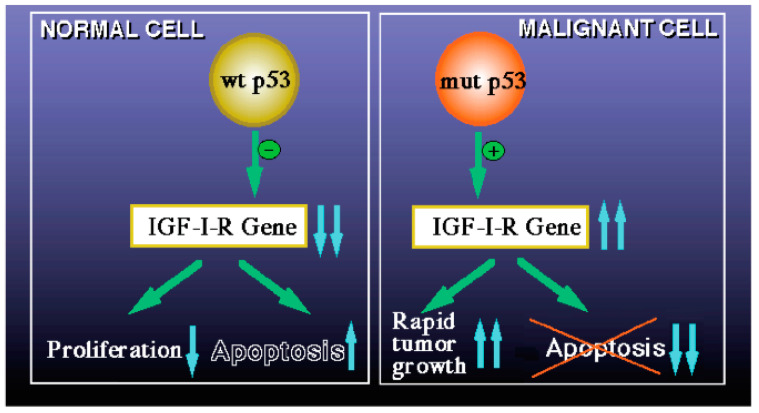
Laron syndrome (LS) is a rare genetic endocrinopathy that results from mutation of the growth hormone receptor (GH-R) gene and is typically associated with dwarfism and obesity. LS is the best characterized entity under the spectrum of the congenital insulin-like growth factor-1 (IGF1) deficiencies. Epidemiological analyses have shown that LS patients do not develop cancer, whereas heterozygous family members have a cancer prevalence similar to the general population. To identify genes and signaling pathways differentially represented in LS that may help delineate a biochemical and molecular basis for cancer protection, we have recently conducted a genome-wide profiling of LS patients. Studies were based on our collection of Epstein-Barr virus (EBV)-immortalized lymphoblastoid cell lines derived from LS patients, relatives and healthy controls. Bioinformatic analyses identified differences in gene expression in several pathways, including apoptosis, metabolic control, cytokine biology, Jak-STAT and PI3K-AKT signaling, etc. Genes involved in the control of cell cycle, motility, growth and oncogenic transformation are, in general, down-regulated in LS. These genetic events seem to have a major impact on the biological properties of LS cells, including proliferation, apoptosis, response to oxidative stress, etc. Furthermore, genomic analyses allowed us to identify novel IGF1 downstream target genes that have not been previously linked to the IGF1 signaling pathway. In summary, by 'mining' genomic data from LS patients, we were able to generate clinically-relevant information in oncology and, potentially, related disciplines.
Keywords: Laron syndrome; cancer protection; growth hormone; growth hormone receptor; insulin-like growth factor-1 (IGF1).
Conflict of interest statement
The authors declare no conflict of interest.
Figures
Similar articles
-
Identification of signaling pathways associated with cancer protection in Laron syndrome.Endocr Relat Cancer. 2016 May;23(5):399-410. doi: 10.1530/ERC-16-0054. Epub 2016 Apr 18. Endocr Relat Cancer. 2016. PMID: 27090428
-
Congenital IGF-1 deficiency protects from cancer: lessons from Laron syndrome.Endocr Relat Cancer. 2023 Jul 28;30(9):e220394. doi: 10.1530/ERC-22-0394. Print 2023 Sep 1. Endocr Relat Cancer. 2023. PMID: 37343154
-
Identification of nephronectin as a new target for IGF1 action.Eur J Cancer. 2020 Dec;141:115-127. doi: 10.1016/j.ejca.2020.09.034. Epub 2020 Oct 30. Eur J Cancer. 2020. PMID: 33130549
-
Genome-Wide Profiling of Laron Syndrome Patients Identifies Novel Cancer Protection Pathways.Cells. 2019 Jun 15;8(6):596. doi: 10.3390/cells8060596. Cells. 2019. PMID: 31208077 Free PMC article. Review.
-
Clinical and Molecular Features of Laron Syndrome, A Genetic Disorder Protecting from Cancer.In Vivo. 2016 Jul-Aug;30(4):375-81. In Vivo. 2016. PMID: 27381597 Review.
Cited by
-
The Olfactory Receptor Gene Product, OR5H2, Modulates Endometrial Cancer Cells Proliferation via Interaction with the IGF1 Signaling Pathway.Cells. 2021 Jun 12;10(6):1483. doi: 10.3390/cells10061483. Cells. 2021. PMID: 34204736 Free PMC article.
-
In Vivo Effects of a GHR Synthesis Inhibitor During Prolonged Treatment in Dogs.Pharmaceuticals (Basel). 2024 Oct 16;17(10):1381. doi: 10.3390/ph17101381. Pharmaceuticals (Basel). 2024. PMID: 39459020 Free PMC article.
-
Safety of growth hormone replacement in survivors of cancer and intracranial and pituitary tumours: a consensus statement.Eur J Endocrinol. 2022 Apr 21;186(6):P35-P52. doi: 10.1530/EJE-21-1186. Eur J Endocrinol. 2022. PMID: 35319491 Free PMC article. Review.
-
[Diabetes mellitus and cancer: a system of insulin-like growth factors].Probl Endokrinol (Mosk). 2021 Sep 10;67(5):34-42. doi: 10.14341/probl12741. Probl Endokrinol (Mosk). 2021. PMID: 34766488 Free PMC article. Russian.
-
Characteristic amino acid residues in the growth hormone receptor gene on Mus minutoides underlying dwarfism.MicroPubl Biol. 2023 Sep 11;2023:10.17912/micropub.biology.000955. doi: 10.17912/micropub.biology.000955. eCollection 2023. MicroPubl Biol. 2023. PMID: 37767364 Free PMC article.
References
-
- Salmon W.D., Daughaday W.H. A hormonally controlled serum factor which stimulates sulfate incorporation by cartilage in vitro. J. Lab. Clin. Med. 1957;49:825–836. - PubMed
-
- Bentov I., Werner H. Insulin-like growth factors and breast cancer. Curr. Med. Lit.-Breast Cancer. 2009;21:113–120.
Publication types
MeSH terms
Substances
LinkOut - more resources
Full Text Sources
Medical
Miscellaneous
