. 2020 Nov 10;9(11):2452.
doi: 10.3390/cells9112452.

Photochemotherapy Induces Interferon Type III Expression via STING Pathway

Affiliations

Photochemotherapy Induces Interferon Type III Expression via STING Pathway

Edyta Biskup et al. Cells. .

Abstract

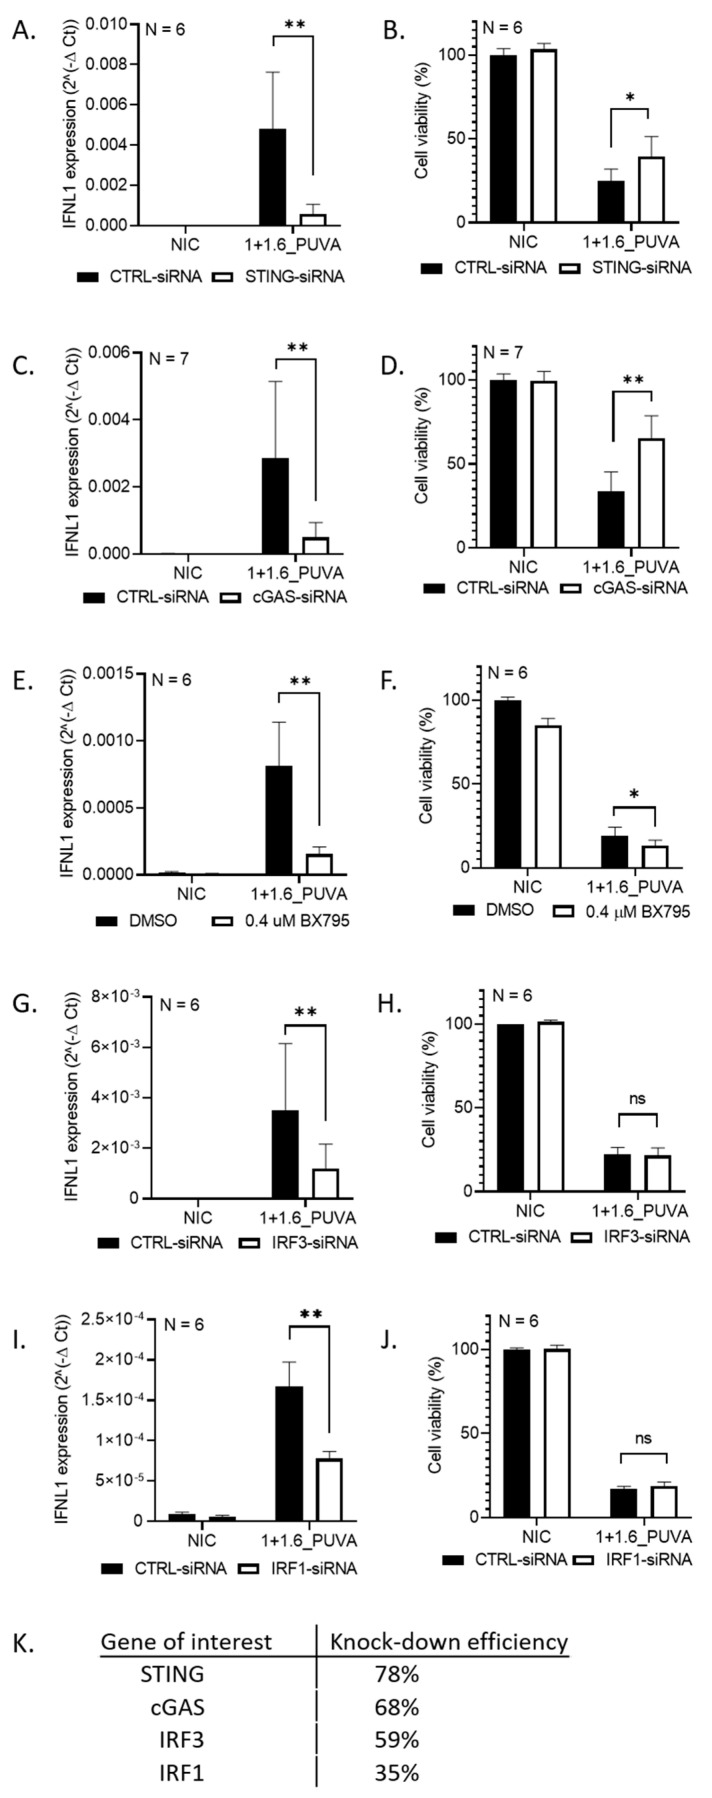
DNA-damaging cancer therapies induce interferon expression and stimulate the immune system, promoting therapy responses. The immune-activating STING (Stimulator of Interferon Genes) pathway is induced when DNA or double-stranded RNA (dsRNA) is detected in the cell cytoplasm, which can be caused by viral infection or by DNA damage following chemo- or radiotherapy. Here, we investigated the responses of cutaneous T-cell lymphoma (CTCL) cells to the clinically applied DNA crosslinking photochemotherapy (combination of 8-methoxypsoralen and UVA light; 8-MOP + UVA). We showed that this treatment evokes interferon expression and that the type III interferon IFNL1 is the major cytokine induced. IFNL1 upregulation is dependent on STING and on the cytoplasmic DNA sensor cyclic GMP-AMP synthase (cGAS). Furthermore, 8-MOP + UVA treatment induced the expression of genes in pathways involved in response to the tumor necrosis factor, innate immune system and acute inflammatory response. Notably, a subset of these genes was under control of the STING-IFNL1 pathway. In conclusion, our data connected DNA damage with immune system activation via the STING pathway and contributed to a better understanding of the effectiveness of photochemotherapy.

Keywords: CTCL; DNA damage; IFNL1; PUVA; STING.


Conflict of interest statement

The authors declare no conflict of interest.

Figures

Figure 1
Figure 1
Cutaneous T-cell lymphoma (CTCL)-derived cells express interferon lambda 1 (IFNL1) in response to 8–methoxypsoralen and UVA light (8–MOP + UVA), and its expression is proportional to the cell death. Expression of IFNL1 in (A) Hut78, (B) MyLa2000, (C) SeAx and (D) spontaneously immortalized human keratinocytes (HaCaT) treated with increasing doses of 8–MOP + UVA were measured by RT-qPCR and corrected for GAPDH expression. Viability of (E) Hut78, (F) MyLa2000, (G) SeAx and (H) HaCaT was evaluated by propidium iodide exclusion assay. Error bars represent ± SEM of the indicated N repeats. * p < 0.1, ** p < 0.05 and *** p < 0.01. NIC—not irradiated control and PUVA—8–MOP + UVA treatment; in the treatment description, the first number refers to the 8–MOP concentration in µM and the second to the UVA dose in J/cm2.
Figure 2
Figure 2
IFNL1 expression in 8–MOP + UVA-treated Hut78 may result from acute DNA damage rather than micronuclei formation. (A) IFNL1 expression upon treatment with commonly used genotoxic chemotherapeutics, cisplatin and etoposide. (B) Hut78 viability following treatment with cisplatin and etoposide. (C) IFNL1 expression in Hut78 following 8–MOP + UVA treatment as a function of time. (D) DAPI staining of 8–MOP + UVA-treated Hut78 cells; solid white arrows indicate nuclei of cells undergoing apoptosis; empty arrows indicate micronuclei. Percent of micronucleated cells stated in the bottom-left corner in each photo. (E) IFNL1 expression in cells treated with 8–MOP + UVA and ataxia-telangiectasia and Rad3-related (ATR) kinase inhibitor AZD6738; distribution: skewed, test: paired Wilcoxon. (F) IFNL1 expression in cells incubated with S1 nuclease, specific for single-stranded DNA (ssDNA) and treated with 8–MOP + UVA; distribution: normal, test: paired t-test. (G) IFNL1 expression in Hut78 cells treated with fresh RPMI medium, with supernatant collected from untreated and with supernatant collected from 8–MOP + UVA-treated cells; test: paired t-test. Error bars represent ± SEM of the indicated N repeats. ** p < 0.05.
Figure 3
Figure 3
The Stimulator of Interferon Genes (STING) pathway is activated in Hut78 by 8–MOP + UVA treatment. Downregulation of alleged pathway elements by specific small interfering RNA (siRNA) or by a chemical inhibitor result in decreased IFNL1 expression. Expression of IFNL1 following 8–MOP + UVA treatment combined with (A) STING downregulation by siRNA, (B) cyclic GMP-AMP synthase (cGAS) downregulation by siRNA, (C) TBK1 inhibition by BX795 chemical inhibitor, (D) IRF3 downregulation by siRNA and (E) IRF1 downregulation by siRNA. Cell viability for respective treatments is presented in (F) for STING-siRNA, (G) for cGAS-siRNA, (H) for BX795-mediated TBK1 inhibition, (I) for IRF3-siRNA and (J) for IRF1-siRNA. (K) Transfection efficiencies for various siRNAs. Error bars represent ± SEM of the indicated N repeats. Statistics—normal distribution, paired t-test: (AE) and skewed distribution, paired Wilcoxon: (F–J). Choice of the statistical test was made based on the type of data distribution (see Methods). * p < 0.1, ** p < 0.05, ns–not significant.
Figure 4
Figure 4
Unbiased analysis of the transcriptional response in Hut78 to 8–MOP + UVA treatment, performed by RNA-Seq. (A) 2D dot plot showing genes affected by 8–MOP + UVA treatment and STING downregulation. X-axis: gene expression ratio between STING-siRNA and CTRL-siRNA-transfected samples after 8–MOP + UVA (PUVA) treatment. Y-axis: gene expression ratio between NIC and 8–MOP + UVA samples, transfected with CTRL-siRNA; green frame: transcripts upregulated after 8–MOP + UVA treatment by at least 1 on the log e scale; red frame: transcripts upregulated by 8–MOP + UVA, which upregulation was suppressed by STING knockdown. Dot color scale: −log10 value of the false discovery rate (FDR) significance score of the differential expression (DE) analysis between the CTRL-siRNA_PUVA and CTRL–siRNA_NIC conditions. (B) Set of gene ontology (GO) pathways showing a significant change between NIC and 8–MOP + UVA (PUVA)-treated samples, transfected with CTRL-siRNA. They were sorted based on the gene ratio, which is the number of genes related to the GO term/total number of genes of interest. The complete list of pathways was summarized into broader categories shown in the Y-axis. The gene number ratio is shown in the X-axis, and adjusted p-values and counts are shown with a color scale and dot size.
Figure 5
Figure 5
RT-qPCR verification of hits identified by RNA-Seq, i.e., transcripts upregulated by 8–MOP + UVA and remaining under STING control, largely confirms our findings. (AK) Expression levels of each potential hit were measured in untreated (NIC) and subjected to 8–MOP + UVA (PUVA) treatment cells, transfected either with CTRL-siRNA or with STING-siRNA. (L) Statistical test used, chosen depending on the data distribution type (normal—paired t-test and skewed in at least one set—paired Wilcoxon test; see Methods). * p < 0.1, ** p < 0.05, *** p < 0.01, ns–not significant. STING knockdown efficiency: 82%.
Figure 6
Figure 6
Expression of several of the potential hits remains under the control of IFNL1. Downregulation of IFNL1 abrogates the expression of CDKN1A, OSGIN1, SCL7A11 and IRF7 in response to 8–MOP + UVA. Hut78 cells were transfected with IFNL1-siRNA and, subsequently, treated with 8–MOP + UVA, and expression levels of the following genes were measured by RT-qPCR. (A) CDKN1A, (B) SCL7A11, (C) OSGIN1 and (D) IRF7. Statistics: normal distribution, paired t-test: (A,D) and skewed distribution, paired Wilcoxon: (B,C). Choice of the statistical test was made based on the type of data distribution (see Methods). IFNL1 knockdown efficiency: 80%. Expression of (E) CDKN1A, (F) SCL7A11, (G) OSGIN1 and (H) IRF7 after treatment with soluble IFNL1 in the absence of DNA damage. Statistics: paired t-test. * p < 0.1, ** p < 0.05, ns – not significant.

References

    1. Bracci L., Schiavoni G., Sistigu A., Belardelli F. Immune-based mechanisms of cytotoxic chemotherapy: Implications for the design of novel and rationale-based combined treatments against cancer. Cell Death Differ. 2014;21:15–25. doi: 10.1038/cdd.2013.67. - DOI - PMC - PubMed
    1. Mitchison T.J., Pineda J., Shi J., Florian S. Is inflammatory micronucleation the key to a successful anti-mitotic cancer drug? Open Biol. 2017;7 doi: 10.1098/rsob.170182. - DOI - PMC - PubMed
    1. Wang Y.J., Fletcher R., Yu J., Zhang L. Immunogenic effects of chemotherapy-induced tumor cell death. Genes Dis. 2018;5:194–203. doi: 10.1016/j.gendis.2018.05.003. - DOI - PMC - PubMed
    1. Vatner R.E., Janssen E.M. STING, DCs and the link between innate and adaptive tumor immunity. Mol. Immunol. 2019;110:13–23. doi: 10.1016/j.molimm.2017.12.001. - DOI - PMC - PubMed
    1. Yum S., Li M., Chen Z.J. Old dogs, new trick: Classic cancer therapies activate cGAS. Cell Res. 2020;30:639–648. doi: 10.1038/s41422-020-0346-1. - DOI - PMC - PubMed

Publication types