. 2020 Nov 12;20(1):168.
doi: 10.1186/s12902-020-00649-7.

Impact of malnutrition on systemic immune and metabolic profiles in type 2 diabetes

Affiliations

Impact of malnutrition on systemic immune and metabolic profiles in type 2 diabetes

Anuradha Rajamanickam et al. BMC Endocr Disord. .

Abstract

Background: While obesity and overweight status are firmly established risk factors for Type 2 diabetes mellitus (T2DM), a substantial proportion of diabetic individuals, especially in Africa and Asia, are often underweight or normal weight. However, very little is known about the immunological and metabolic profiles of these individuals.

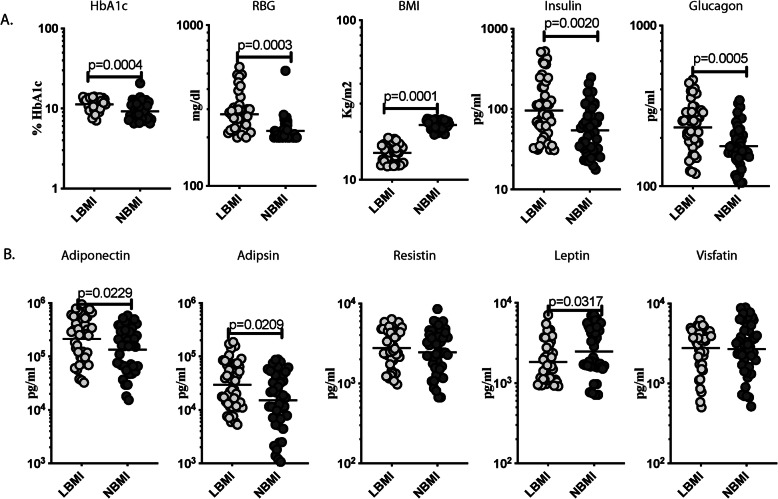
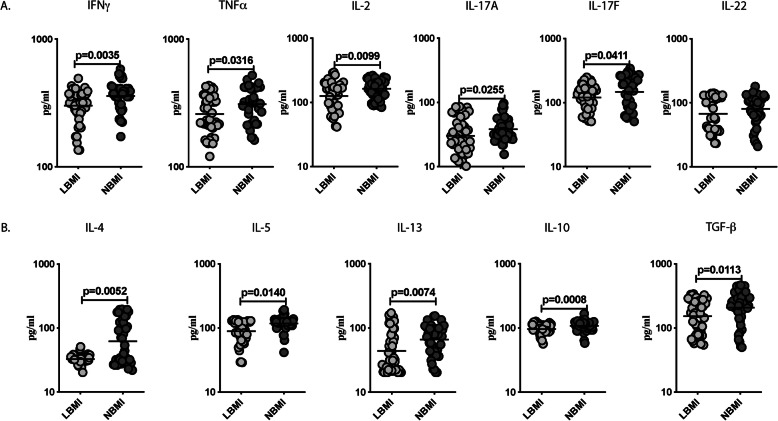
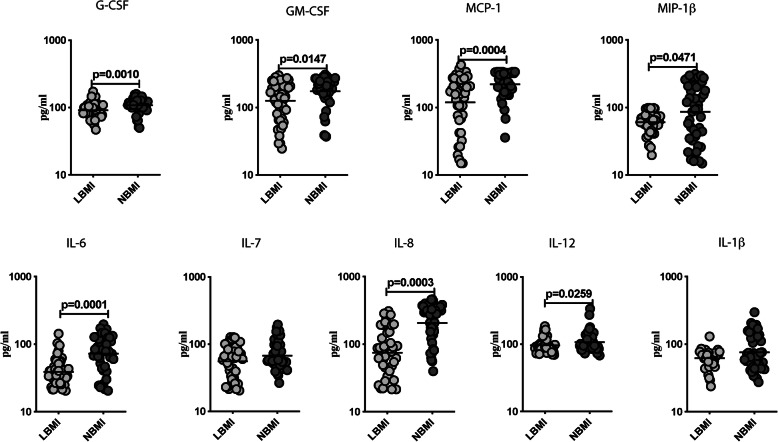
Methods: This study aimed to assess the relationship between malnutrition and Type 2 diabetes mellitus (T2DM). We examined a variety of analytes associated with the immunological and metabolic profiles of T2DM individuals with low (< 18.5 kg/m2) or normal (18.5-24.9 kg/m2) body mass index (BMI). To this end, we measured plasma levels of HbA1c, glucose, insulin, glucagon, adipocytokines and Type 1, Type 2, Type 17, pro-inflammatory and regulatory cytokines in T2DM individuals with low BMI (LBMI) or normal BMI (NBMI) with small sample size n = 44 in each group.

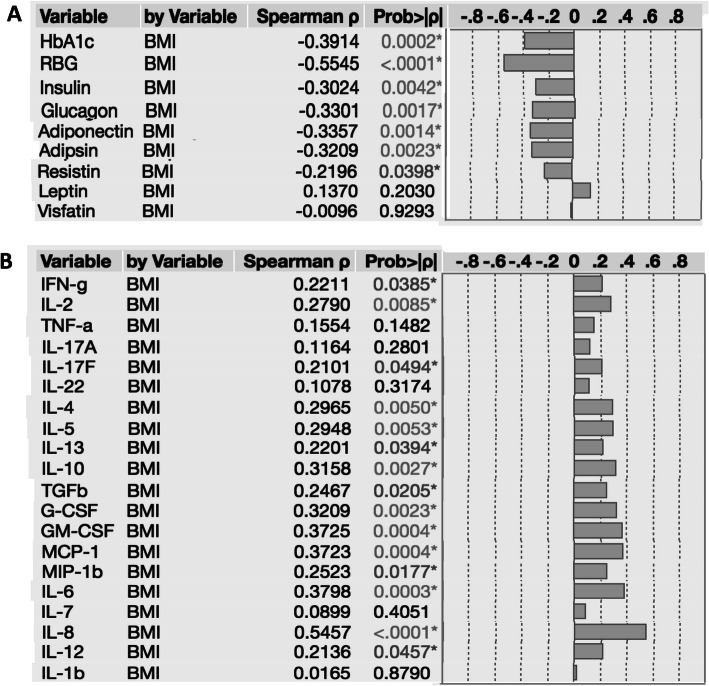
Results: LBMI individuals exhibited significantly higher levels of HbA1c, random blood glucose, insulin and glucagon compared to NBMI individuals. Similarly, LBMI individuals exhibited significantly higher levels of adiponectin and adipsin and significantly lower levels of leptin in comparison to NBMI individuals. LBMI individuals also exhibited significantly lower levels of the Type 1, Type 2, Type 17, pro-inflammatory and regulatory cytokines in comparison to NBMI individuals. Finally, while the metabolic parameters exhibited a significant negative correlation with BMI, the immunological parameters exhibited a significant positive correlation with BMI.

Conclusions: Malnutrition is associated with a significant modulation of glycemic, hormonal and cytokine parameters in T2DM. Hence, the biochemical and immunological profiles of T2DM is significantly influenced by BMI.

Keywords: Adipocytokines; Cytokines; Malnutrition; Pancreatic hormones; Type 2 diabetes mellitus.


Conflict of interest statement

The authors declare that they have no competing interests.

Figures

Fig. 1
Fig. 1
Higher circulating levels of glycemic parameters, pancreatic hormones and leptin in LBMI individuals with T2DM. a Plasma levels of glycated haemoglobin (HbA1c), random blood glucose (RBG), insulin and glucagon in LBMI (n = 44) and NBMI (n = 44) individuals with T2DM. b Plasma levels of adiponectin, adipsin, resistin, leptin and visfatin in LBMI (n = 44) and NBMI (n = 44) individuals with T2DM. Each dot represent a single participant and the bar indicating the geometric mean (GM). Mann– Whitney U-test with Holms correction for multiple comparisons were done by p-values are multiplied by the number of comparisons
Fig. 2
Fig. 2
Lower circulating levels of Type 1, Type 17, Type 2 and regulatory cytokines in LBMI individuals with T2DM. a Plasma levels of Type 1 (IFNγ, TNFα and IL-2) and Type 17 (IL-17A, IL-17F and IL-22) cytokines in LBMI (n = 44) and NBMI (n = 44) participants with T2DM. b Plasma levels of Type 2 (IL-4, IL-5 and IL-13) and regulatory (IL-10 and TGF-β) cytokines in LBMI (n = 44) and NBMI (n = 44) participants with T2DM. Each dot represent a single participant and the bar indicating the geometric mean (GM). Mann– Whitney U-test with Holms correction for multiple comparisons were done by p-values are multiplied by the number of comparisons
Fig. 3
Fig. 3
Lower circulating levels of other pro-inflammatory cytokines in LBMI individuals with T2DM. a Plasma levels of other pro-inflammatory (G-CSF, GM-CSF, MCP-1, MIP-1β, IL-6, IL-7, IL-8, IL-12p70 and IL-1β) cytokines in LBMI (n = 44) and NBMI (n = 44) participants with T2DM. Each dot represent a single participant and the bar indicating the geometric mean (GM). Mann– Whitney U-test with Holms correction for multiple comparisons were done by p-values are multiplied by the number of comparisons
Fig. 4
Fig. 4
Positive and negative relationship between pancreatic hormones, and cytokine levels and BMI indices in T2DM individuals. The relationship between the (a) Plasma levels of glycated haemoglobin (HbA1c), random blood glucose (RBG), insulin and glucagon and BMI indices were examined in all LTBI (n = 88) participants. b Plasma levels of Type 1 (IFNγ, TNFα and IL-2), Type 17 (IL-17A, IL-17F and IL-22), Type 2 (IL-4, IL-5 and IL-13), regulatory (IL-10 and TGF-β) cytokines and pro-inflammatory (G-CSF, GM-CSF, MCP-1, MIP-1β, IL-6, IL-7, IL-8, IL-12p70 and IL-1β) cytokines and BMI indices were examined in all LTBI (n = 88) participants. The data are represented correlation rank matrices with r values being denoted by horizontal bars. p and r values were calculated using the Spearman rank correlation test at 95% confidence intervals using JMP software
Fig. 5
Fig. 5
Principle component Analysis (PCA) depicting circulating levels of pancreatic hormones and cytokines in LBMI and NBMI individuals. Principal component analysis (PCA) was done to exhibit the dissemination of data from the mixture of two groups LBMI (blue circles) and NBMI (red circles). The PCA indicates the two principal components of variation. a PCA analysis was done with pancreatic hormone and adipocytokine between LBMI and NBMI participants with T2DM. b PCA analysis of cytokines between LBMI and NBMI participants

References

    1. IDF. IDF Diabetes Atlas. 5th ed; 2012. update. wwweatlasidforg/diabetesatlas/5e/update2012 2012. Accessed 5 Oct 2019.
    1. Gujral UP, Weber MB, Staimez LR, Narayan KMV. Diabetes among non-overweight individuals: an emerging public health challenge. Curr Diab Rep. 2018;18(8):60. doi: 10.1007/s11892-018-1017-1. - DOI - PubMed
    1. Jung JY, Park SK, Oh CM, Ryoo JH, Choi JM, Choi YJ. The risk of type 2 diabetes mellitus according to the categories of body mass index: the Korean genome and epidemiology study (KoGES) Acta Diabetol. 2018;55(5):479–484. doi: 10.1007/s00592-018-1112-4. - DOI - PubMed
    1. Gujral UP, Mohan V, Pradeepa R, Deepa M, Anjana RM, Narayan KM. Ethnic differences in the prevalence of diabetes in underweight and normal weight individuals: the CARRS and NHANES studies. Diabetes Res Clin Pract. 2018;146:34–40. doi: 10.1016/j.diabres.2018.09.011. - DOI - PMC - PubMed
    1. Gujral UP, Pradeepa R, Weber MB, Narayan KM, Mohan V. Type 2 diabetes in south Asians: similarities and differences with white Caucasian and other populations. Ann N Y Acad Sci. 2013;1281:51–63. doi: 10.1111/j.1749-6632.2012.06838.x. - DOI - PMC - PubMed

MeSH terms