. 2020 Nov 12;17(1):340.
doi: 10.1186/s12974-020-02003-z.

Microglial responses to peripheral type 1 interferon

Affiliations

Microglial responses to peripheral type 1 interferon

Ernest Aw et al. J Neuroinflammation. .

Abstract

Background: Interferon α (IFNα) is a cytokine whose production is increased endogenously in response to viral infection and in autoimmune diseases such as systemic lupus erythematosus (SLE). An elevated IFNα signature has been associated with clinically observed neuro-behavioural deficits such as mild cognitive impairment, fatigue, depression and psychosis in these diseases. However, the mechanisms underlying these neuropsychiatric symptoms remain largely unknown, and it is as yet unclear how IFNα signalling might influence central nervous system (CNS) function. Aberrant microglia-mediated synaptic pruning and function has recently been implicated in several neurodegenerative and neuropsychiatric diseases, but whether and how IFNα modulates these functions are not well defined.

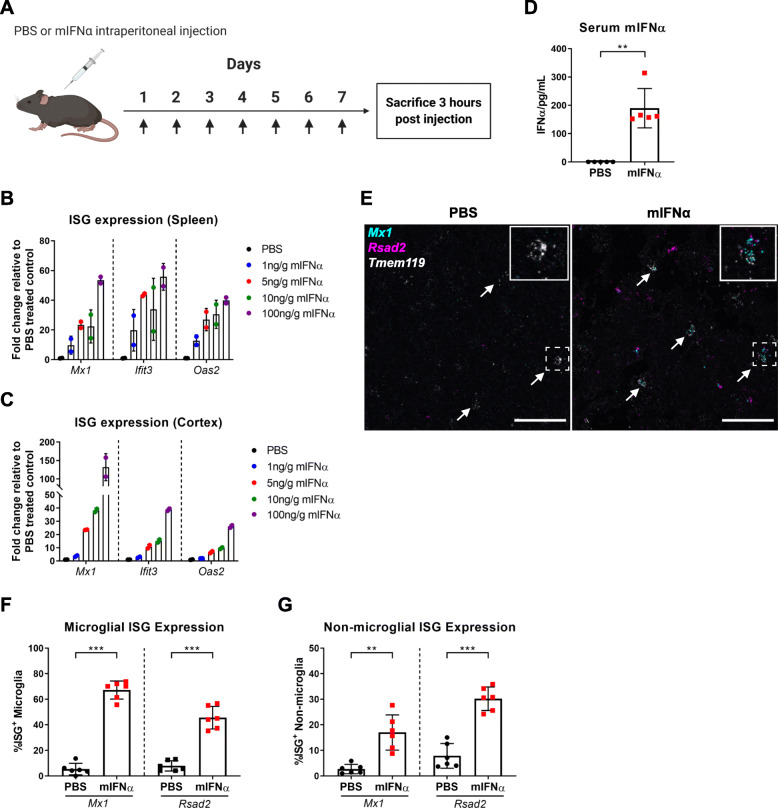
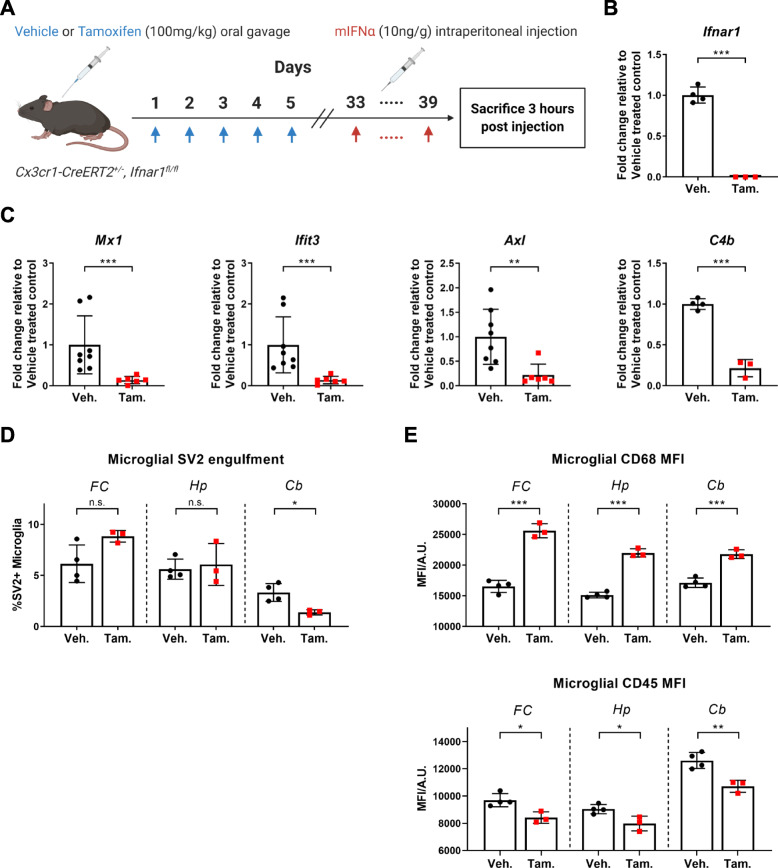
Methods: Using a model of peripheral IFNα administration, we investigated gene expression changes due to IFNAR signalling in microglia. Bulk RNA sequencing on sorted microglia from wild type and microglia-specific Ifnar1 conditional knockout mice was performed to evaluate IFNα and IFNAR signalling-dependent changes in gene expression. Furthermore, the effects of IFNα on microglia morphology and synapse engulfment were assessed, via immunohistochemistry and flow cytometry.

Results: We found that IFNα exposure through the periphery induces a unique gene signature in microglia that includes the expected upregulation of multiple interferon-stimulated genes (ISGs), as well as the complement component C4b. We additionally characterized several IFNα-dependent changes in microglial phenotype, including expression of CD45 and CD68, cellular morphology and presynaptic engulfment, that reveal subtle brain region-specific differences. Finally, by specifically knocking down expression of IFNAR1 on microglia, we show that these changes are largely attributable to direct IFNAR signalling on microglia and not from indirect signalling effects through other CNS parenchymal cell types which are capable of IFNα-IFNAR signal transduction.

Conclusions: Peripheral IFNα induces unique genetic and phenotypic changes in microglia that are largely dependent on direct signalling through microglial IFNAR. The IFNα-induced upregulation of C4b could play important roles in the context of aberrant synaptic pruning in neuropsychiatric disease.

Keywords: Complement; Interferon alpha (IFNα); Interferon-stimulated gene (ISG); Microglia; Neuropsychiatric; Synapse engulfment.


Conflict of interest statement

The authors declare that they have no competing interests.

Figures

Fig. 1
Fig. 1
Induction of IFNAR signalling within the brain parenchyma with peripheral mIFNα administration. a Schematic of treatment protocol. Mice (N = 2) were injected daily with varying doses of mIFNα for 7 days and sacrificed 3 h post final injection. Tissue samples were harvested following perfusion with ice-cold PBS to remove contamination from peripheral blood cells. b Interferon-stimulated gene (ISG) expression was assayed in the spleen using ddPCR, showing a dose-dependent effect of mIFNα on ISG expression. c ISG expression was similarly assayed in the cortex, showing a dose-dependent effect on ISG expression. d Serum mIFNα from PBS or mIFNα injected mice (N = 5 per group) was assayed using ELISA. Serum was collected 3 h post final injection. e Representative RNAscope images showing enriched ISG (Mx1, Rsad2) transcript abundance in Tmem119-positive microglia (white arrows) in mIFNα-treated mice. Inset in each image shows an example of ISG negative or positive microglia. f, g Quantitative analysis of RNAscope data showing significant ISG enrichment in both microglia (Tmem119 positive) and non-microglia (Tmem119 negative) cell types with mIFNα exposure (N = 6 per condition). Scale bar = 50 μm. **p < 0.01; ***p < 0.001; Student’s t test or Mann-Whitney U test, assessed by normality of data distribution
Fig. 2
Fig. 2
Transcriptional profiling of mIFNα exposed microglia. a Volcano plot showing highlights of differentially expressed (DE) genes from bulk RNA sequencing of sorted cortical microglia. Interferon-stimulated genes were identified based on querying the Interferome 2.0 database [43] with the DE gene list. q, Benjamini-Hochberg adjusted p value. Dotted lines demarcate q = 0.01 and fold change = 2.5. b A selection of differential gene ontology pathways identified using gProfiler2 [31] enriched in mIFNα exposed microglia. c Validation of several interferon-stimulated genes (ISGs) by ddPCR on sorted cortical microglia from an independently treated cohort of mice. N = 6 for all data shown. **p < 0.01; ***p < 0.001; Student’s t test
Fig. 3
Fig. 3
Microglial IFNAR signalling results in unique changes in classical activation parameters. a Selectively enhanced microglial synapse engulfment in the cerebellum with mIFNα exposure. b mIFNα-induced changes in microglial surface expression of CD68 (decrease) and CD45 (increase) across different brain regions. c Representative images of microglia from the hippocampus from both treatment groups. Scale bar = 50 μm. d Analysis of morphological changes in microglia with mIFNα exposure, showing brain region-specific differences. N = 6 for all data shown. n.s., p > 0.05; *p < 0.05; **p < 0.01; ***p < 0.001; Student’s t test or Mann-Whitney U test, assessed by normality of data distribution
Fig. 4
Fig. 4
Knockdown of microglial IFNAR signalling attenuates phenotypic and genetic changes in response to peripheral mIFNα administration. a Schematic of treatment protocol. Cx3cr1-CreERT2+/−, Ifnar1fl/fl mice were orally gavaged with either vehicle or tamoxifen. Four weeks post gavage, mice were either sacrificed (for qPCR validation of Ifnar1 knockdown) or treated with mIFNα daily for 7 days and sacrificed. b Cortical microglia from Cx3cr1-CreERT2+/−, Ifnar1fl/fl mice were sorted by FACS and analysed for gene expression of Ifnar1 by qPCR. Ifnar1 qPCR primers were designed to span the floxed region of Exon 10. The tamoxifen-treated (N = 3) CreERT2-positive group showed significant knockdown of Ifnar1 expression compared to the vehicle-treated group (N = 4). c Sorted cortical microglia show significantly decreased ISG expression by ddPCR in the tamoxifen treatment group (N = 6) of Cx3cr1-CreERT2+/−, Ifnarfl/fl mice in comparison to the vehicle treatment group (N = 8). C4b expression was also significantly decreased in the tamoxifen treatment group (N = 3) in comparison to the vehicle treatment group (N = 4). d Knockdown of microglial Ifnar1 in the tamoxifen treatment group (N = 3) reverses the observed region-specific changes in synapse engulfment induced by peripheral mIFNα administration in comparison to the vehicle treatment group (N = 4). e Knockdown of microglial Ifnar1 in the tamoxifen treatment group (N = 3) reverses the observed changes in CD45 and CD68 expression induced by peripheral mIFNα administration, with the exception of CD68 expression in the cerebellum in comparison to the vehicle treatment group (N = 4). Veh., Vehicle; Tam., Tamoxifen; n.s., p > 0.05; *p < 0.05; **p < 0.01; ***p < 0.001; Student’s t test or Mann-Whitney U test, assessed by normality of data distribution
Fig. 5
Fig. 5
Transcriptional profiling of Ifnar1 sufficient and deficient microglia exposed to mIFNα. a Volcano plot showing highlights of differentially expressed (DE) genes from bulk RNA sequencing of sorted cortical microglia, comparing vehicle-treated control (N = 6) and tamoxifen-treated knockdown (N = 6) groups from Cx3cr1-CreERT2+/−, Ifnar1fl/fl mice. Interferon-stimulated genes were identified based on querying the Interferome 2.0 database [43] with the DE gene list. q, Benjamini-Hochberg adjusted p value. b Overlap of independently identified > 1.5-fold change DE genes from both sequencing libraries, identified using the glmTreat function in the EdgeR package [58]. Venn diagram sizes are proportional to the numerical values in each category. c Overlap of independently identified gene ontology pathways. Venn diagram sizes are proportional to the numerical values in each category. d A selection of differential gene ontology pathways identified using gProfiler2 [31] enriched in mIFNα exposed Ifnar1 sufficient and deficient microglia

References

    1. Crow MK, Type I. Interferon in the pathogenesis of lupus. J Immunol. 2014;192:5459–5468. doi: 10.4049/jimmunol.1002795. - DOI - PMC - PubMed
    1. Crow YJ, Manel N. Aicardi-Goutières syndrome and the type I interferonopathies. Nat Rev Immunol. 2015;15:429–440. doi: 10.1038/nri3850. - DOI - PubMed
    1. Schreiber G, Piehler J. The molecular basis for functional plasticity in type I interferon signaling. Trends Immunol. 2015;36:139–149. doi: 10.1016/j.it.2015.01.002. - DOI - PubMed
    1. van Boxel-Dezaire AHH, Rani MRS, Stark GR. Complex modulation of cell type-specific signaling in response to type I interferons. Immunity. 2006;25:361–372. doi: 10.1016/j.immuni.2006.08.014. - DOI - PubMed
    1. Valentine AD, Meyers CA. Neurobehavioral effects of interferon therapy. Curr Psychiatry Rep. 2005;7:391–395. doi: 10.1007/s11920-005-0042-3. - DOI - PubMed

Substances