. 2020 Nov 13:148:e282.
doi: 10.1017/S0950268820002782.

Chasing the ghost of infection past: identifying thresholds of change during the COVID-19 infection in Spain

Affiliations

Chasing the ghost of infection past: identifying thresholds of change during the COVID-19 infection in Spain

Luis Santamaría et al. Epidemiol Infect. .

Abstract

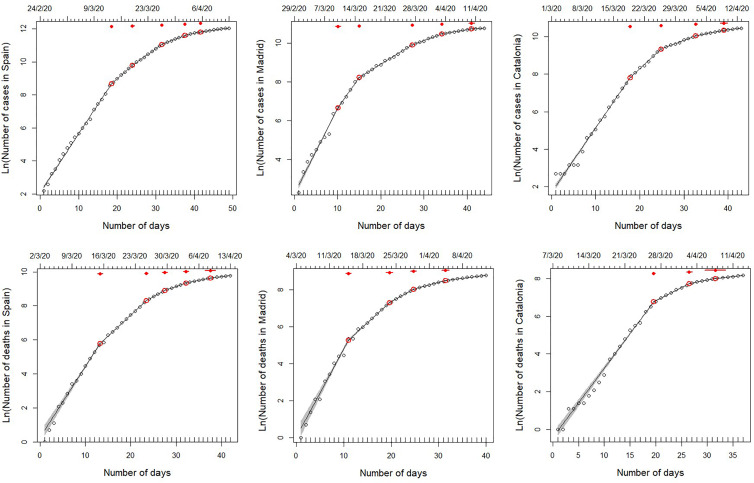
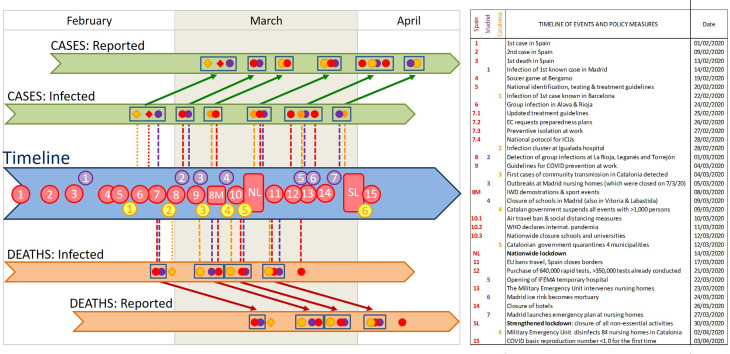
One of the largest nationwide bursts of the first COVID-19 outbreak occurred in Spain, where infection expanded in densely populated areas through March 2020. We analyse the cumulative growth curves of reported cases and deaths in all Spain and two highly populated regions, Madrid and Catalonia, identifying changes and sudden shifts in their exponential growth rate through segmented Poisson regressions. We associate these breakpoints with a timeline of key events and containment measures, and data on policy stringency and citizen mobility. Results were largely consistent for infections and deaths in all territories, showing four major shifts involving 19-71% reductions in growth rates originating from infections before 3 March and on 5-8, 10-12 and 14-18 March, but no identifiable effect of the strengthened lockdown of 29-30 March. Changes in stringency and mobility were only associated to the latter two shifts, evidencing an early deceleration in COVID-19 spread associated to personal hygiene and social distancing recommendations, followed by a stronger decrease when lockdown was enforced, leading to the contention of the outbreak by mid-April. This highlights the importance of combining public health communication strategies and hard confinement measures to contain epidemics.

Keywords: Breakpoint regression; COVID-19; Catalonia; Madrid; fatalities; growth curve; infection; social distancing effectiveness.


Figures

Fig. 1.
Fig. 1.
Segmented regressions fitted on the total number of cases detected in Spain and the two autonomous regions hosting its two largest cities (Madrid and Catalonia) from 25 February 2020 to 13 April 2020. Within this period, data series varies among variables and regions, since they start on the first day with >10 cases or >1 death (see upper x-axis for initial date). Lines show the best fit, as specified in Table 1 (see also Tables S2–S3). Red dots indicate breaking points of the best fit, with 95% confidence intervals (red lines). Note that, although the segmented analyses were performed on non-transformed data, we use a log-transformed y-axis for clarity.
Fig. 2.
Fig. 2.
Timeline of the key events for the spread of COVID-19 in Spain, the increased awareness of the Spanish population, and Control Measures taken by the government. Coloured dots indicate the breaking points identified in our segmented analyses for the whole of Spain (red) and specifically for Madrid (purple) and Catalonia (yellow). Diamonds indicate sudden increases in the intercept, identified as breaking points by the strucchange analysis. Clusters of breaking points are identified with rectangles. The position of these breaking points in the 'reported' sections indicates the date detected in our analyses of the temporal COVID-19 growth curves, and those in the 'infected'sections indicate the estimated date of infection. Numbers in the timeline indicate the key events listed in the table. Vertical lines indicate potential synchronies between events in the timeline and estimated changes in the growth rates (i.e. breaking points) of both cases and deaths (above and below the timeline, respectively). Diagonal arrows link the estimated infection dates and the detection dates of identified breaking points, for both cases and deaths. Note that the combination of vertical and diagonal lines indicates the dates at which changes in infection dynamics could be perceived, for the first time, as breaking points in the numbers of cases or deaths. WMC stands for World Mobile Congress, and EC for European Commission. See Supplementary Table S1 for a detailed account of the timeline, and Supplementary Figure S1 for an account including the variation in the growth rate (slope of the ln-transformed data) at each breaking point.

References

    1. Dong E, Du H and Gardner L (2020) An interactive web-based dashboard to track COVID-19 in real time. The Lancet Infectious Diseases 20, 533–534, Map and data available at https://coronavirus.jhu.edu/map.html. - PMC - PubMed
    1. Chan-Yeung M and Xu R-H (2003) SARS: epidemiology. Respirology (Carlton, Vic.) 8, S9–S14. - PMC - PubMed
    1. Linton NM et al. (2020) Incubation period and other epidemiological characteristics of 2019 novel Coronavirus infections with right truncation: a statistical analysis of publicly available case data. Journal of Clinical Medicine 9, 538. - PMC - PubMed
    1. Lai C-C et al. (2020) Severe acute respiratory syndrome coronavirus 2 (SARS-CoV-2) and coronavirus disease-2019 (COVID-19): the epidemic and the challenges. International Journal of Antimicrobial Agents 55, 105924. - PMC - PubMed
    1. Hadfield J et al. (2018) Nextstrain: real-time tracking of pathogen evolution. Bioinformatics (Oxford, England) 34, 4121–4123. - PMC - PubMed

LinkOut - more resources