Reduction in healthcare services during the COVID-19 pandemic in China
- PMID: 33184065
- PMCID: PMC7662138
- DOI: 10.1136/bmjgh-2020-003421
Reduction in healthcare services during the COVID-19 pandemic in China
Abstract
Introduction: The COVID-19 pandemic caused a healthcare crisis in China and continues to wreak havoc across the world. This paper evaluated COVID-19's impact on national and regional healthcare service utilisation and expenditure in China.
Methods: Using a big data approach, we collected data from 300 million bank card transactions to measure individual healthcare expenditure and utilisation in mainland China. Since the outbreak coincided with the 2020 Chinese Spring Festival holiday, a difference-in-difference (DID) method was employed to compare changes in healthcare utilisation before, during and after the Spring Festival in 2020 and 2019. We also tracked healthcare utilisation before, during and after the outbreak.
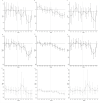
Results: Healthcare utilisation declined overall, especially during the post-festival period in 2020. Total healthcare expenditure and utilisation declined by 37.8% and 40.8%, respectively, while per capita expenditure increased by 3.3%. In a subgroup analysis, we found that the outbreak had a greater impact on healthcare utilisation in cities at higher risk of COVID-19, with stricter lockdown measures and those located in the western region. The DID results suggest that, compared with low-risk cities, the pandemic induced a 14.8%, 26.4% and 27.5% reduction in total healthcare expenditure in medium-risk and high-risk cities, and in cities located in Hubei province during the post-festival period in 2020 relative to 2019, an 8.6%, 15.9% and 24.4% reduction in utilisation services; and a 7.3% and 18.4% reduction in per capita expenditure in medium-risk and high-risk cities, respectively. By the last week of April 2020, as the outbreak came under control, healthcare utilisation gradually recovered, but only to 79.9%-89.3% of its pre-outbreak levels.
Conclusion: The COVID-19 pandemic had a significantly negative effect on healthcare utilisation in China, evident by a dramatic decline in healthcare expenditure. While the utilisation level has gradually increased post-outbreak, it has yet to return to normal levels.
Keywords: diseases; disorders; health economics; health services research; infections; injuries; other study design; public health.
© Author(s) (or their employer(s)) 2020. Re-use permitted under CC BY-NC. No commercial re-use. See rights and permissions. Published by BMJ.
Conflict of interest statement
Competing interests: None declared.
Figures


Comment in
-
Impact of the COVID-19 Pandemic on Outpatient Service in Primary Healthcare Institutions: An Inspiration From Yinchuan of China.Int J Health Policy Manag. 2022 Sep 1;11(9):1926-1933. doi: 10.34172/ijhpm.2021.119. Epub 2021 Aug 31. Int J Health Policy Manag. 2022. PMID: 34664493 Free PMC article.
References
-
- WHO Coronavirus disease (COVID-19) pandemic, 2020. Available: https://www.who.int/emergencies/diseases/novel-coronavirus-2019 [Accessed 2 Sep 2020].
-
- JHU COVID-19 dashboard by the center for systems science and engineering (CSSE) at Johns Hopkins University (JHU). Available: https://coronavirus.jhu.edu/map.html [Accessed 23 May 2020].
-
- Amos O. The cancer patient trapped by coronavirus: what happened next? BBC News. Available: https://www.bbc.com/news/world-asia-51748164 [Accessed 7 Mar 2020].
MeSH terms
LinkOut - more resources
Full Text Sources
Miscellaneous
