. 2020 Nov 12;9(11):bio057174.
doi: 10.1242/bio.057174.

Efficient and crucial quality control of HAP1 cell ploidy status

Affiliations

Efficient and crucial quality control of HAP1 cell ploidy status

Tobias B Beigl et al. Biol Open. .

Abstract

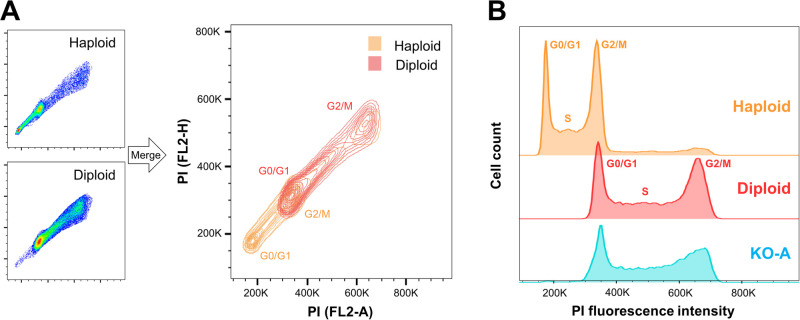
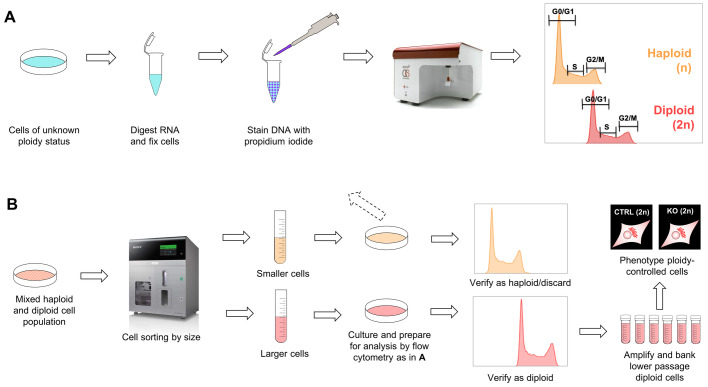
The near-haploid human cell line HAP1 recently became a popular subject for CRISPR/Cas9 editing, since only one allele requires modification. Through the gene-editing service at Horizon Discovery, there are at present more than 7500 edited cell lines available and the number continuously increases. The haploid nature of HAP1 is unstable as cultures become diploid with time. Here, we demonstrated some fundamental differences between haploid and diploid HAP1 cells, hence underlining the need for taking control over ploidy status in HAP1 cultures prior to phenotyping. Consequently, we optimized a procedure to determine the ploidy of HAP1 by flow cytometry in order to obtain diploid cultures and avoid ploidy status as an interfering variable in experiments. Furthermore, in order to facilitate this quality control, we validated a size-based cell sorting procedure to obtain the diploid culture more rapidly. Hence, we provide here two streamlined protocols for quality controlling the ploidy of HAP1 cells and document their validity and necessity.This article has an associated First Person interview with the co-first authors of the paper.

Keywords: CRISPR/Cas9; Cas9 enzyme; Cell culture quality control; Cell phenotype analyses; Gene editing; HAP1; Microscopy genetic disease cell model; Near-haploid human cell line; clustered palindromic repeats.


Conflict of interest statement

Competing interestsThe authors declare no competing or financial interests.

Figures

Fig. 1.
Fig. 1.
Haploid and diploid HAP1 cells can be distinguished based on PI stain in a flow cytometer. (A) Ploidy-verified reference cells (HAP1 C631 haploid and diploid) were fixed, DNA-stained with PI and analyzed on a BD Accuri C6. Linear plots of fluorescence intensity height (FL2-H) against total cell fluorescence (FL2-A) illustrate the difference in DNA-quantity between haploid (orange) and diploid (red) HAP1 cells. (B) Example result of ploidy test showing flow data for the cell line ‘Gene specific KO-A’ at passage 28, referenced to ploidy-verified control lines. Histograms show number of cells against intensity of the DNA. Fluorescence intensity is shown in linear scale (both A and B).
Fig. 2.
Fig. 2.
Confocal imaging of haploid and diploid HAP1 cells showed large ploidy-dependent differences. Ploidy-verified haploid and diploid HAP1 cells subjected to immunocytochemistry and imaged with a confocal microscope. (A) Overview of cell culture as observed with 40× objective (left) and 100×objective (right). Nuclei were visualized with DAPI and F-actin with fluorescent phalloidin. (B) A closer look at structures in single cells (3×optical zoom, 100×objective). Nuclei and F-actin were stained as in A. In addition, mitochondria were visualized with antibody towards Cox IV and microtubules with antibody towards β-tubulin.
Fig. 3.
Fig. 3.
Live-cell phase holographic imaging analysis of haploid and diploid HAP1 cells show basic and specific ploidy-dependent differences. Ploidy-verified low-passage HAP1 haploids (2015 batch of C631, 1h) and their higher-passage diploid versions (1d) were seeded on laminin and monitored in a HoloMonitor M4 for 72 h with image acquisition every 15 min (A–E). (A) 2D representation of 3D holographic images at selected time points. The color bar indicates optical thickness or cell height information (z-values) for these 2D projected 3D images ranging from 0 µm (black) to 7.5 µm (yellow). Scale bar, 100 µm. (B) Morphological cell properties measured based on holographic images at 24 h (cell volume) or 48 h (cell area and optical thickness) post seeding. (C) Cell growth based on confluency measure of cell-covered area, relative to t=0. (D) Migration speed of random single-cell migration in culture measured from 24 to 48 h post seeding from two independent wells of haploid 1h (n=38) and diploid 1d (n=40) HAP1 cells. (E) Single-cell trajectory rose plots of the same cells as in D. For all bar charts, * P<0.05 and ** P<0.005 as determined with t-test (unpaired, two-tailed with Welch's correction) and error bars represent s.e.m. (only upper part shown).
Fig. 4.
Fig. 4.
Haploid and diploid HAP1 cells can be separated based on size in a cell sorter. HAP1 parental control cell line (C631, 2015 batch) was cultured until passage 13 (P13), at which point small and large cells were divided into separate cultures on a Sony SH800 cell sorter (A,B). (A) Gating strategy for sorting of small (putative haploid) and large (putative diploid) cells. (B) Outputs from the size-based cell sorting were analyzed for ploidy determination by flow cytometry on fixed PI-stained cells 1 week after sorting (left) and five passages later (right). (C,D) HAP1 control (CTRL) and its diploid version obtained by size-based cell sorting were seeded for live-cell holographic imaging followed by single-cell migration analysis as in Fig. 3D,E. Two different original batches of HAP1 CTRL (C631) were used (C, 2015 batch; and D, 2019 batch) and these were individually subjected to the size-based cell sorting strategy to isolate diploid cells. Tracking data from two independent experimental setups each analyzing all four cell lines from three different wells (six in total) are shown merged. P<0.00005 (C) and P<0.0005 (D) was determined with t-test (unpaired, two-tailed with Welch's correction), x- and y-axis scales are identical for all four rose plots in C and D.
Fig. 5.
Fig. 5.
Schematic overview of workflow to obtain diploid cultures of HAP1. (A) Method of distinguishing haploid and diploid HAP1 cells by means of flow cytometry on PI-stained cells. (B) Method to fast-forward to diploid cultures by means of size-based cell sorting. The method in B can also be used to select for haploidy.

References

    1. Aksnes H., Marie M., Arnesen T. and Drazic A. (2018). Actin polymerization and cell motility are affected by NAA80-mediated posttranslational N-terminal acetylation of actin. Commun. Integr. Biol. 11, e1526572 10.1080/19420889.2018.1526572 - DOI - PMC - PubMed
    1. Andersson B. S., Collins V. P., Kurzrock R., Larkin D. W., Childs C., Ost A., Cork A., Trujillo J. M., Freireich E. J., Siciliano M. J. et al. (1995). KBM-7, a human myeloid leukemia cell line with double Philadelphia chromosomes lacking normal c-ABL and BCR transcripts. Leukemia 9, 2100-2108. - PubMed
    1. Beigl T. B., Hellesvik M., Saraste J., Arnesen T. and Aksnes H. (2020). N-terminal acetylation of actin by NAA80 is essential for structural integrity of the golgi apparatus. Exp. Cell Res. 390, 111961 10.1016/j.yexcr.2020.111961 - DOI - PMC - PubMed
    1. Capmany A., Latgé B. and Schauer K. (2019a). Analysis of organelle positioning using patterned microdevices. Curr. Protoc. Cell Biol. 82, e77 10.1002/cpcb.77 - DOI - PubMed
    1. Capmany A., Yoshimura A., Kerdous R., Caorsi V., Lescure A., Del Nery E., Coudrier E., Goud B. and Schauer K. (2019b). MYO1C stabilizes actin and facilitates the arrival of transport carriers at the Golgi complex. J. Cell Sci. 132, jcs225029 10.1242/jcs.225029 - DOI - PubMed

Publication types