Comment
. 2021 Feb 1;81(3):732-746.
doi: 10.1158/0008-5472.CAN-20-1200. Epub 2020 Nov 12.

Steroid Hormone Receptor and Infiltrating Immune Cell Status Reveals Therapeutic Vulnerabilities of ESR1-Mutant Breast Cancer

Affiliations
Comment

Steroid Hormone Receptor and Infiltrating Immune Cell Status Reveals Therapeutic Vulnerabilities of ESR1-Mutant Breast Cancer

Michelle M Williams et al. Cancer Res. .

Abstract

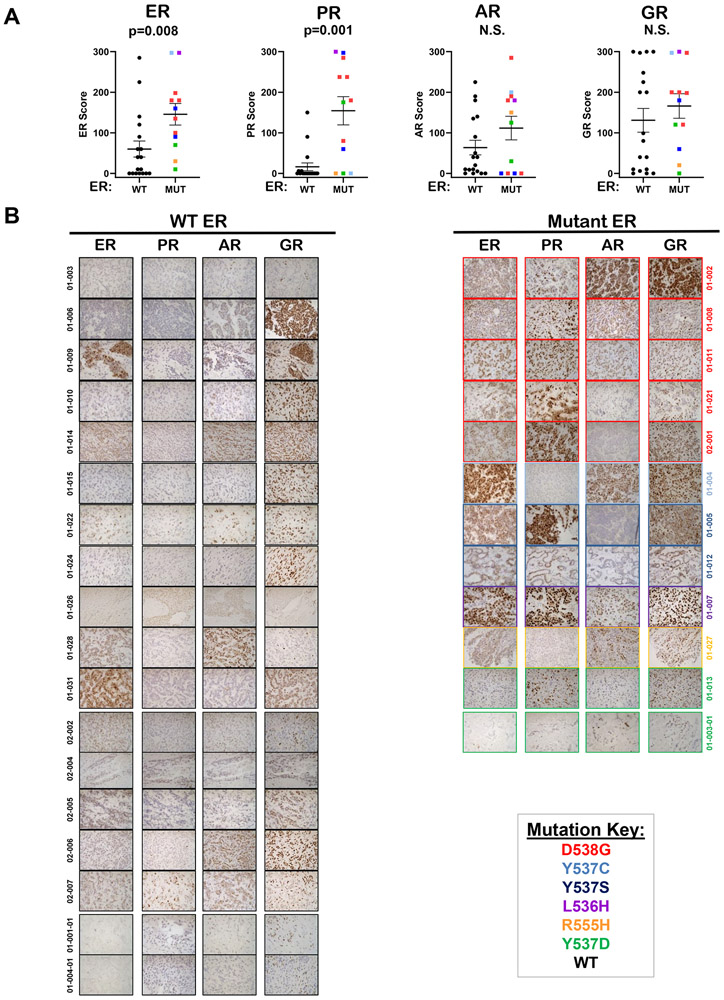
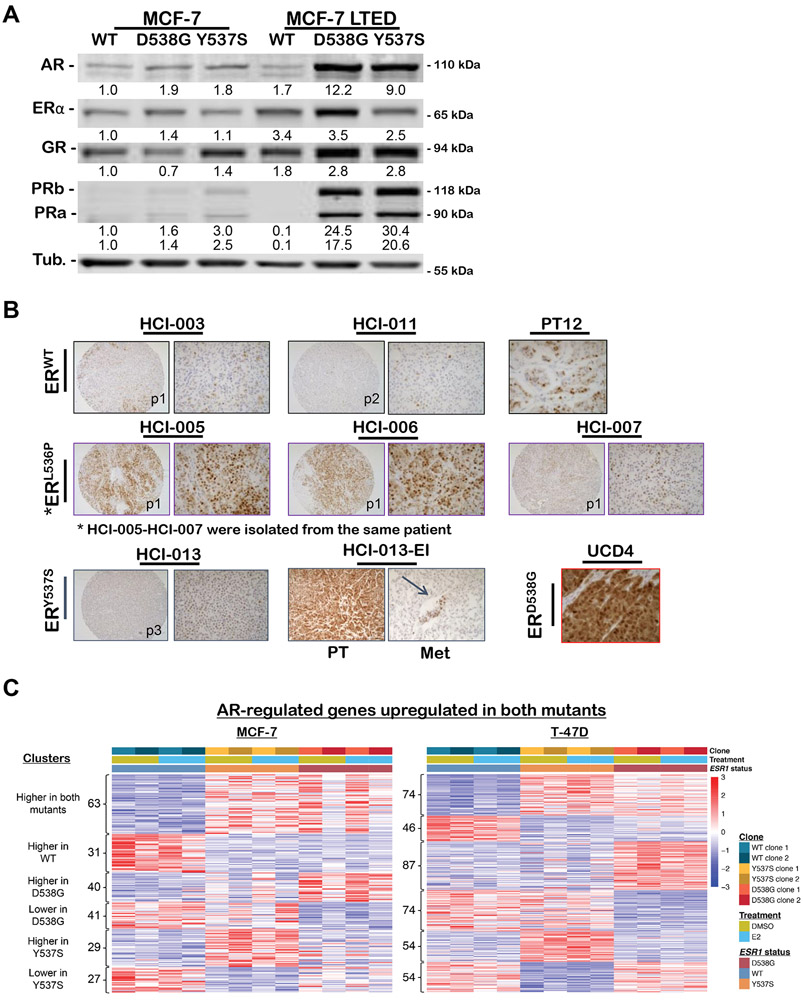
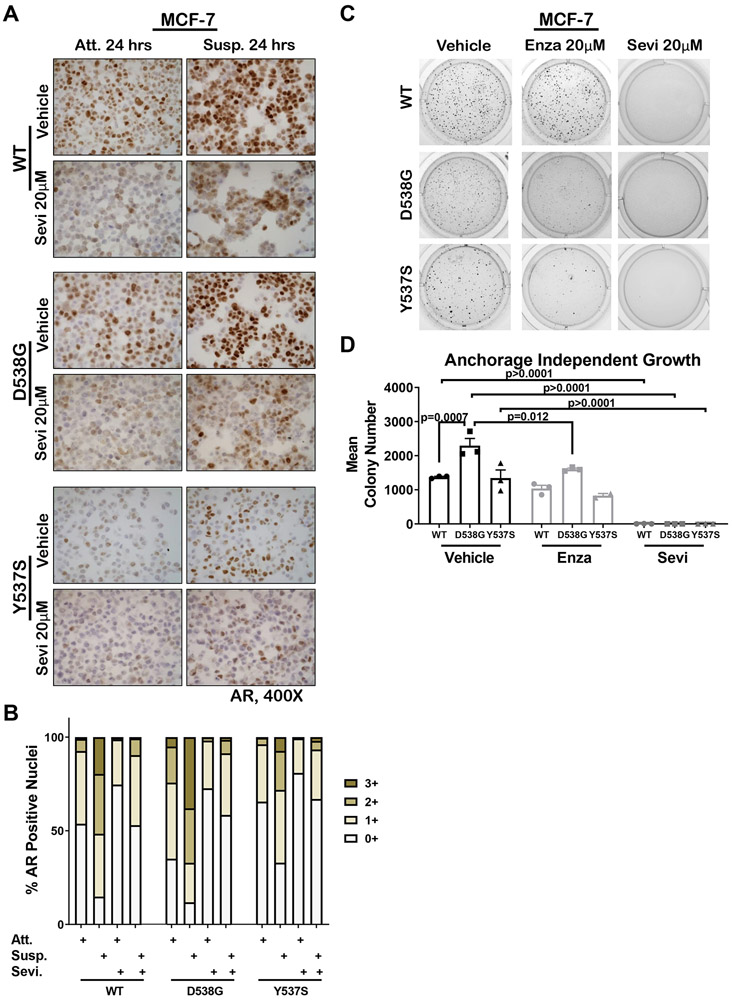
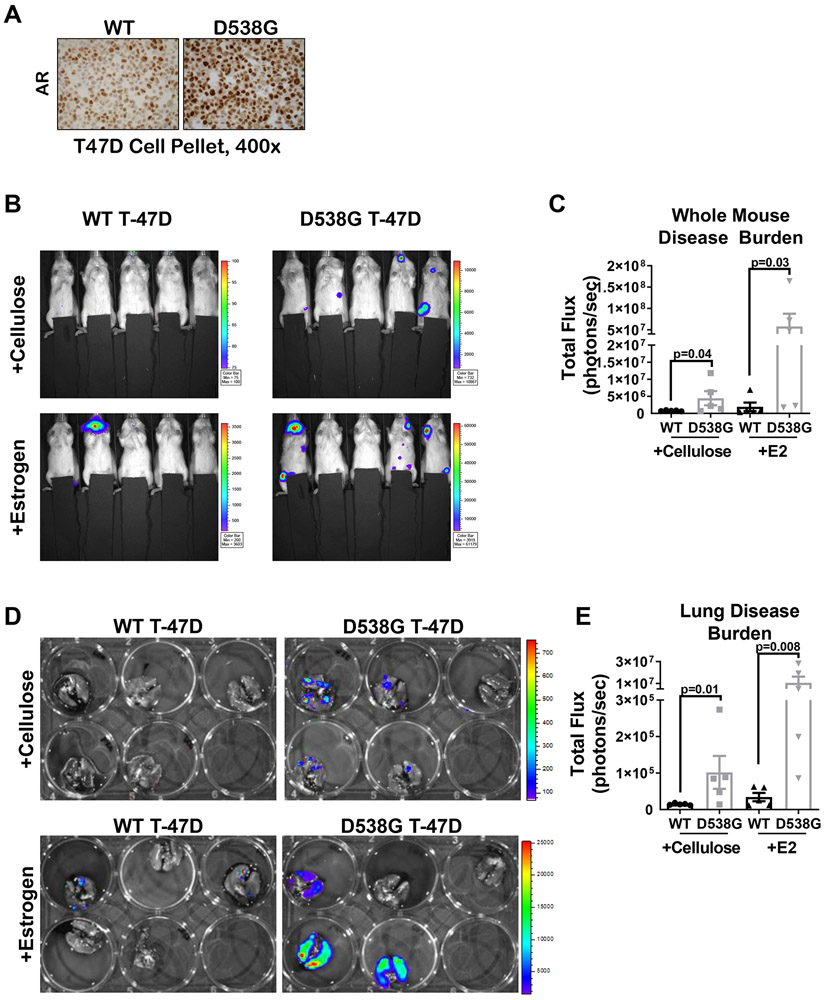
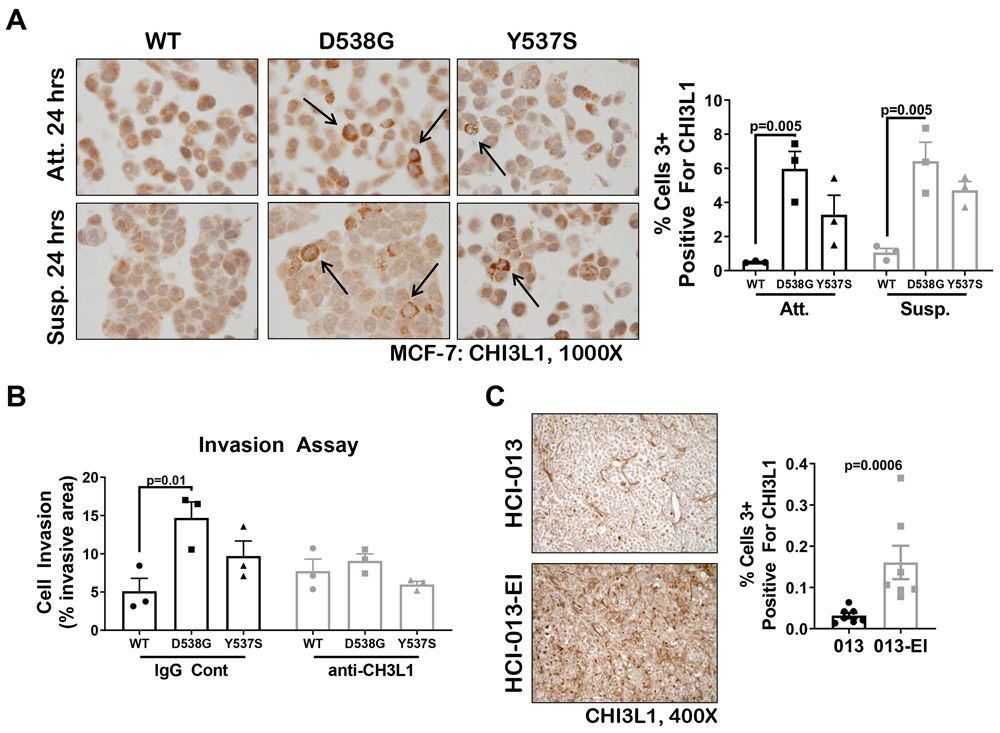
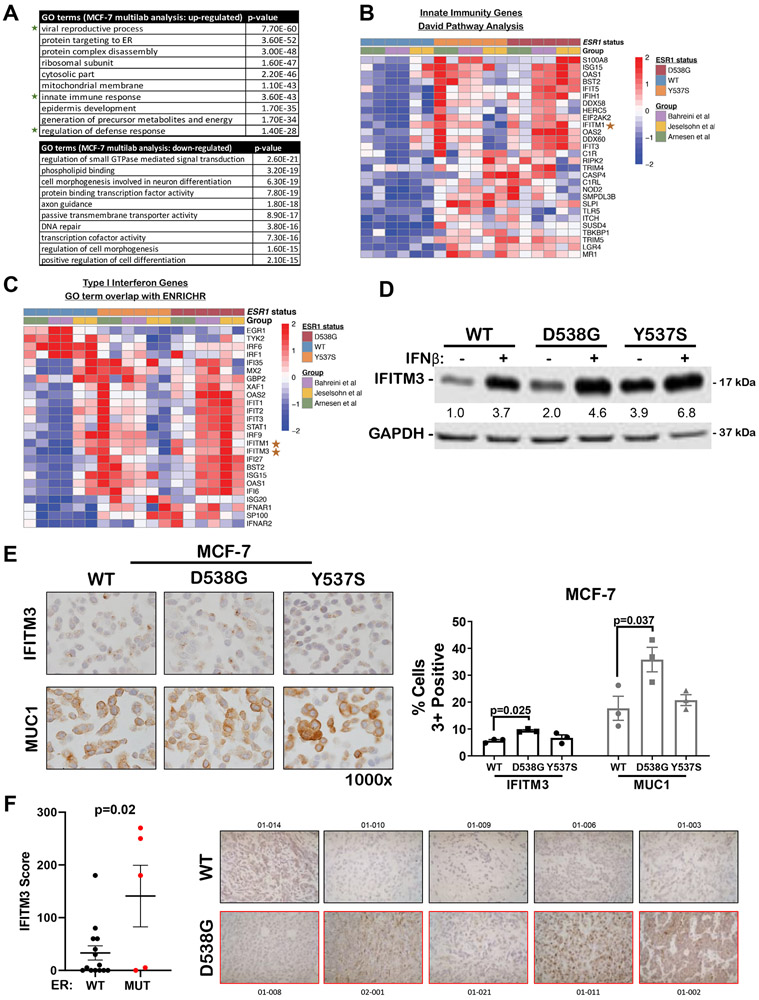
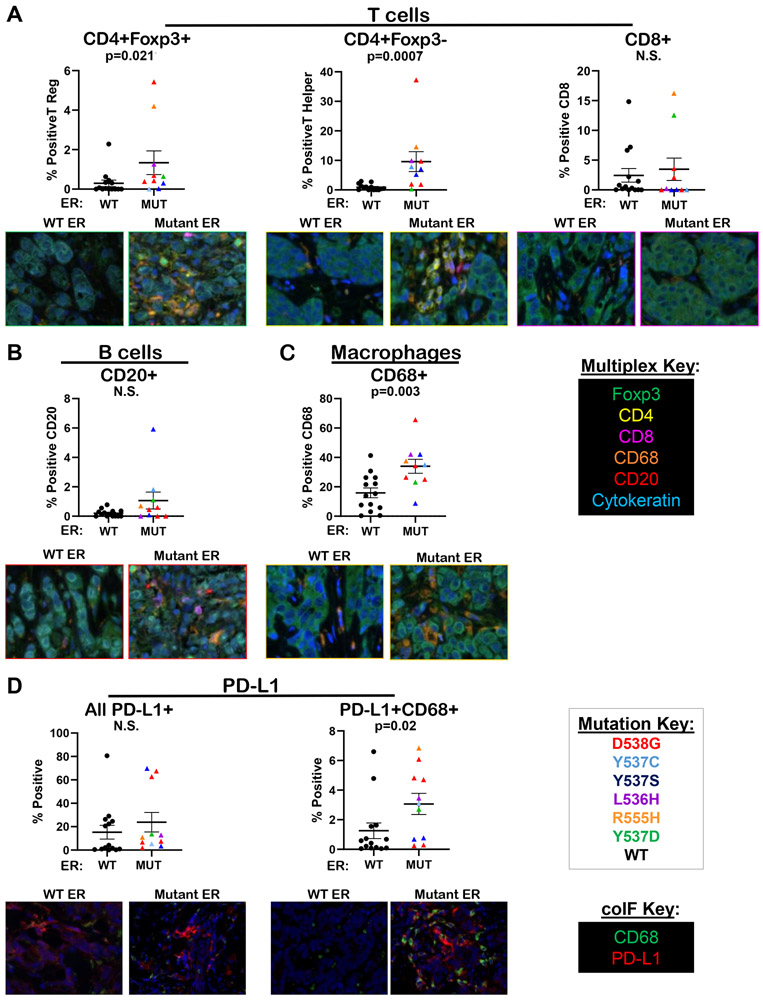
Mutations in ESR1 that confer constitutive estrogen receptor alpha (ER) activity in the absence of ligand are acquired by ≥40% of metastatic breast cancers (MBC) resistant to adjuvant aromatase inhibitor (AI) therapy. To identify targetable vulnerabilities in MBC, we examined steroid hormone receptors and tumor-infiltrating immune cells in metastatic lesions with or without ER mutations. ER and progesterone receptor (PR) were significantly lower in metastases with wild-type (WT) ER compared with those with mutant ER, suggesting that metastases that evade AI therapy by mechanism(s) other than acquiring ER mutations lose dependency on ER and PR. Metastases with mutant ER had significantly higher T regulatory and Th cells, total macrophages, and programmed death ligand-1 (PD-L1)-positive immune-suppressive macrophages than those with WT ER. Breast cancer cells with CRISPR-Cas9-edited ER (D538G, Y537S, or WT) and patient-derived xenografts harboring mutant or WT ER revealed genes and proteins elevated in mutant ER cells, including androgen receptor (AR), chitinase-3-like protein 1 (CHI3L1), and IFN-stimulated genes (ISG). Targeting these proteins blunted the selective advantage of ER-mutant tumor cells to survive estrogen deprivation, anchorage independence, and invasion. Thus, patients with mutant ER MBC might respond to standard-of-care fulvestrant or other selective ER degraders when combined with AR or CHI3L1 inhibition, perhaps with the addition of immunotherapy. SIGNIFICANCE: Targetable alterations in MBC, including AR, CHI3L1, and ISG, arise following estrogen-deprivation, and ER-mutant metastases may respond to immunotherapies due to elevated PD-L1+ macrophages.See related article by Arnesen et al., p. 539.


Conflict of interest statement

Disclosure of potential conflicts of interest: none

Figures

Figure 1.
Figure 1.. Steroid hormone receptor expression in biopsies of metastatic breast cancer with wild type or mutant ESR1.
A. Formalin fixed paraffin embedded (FFPE) sections of core needle biopsies (N=18 WT ER, N=12 mutant ER) were stained by IHC for ER, PR, AR, and GR. Depicted are the mean scores (intensity x percent cells staining) ± SEM. Mann-Whitney tests were performed for each receptor stained. B. Representative images for all WT ER metastases (left) and all mutant ER metastases (right) stained for ER, PR, and AR and GR are shown at 400X.
Figure 2.
Figure 2.. AR protein and gene regulation differs in WT versus mutant ER expressing MCF-7 breast cancer cells and patient derived xenografts (PDX), particularly after long-term estrogen deprivation (LTED).
A. Western blot of whole cell lysates from WT, D538G, and Y537S MCF7 cells grown in full serum media (left) or charcoal stripped serum containing media (LTED, right) were probed for AR, ER, GR, PR-A/B, and tubulin. B. ER+ patient-derived xenografts (PDX) tissue microarray from Dr. Alana Welm, Huntsman Cancer Institute (HCI) and ER+ PDX from University of Colorado (UCD) with ESR1 mutation status indicated, were stained for AR by IHC with representative images at 100X (left) and 400X (right). For the estrogen independent version of HCI-013, HCI-013-EI, an image representative of primary tumor (PT) and lung metastasis (Met) are shown. C. Heatmap of known AR regulated genes in MCF7 (left) and T47D (right) depicting relative expression of genes displayed as a Z-score across WT and mutant cells after 5 days of growth in hormone-depleted media followed by treatment with either 10nM E2 or vehicle (DMSO) for 8 hours. Significant overlap was determined using hypergeometric tests with a p-value cut off of <0.05: AR genes vs D538G up-regulated genes = 5.5x10−05; AR genes vs D538G down-regulated genes = 1.0x10−08; AR genes vs Y537S up-regulated genes = 3.2x10−08; AR genes vs Y537S down-regulated genes = 9.3x10⁻¹¹.
Figure 3.
Figure 3.. AR increased in breast cancer cells grown in soft agar and AR inhibition abolished the selective advantage of mutant ER cells for anchorage-independent survival.
A. WT, D538G, and Y537S mutant MCF7 cells were grown in full serum media under attached (Att) or suspension conditions (on poly-HEMA plates, Susp) and treated ± 20μM Seviteronel (Sevi) for 24 hours. Cells were pelleted, FFPE, and AR IHC performed. Representative images are shown at 400x. B. Quantification of A with ImageScope software for percent positive nuclei for staining intensities of 0-3+ for all conditions attached (Att), suspended (Susp), and ± Sevi. C. WT, D538G, and Y537S cells plated in 0.3% agar and treated with 20μM Sevi, 20μM enzalutamide (Enza) or EtOH control and grown for three weeks with bi-weekly media and drug changes. Representative images of anchorage-independent growth are shown. D. Colony number quantified using ImageJ software for assay in C (N=3). Mean ± SEM, One way ANOVA with Tukey’s multiple comparison test is depicted. Two way ANOVA, interaction between cell line and treatment p = 0.003.
Figure 4.
Figure 4.. Breast cancer cells harboring D538G ER mutation thrive at metastatic sites in an experimental metastasis model in estrogen-deprived mice, while WT ER cells do not.
A. WT and D538G ER T47DGFP/Luc cells were stained for AR and representative images shown at 400x. B. The same lines were delivered via tail vein injection into 6 week old ovariectomized NSG mice (N=5/group) with or without E2 or cellulose and six weeks post cell injection, mice were imaged by IVIS. C. Quantification of whole mouse luminescence signal (total flux), mean ± SEM. Raw data are presented with p-values from a Student’s unpaired two-tailed t test conducted on the log transformed data due to heteroscedasticity, one way ANOVA (p=0.006). D. At end of study mice were sacrificed, lungs excised and imaged ex vivo by IVIS. E. Quantification of luminescence in lungs ex vivo mean ± SEM. Raw data are presented with p-values from a Student’s unpaired two-tailed t test conducted on log transformed data due to heteroscedasticity, one way ANOVA (p=0.0003).
Figure 5.
Figure 5.. MCF-7 BC cells with mutant ER express increased CHI3L1 and blocking CHI3L1 decreased mutant ER BC cell invasion.
A. IHC staining for CHI3L1 protein in WT, D538G, and Y537S MCF-7 cells grown in full serum media under attached (Att) or suspension conditions (on poly-HEMA plates, Susp) for 24 hours. Representative images are shown at 1000x (left) and quantification of percent cells strongly positive (3+) for CHI3L1 is shown (right), mean ± SEM, N=3 photos/pellet, One way ANOVA with Tukey’s multiple comparison test is depicted. Two way ANOVA, interaction between cell line and treatment is N.S. B. Invasion through Matrigel was determined for WT, D538G, and Y537S MCF7 cells grown in full serum media. Cells were treated with 10μg/mL anti-CHI3L1 blocking antibody or IgG control 24 hours after plating and harvested 72 hours post-treatment. After crystal violet staining and imaging, the relative amount of invasion was determined using ImageJ software, mean ± SEM of two separate experiments, N=3 One way ANOVA with Tukey’s multiple comparison test is depicted. Two way ANOVA, interaction between cell line and treatment is N.S. C. CHI3L1 IHC was conducted on Y537S mutant HCI-013 grown in E2 supplemented mice and HCI-013-EI grown in ovariectomized mice. Representative images are shown at 400x (left) and quantification of strongly positive (3+) cells was conducted using the ImageScope Software (right), mean ± SEM, N=6-7, Mann-Whitney test.
Figure 6.
Figure 6.. Mutant ER BC cells and specimens have increased type-1 interferon signaling pathway signature and increased IFITM3 protein compared to those with WT ER.
A. Illumina’s BaseSpace Correlation Engine was used to identify mutant-specific pathways from MCF7 mutant-specific genes identified through the multivariate/multilab RNA-seq analysis (Arnesen et al). B-C. Heatmap depicts relative expression, displayed as a Z-score, of genes associated with Innate Immunity (B) and Type I Interferon (C) identified by two different pathway analyses (David and ENRICHR) in ER WT and mutant MCF7 cells grown in hormone-depleted media without E2 for 3-5 days depending on the laboratory. D. WT, D538G, and Y537S MCF7 cells were treated with 1000 units of IFNβ for 24 hours, whole cell lysates were generated and analyzed by western blot for IFITM3. E. IHC for IFITM3 and MUC1 was performed on FFPE pellets generated from WT, D538G, and Y537S MCF-7 cells grown in media containing full serum, mean ± SEM, N=3 photos/pellet, One way ANOVA with Tukey’s multiple comparison test was conducted for each staining (right). Representative images are shown at 1000x (left). F. Formalin fixed paraffin embedded (FFPE) sections of core needle biopsies (N=14 WT ER, N=5 D538G mutant ER) were stained by IHC for IFITM3. Depicted are the mean scores (intensity x percent cells staining) ± SEM, Student’s unpaired two-tailed t test.
Figure 7.
Figure 7.. CD4+ T cells and PD-L1+ macrophages were significantly higher in biopsies of metastatic breast cancer harboring mutant ER as compared to WT ER.
Biopsies of the same metastases characterized in Figure 1 (N=14 with ER WT, N=10 with mutant ER) were stained for tumor infiltrating immune cells using Opal™ TSA technology (Akoya Biosciences) with the following colors indicating respective immune cell markers: CD4 (yellow), Foxp3 (green), CD8 (magenta), CD68 (orange), CD20 (red), and cytokeratin (cyan). Slides were scanned using Vectra 3 Automated Quantitative Pathology Imaging System (Perkin Elmer) technology and 3 to 5 representative 20x fields/tumor were analyzed using inform software (Perkin Elmer) and a pixel-based algorithm for percent positivity, mean percent positive cells ± SEM, Mann–Whitney test (top); representative images (20x, bottom) for: A. T regulatory cells (CD4+ FoxP3+), T helper cells (CD4+ FoxP3−), and cytotoxic T cells (CD8+), B. B cells (CD20+), and C. macrophages (CD68+). D. The same biopsies were stained for PD-L1 and CD68 using Opal™ TSA technology (Akoya Biosciences). Slides were scanned using a Vectra 3 Automated Quantitative Pathology Imaging System (Perkin Elmer), and up to 5 representative fields/tumor were analyzed for either total PD-L1 or dual expression of PD-L1 and CD68 using a cell phenotype-based algorithm for percent positive cells, mean positive cells ± SEM, Mann–Whitney test.

Comment on

Similar articles

Cited by

References

    1. van Hellemond IEG, Geurts SME, Tjan-Heijnen VCG. Current Status of Extended Adjuvant Endocrine Therapy in Early Stage Breast Cancer. Curr Treat Options Oncol 2018;19:26. - PMC - PubMed
    1. Hartmaier RJ, Trabucco SE, Priedigkeit N, Chung JH, Parachoniak CA, Vanden Borre P, et al. Recurrent hyperactive ESR1 fusion proteins in endocrine therapy-resistant breast cancer. Ann Oncol 2018;29:872–80 - PMC - PubMed
    1. Jeselsohn R, De Angelis C, Brown M, Schiff R. The Evolving Role of the Estrogen Receptor Mutations in Endocrine Therapy-Resistant Breast Cancer. Curr Oncol Rep 2017;19:35. - PubMed
    1. Karnik PS, Kulkarni S, Liu XP, Budd GT, Bukowski RM. Estrogen receptor mutations in tamoxifen-resistant breast cancer. Cancer Res 1994;54:349–53 - PubMed
    1. Li S, Shen D, Shao J, Crowder R, Liu W, Prat A, et al. Endocrine-therapy-resistant ESR1 variants revealed by genomic characterization of breast-cancer-derived xenografts. Cell Rep 2013;4:1116–30 - PMC - PubMed

Publication types