. 2020 Dec 1;117(48):30679-30686.
doi: 10.1073/pnas.2007840117. Epub 2020 Nov 12.

Analysis of genomic distributions of SARS-CoV-2 reveals a dominant strain type with strong allelic associations

Affiliations

Analysis of genomic distributions of SARS-CoV-2 reveals a dominant strain type with strong allelic associations

Hsin-Chou Yang et al. Proc Natl Acad Sci U S A. .

Abstract

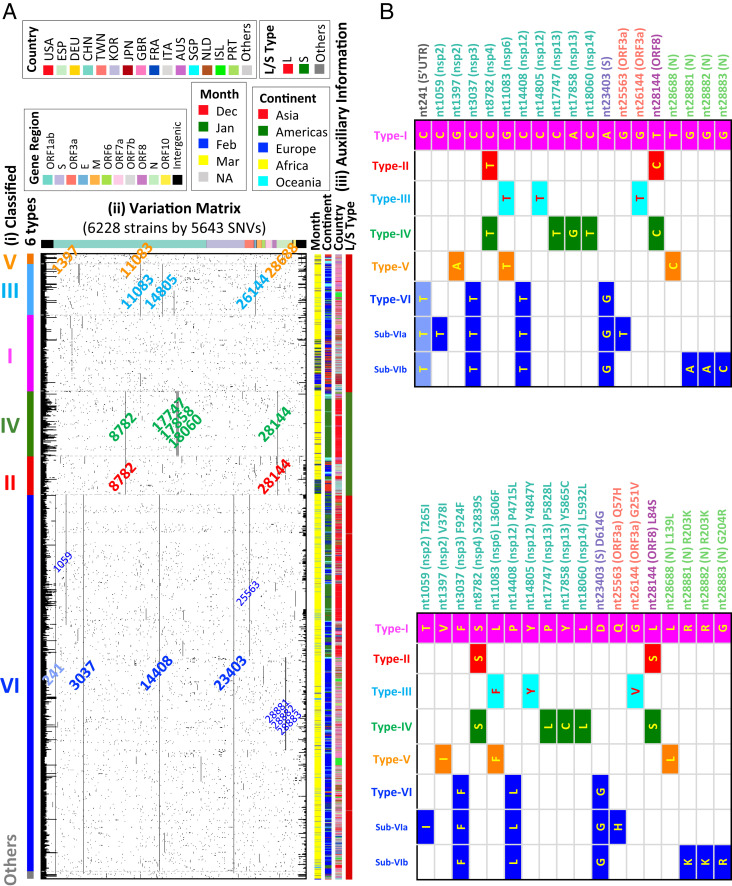
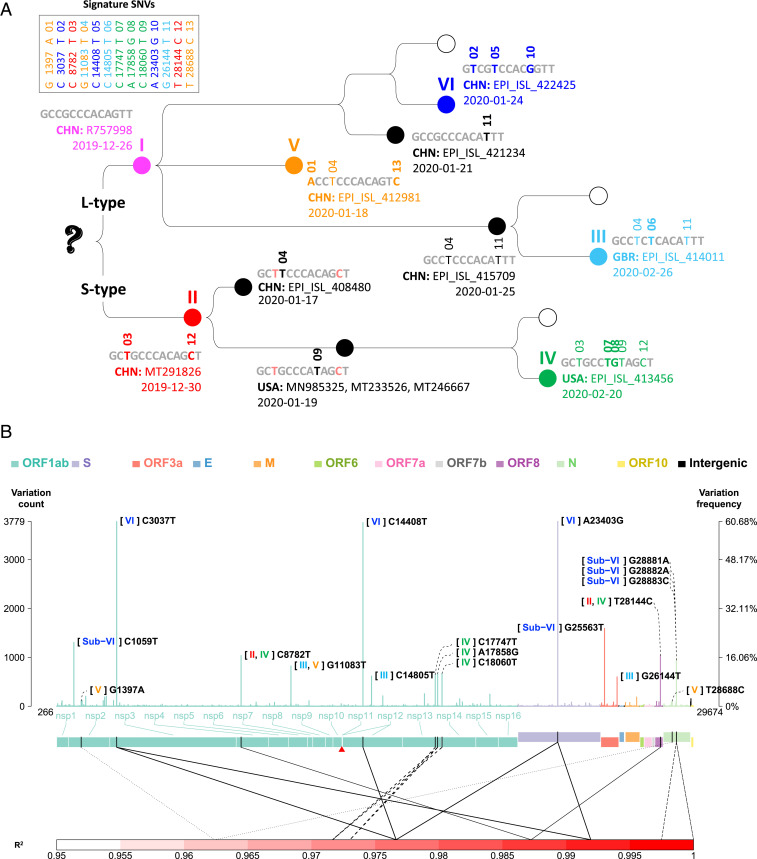
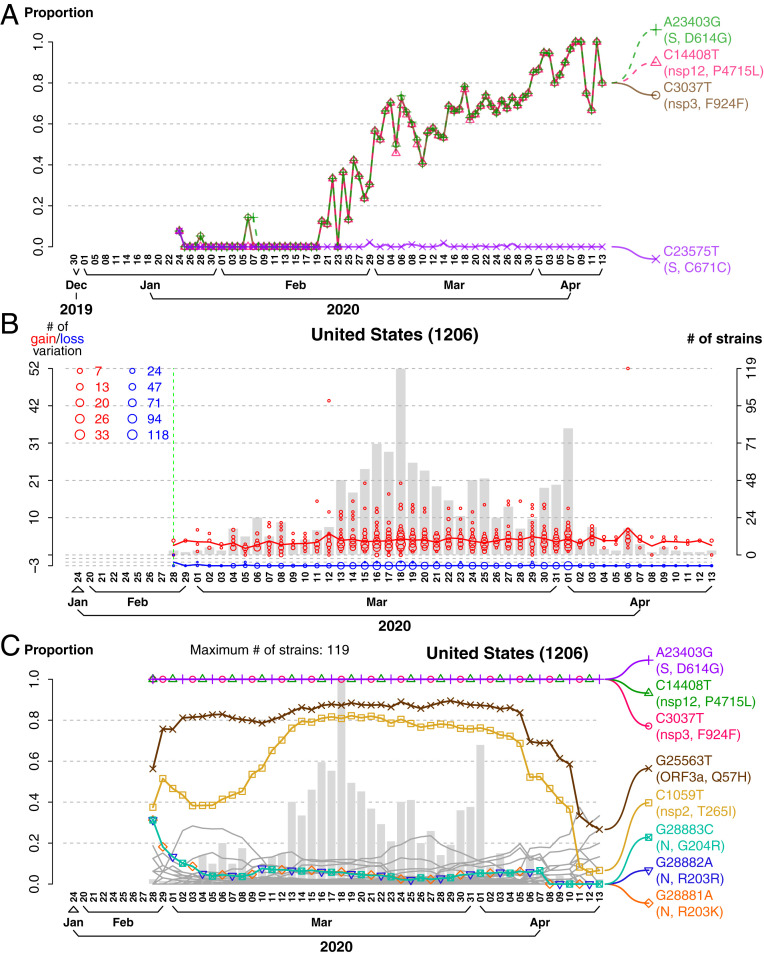
Severe acute respiratory syndrome coronavirus 2 (SARS-CoV-2), the causal agent of COVID 19, continues to evolve since its first emergence in December 2019. Using the complete sequences of 1,932 SARS-CoV-2 genomes, various clustering analyses consistently identified six types of the strains. Independent of the dendrogram construction, 13 signature variations in the form of single nucleotide variations (SNVs) in protein coding regions and one SNV in the 5' untranslated region (UTR) were identified and provided a direct interpretation for the six types (types I to VI). The six types of the strains and their underlying signature SNVs were validated in two subsequent analyses of 6,228 and 38,248 SARS-CoV-2 genomes which became available later. To date, type VI, characterized by the four signature SNVs C241T (5'UTR), C3037T (nsp3 F924F), C14408T (nsp12 P4715L), and A23403G (Spike D614G), with strong allelic associations, has become the dominant type. Since C241T is in the 5' UTR with uncertain significance and the characteristics can be captured by the other three strongly associated SNVs, we focus on the other three. The increasing frequency of the type VI haplotype 3037T-14408T-23403G in the majority of the submitted samples in various countries suggests a possible fitness gain conferred by the type VI signature SNVs. The fact that strains missing one or two of these signature SNVs fail to persist implies possible interactions among these SNVs. Later SNVs such as G28881A, G28882A, and G28883C have emerged with strong allelic associations, forming new subtypes. This study suggests that SNVs may become an important consideration in SARS-CoV-2 classification and surveillance.

Keywords: COVID-19; allelic association; mutation; sequencing; single nucleotide variation.


Conflict of interest statement

The authors declare no competing interest.

Figures

Fig. 1.
Fig. 1.
Variation matrix map and viral strain type. (A) Classified six types with variation matrix map for 6,228 validated SARS-CoV-2 viral strains. (i) Color bar for classified six types for 6,228 validated strains. (ii) Variation matrix map for 6,228 strains with 5,643 variation sites. Strains are sorted by classified strain types in the order of V−III−I−IV−II−VI−Others from the MP dendrogram for 1,932 strains. Nucleotides are listed by relative positions in the genome, with color bands indicating their corresponding genome regions on the top. All 5,643 nucleotides have at least one variation among 6,228 strains. Signature variations for each type (and subtypes for type VI) are labeled with corresponding type colors. (iii) Auxiliary information for each virus strain on month of data collection, continent, country, two strain types (L, S) defined by Tang et al. (9). (B) Annotation of the signature and subtype SNVs. (Top) The signature matrix in the level of nucleic acid. (Bottom) The signature matrix in the level of amino acid. USA, United States of America; ESP, Spain; DEU, Germany; CHN, China; TWN, Taiwan; KOR, Korea; JPN, Japan; GBR, Great British; FRA, France; ITA, Italy; AUS, Australia; SGP, Singapore; NLD, The Netherlands; ISL, Iceland; PRT, Portugal.
Fig. 2.
Fig. 2.
Temporal distributions of the six types. (A) The globe; (B) Great Britain; (C) United States; (D) Netherlands. In each plot, the proportions of type I through type VI are displayed using six curves with different colors. The left-hand-side vertical axis indicates the moving-window proportion calculated by dividing the number of the strains belonging to a specific type by the total number of the strains for the samples within four dates of a specific date in each side. The right-hand-side vertical axis indicates the number of strains (i.e., sample size). Sample size is displayed with a histogram in the background.
Fig. 3.
Fig. 3.
Signature SNVs. (A) Emergence history of the 13 signature SNVs in protein coding regions and six types. For each strain type, the signature SNVs, first observation time, country, and strain name are shown. (B) Genomic profile of the average variation counts per sample across the viral genome. In each site, the left-hand-side vertical axis indicates the total counts of variations at a site. The right-hand-side vertical axis indicates variation frequency, that is, the average variation counts per sample (i.e., the number of variations that occurred at a site in all viral strains divided by the number of strains). Variations in different gene regions are displayed in different color. A red triangle indicates the starting site of −1 ribosomal frameshift signal in ORF1ab. Two ends (5′ leader and 3′ terminal sequences) are not shown. Pairwise allelic association (R2) is shown only for the pairs of the signature and subtype SNVs with an R2 value of >0.95, and the same line type is used to indicate a pair of SNVs with strong allelic association.
Fig. 4.
Fig. 4.
Dominance and persistence of type VI signature SNVs. (A) Temporal proportion of the new variations first coobserved in the strain EPI_ISL_422425 from China on January 24, 2020. Average variation counts per sample for C3037T (F924F), C14408T (P4715L), A23403G (D614G), and C23575T (C671C) first coobserved in EPI_ISL_422425 in China are displayed since January 24, 2020. The TTG signature SNVs persisted, but C23575T was lost immediately in the samples. (B) Number of variation gain and loss in the type VI strains in the United States. The left-hand-side vertical axis indicates the numbers of variation gain and loss. We picked one at random from the strains in the first date of sample collection in the United States as a reference strain. Compared with the first strain in the United States, in addition to the TTG signature SNVs, the type VI strains in the United States had, at most, three additional variations. Blue circles indicate the number of strains that lost the additional variations. Red circles indicate the number of strains that gained variations not in the reference strain. The larger circle represents the larger number of strains that lost/gained the additional variations. Sample size is displayed with a histogram in the background. (C) Temporal frequency of the variations in the type VI strains in the United States. The moving-window proportion on a sample collection date was calculated by dividing the number of variations (e.g., allele G for A23403G) by the number of strains within four closest sample collection dates on each side. Sample size is displayed with a histogram in the background. Note that the variations in this figure were those newly added variations compared to the reference strain from the United States (red circles in B).

References

    1. Sokal R. R., Michener C. D., A statistical method for evaluating systematic relationships. Univ. Kansas Sci. Bull. 28, 1409−1438 (1958).
    1. Saitou N., Nei M., The neighbor-joining method: A new method for reconstructing phylogenetic trees. Mol. Biol. Evol. 4, 406–425 (1987). - PubMed
    1. Felsenstein J., Evolutionary trees from DNA sequences: A maximum likelihood approach. J. Mol. Evol. 17, 368–376 (1981). - PubMed
    1. Edwards A. W. F., Cavallisforza L. L., The reconstruction of evolution. Ann. Hum. Genet. 27, 104–105 (1963).
    1. Everitt B. S., Landau S., Leese M., Cluster Analysis (Arnold, London, United Kingdom, 2001).

Publication types