. 2020 Nov 13;370(6518):eaba7612.
doi: 10.1126/science.aba7612.

A human cell atlas of fetal chromatin accessibility

Affiliations

A human cell atlas of fetal chromatin accessibility

Silvia Domcke et al. Science. .

Abstract

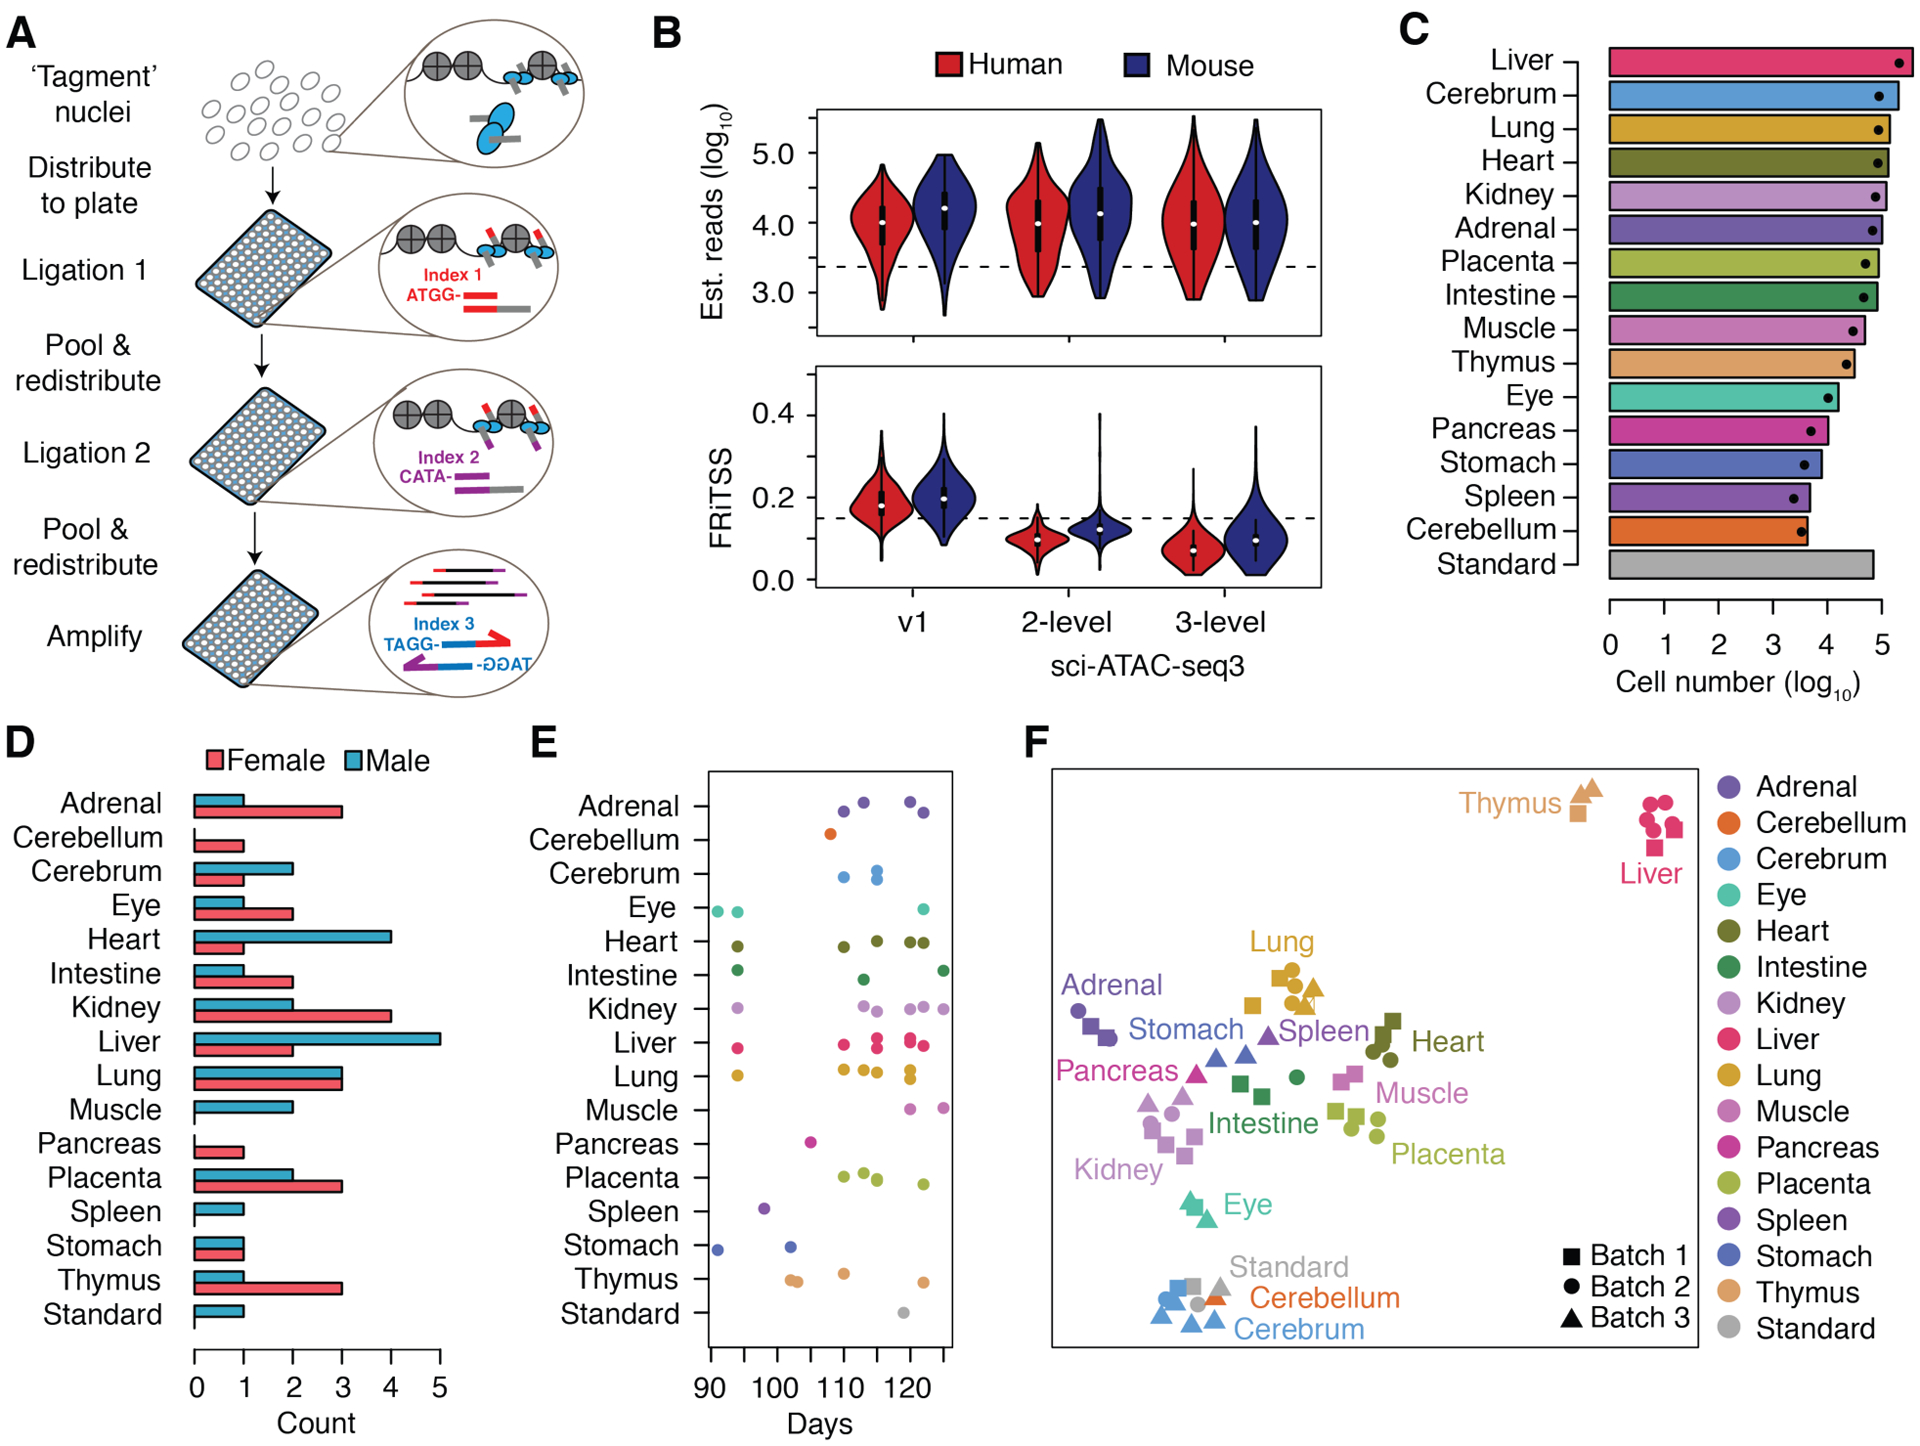
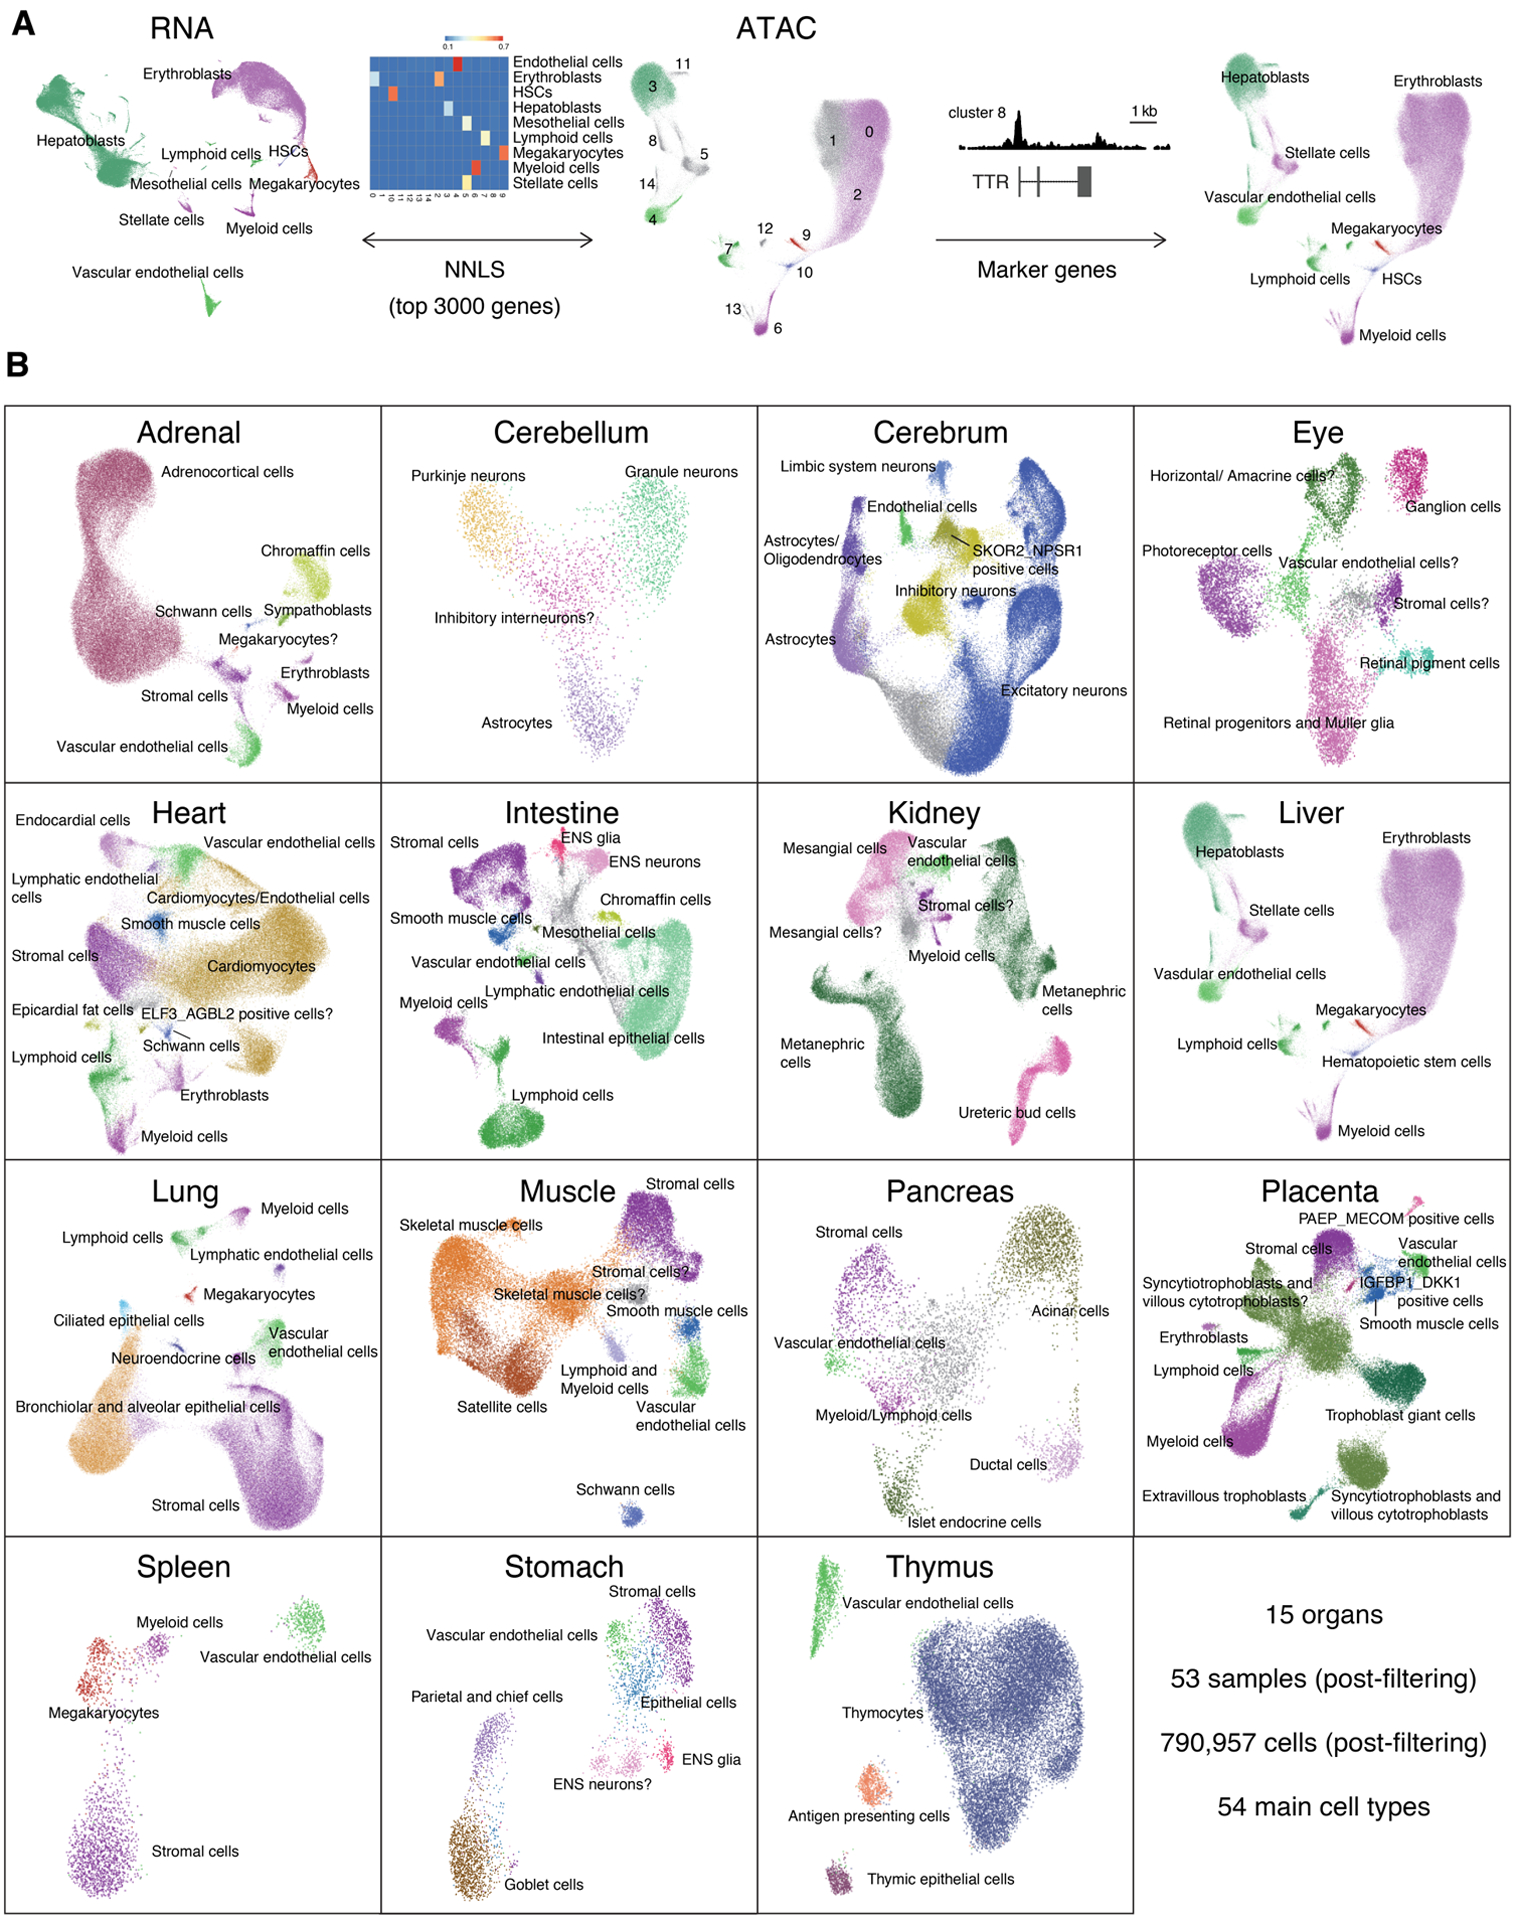
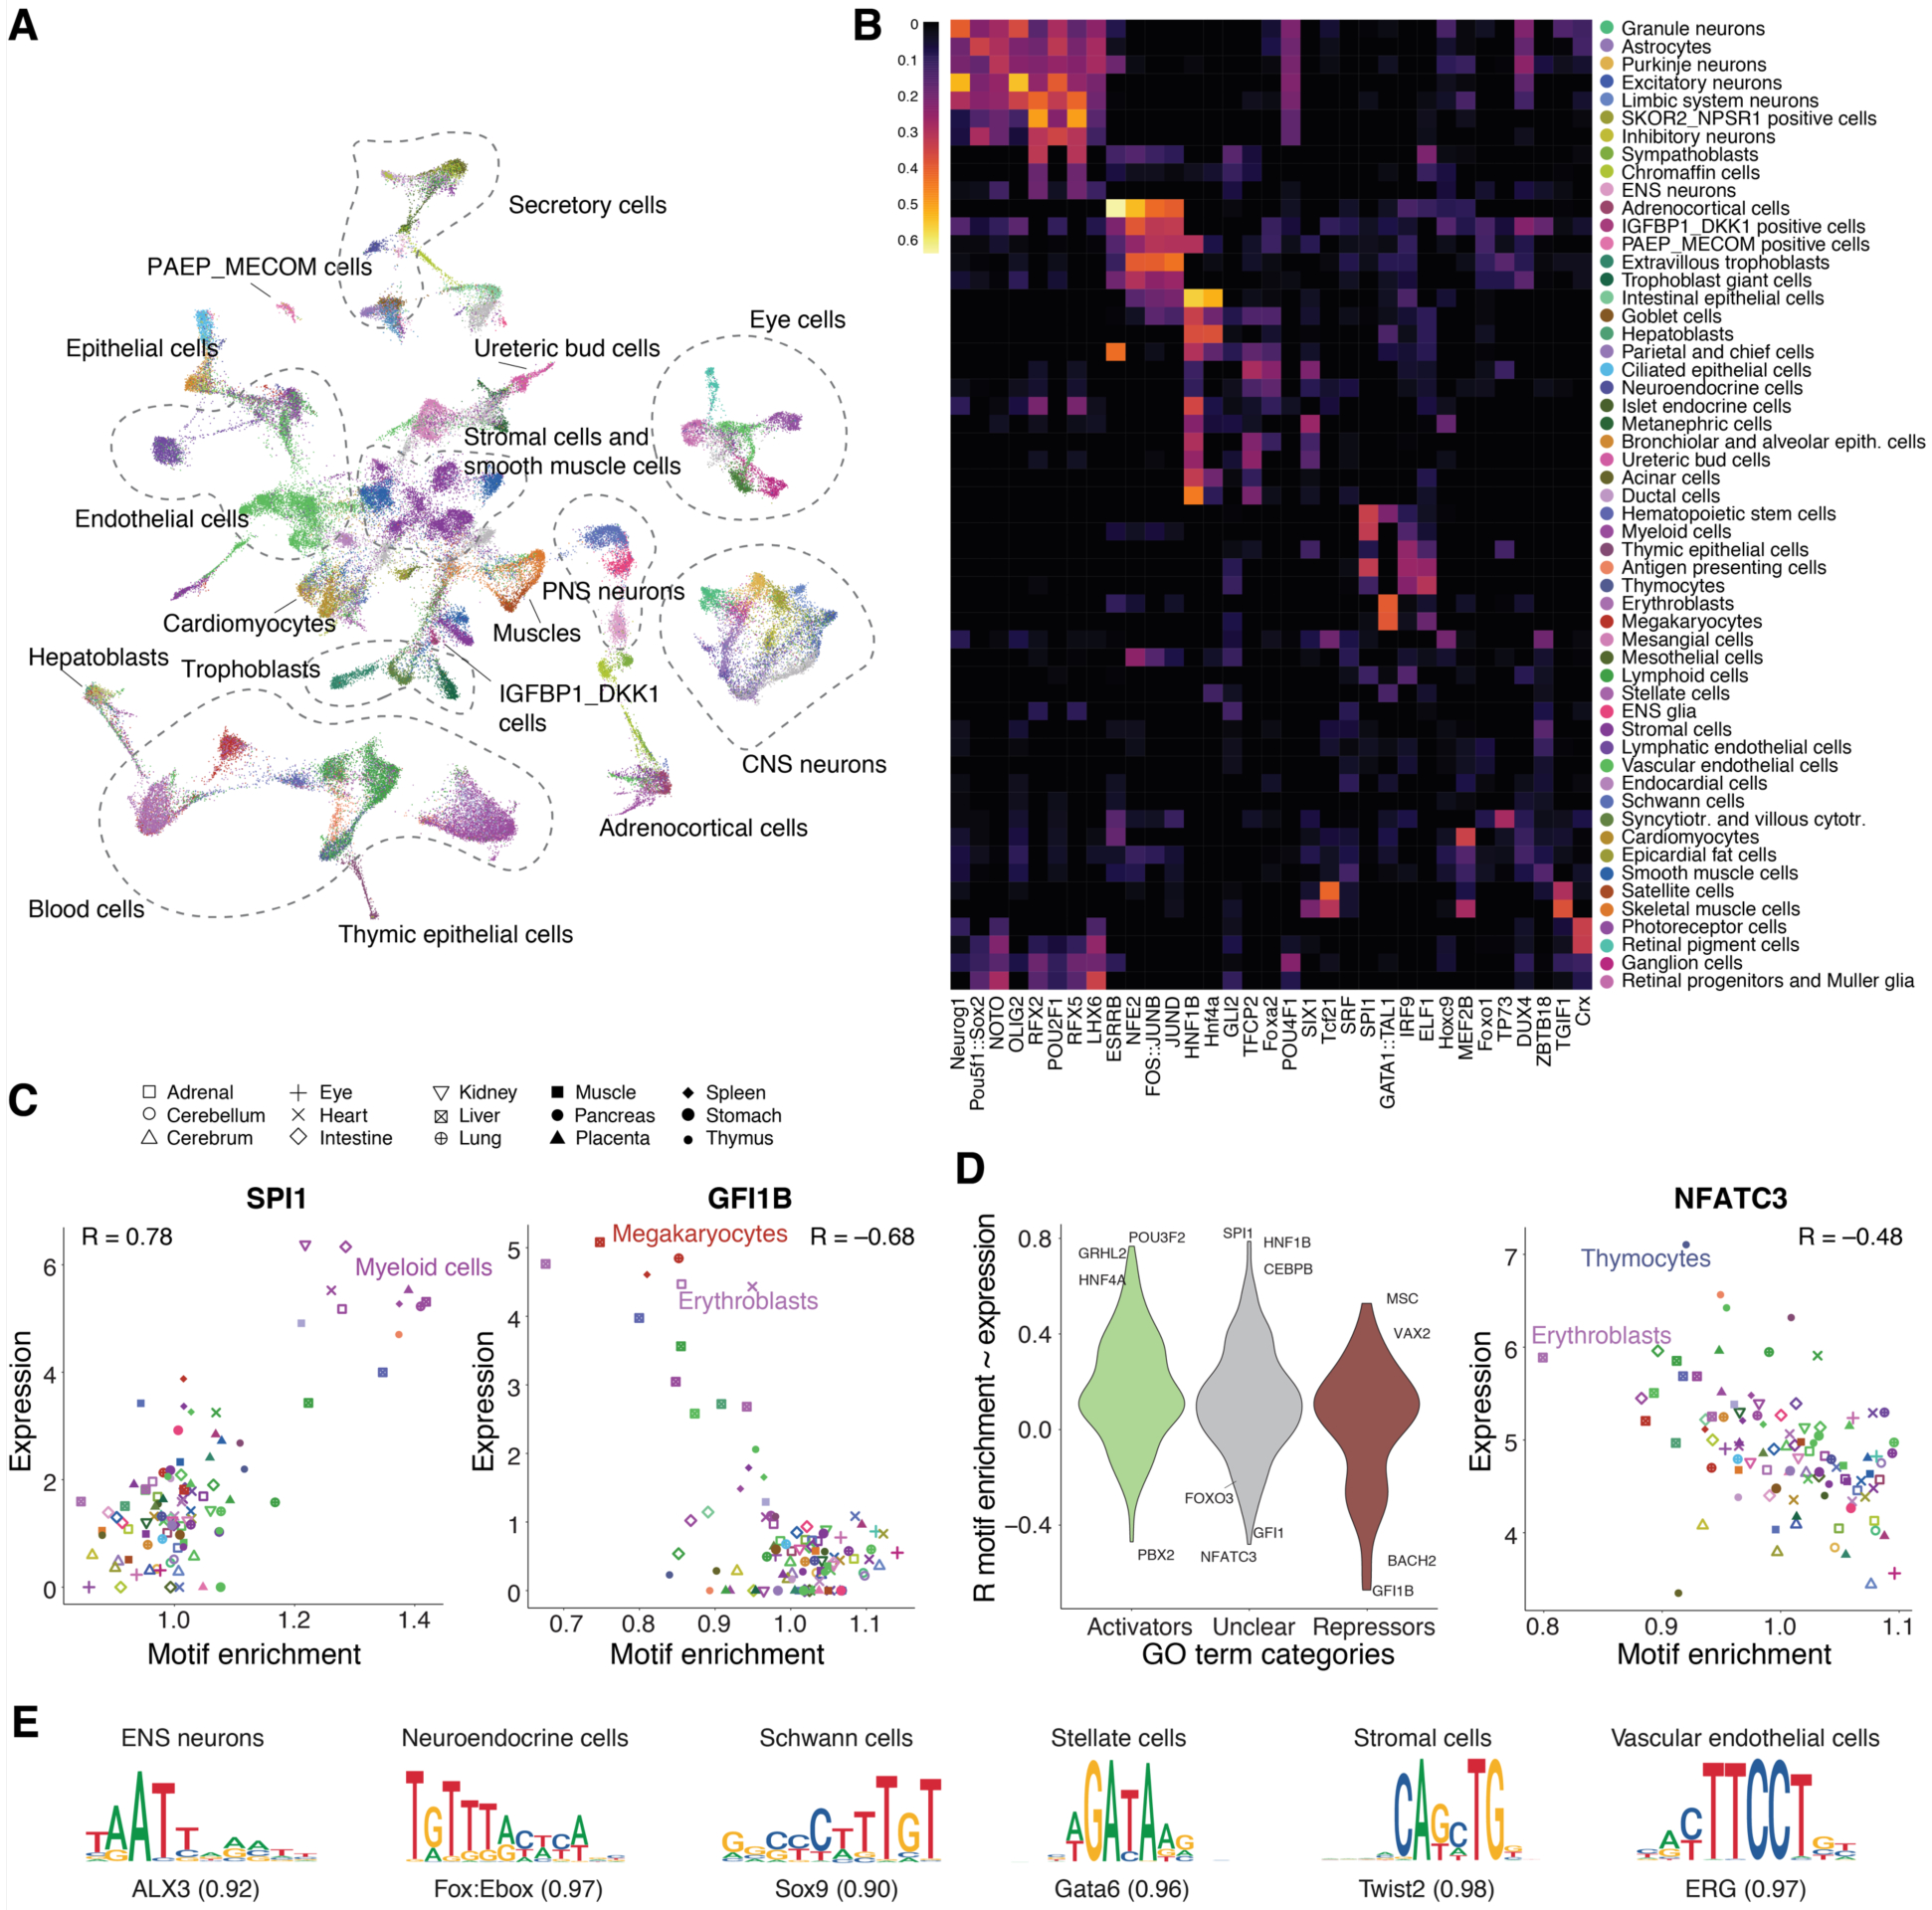
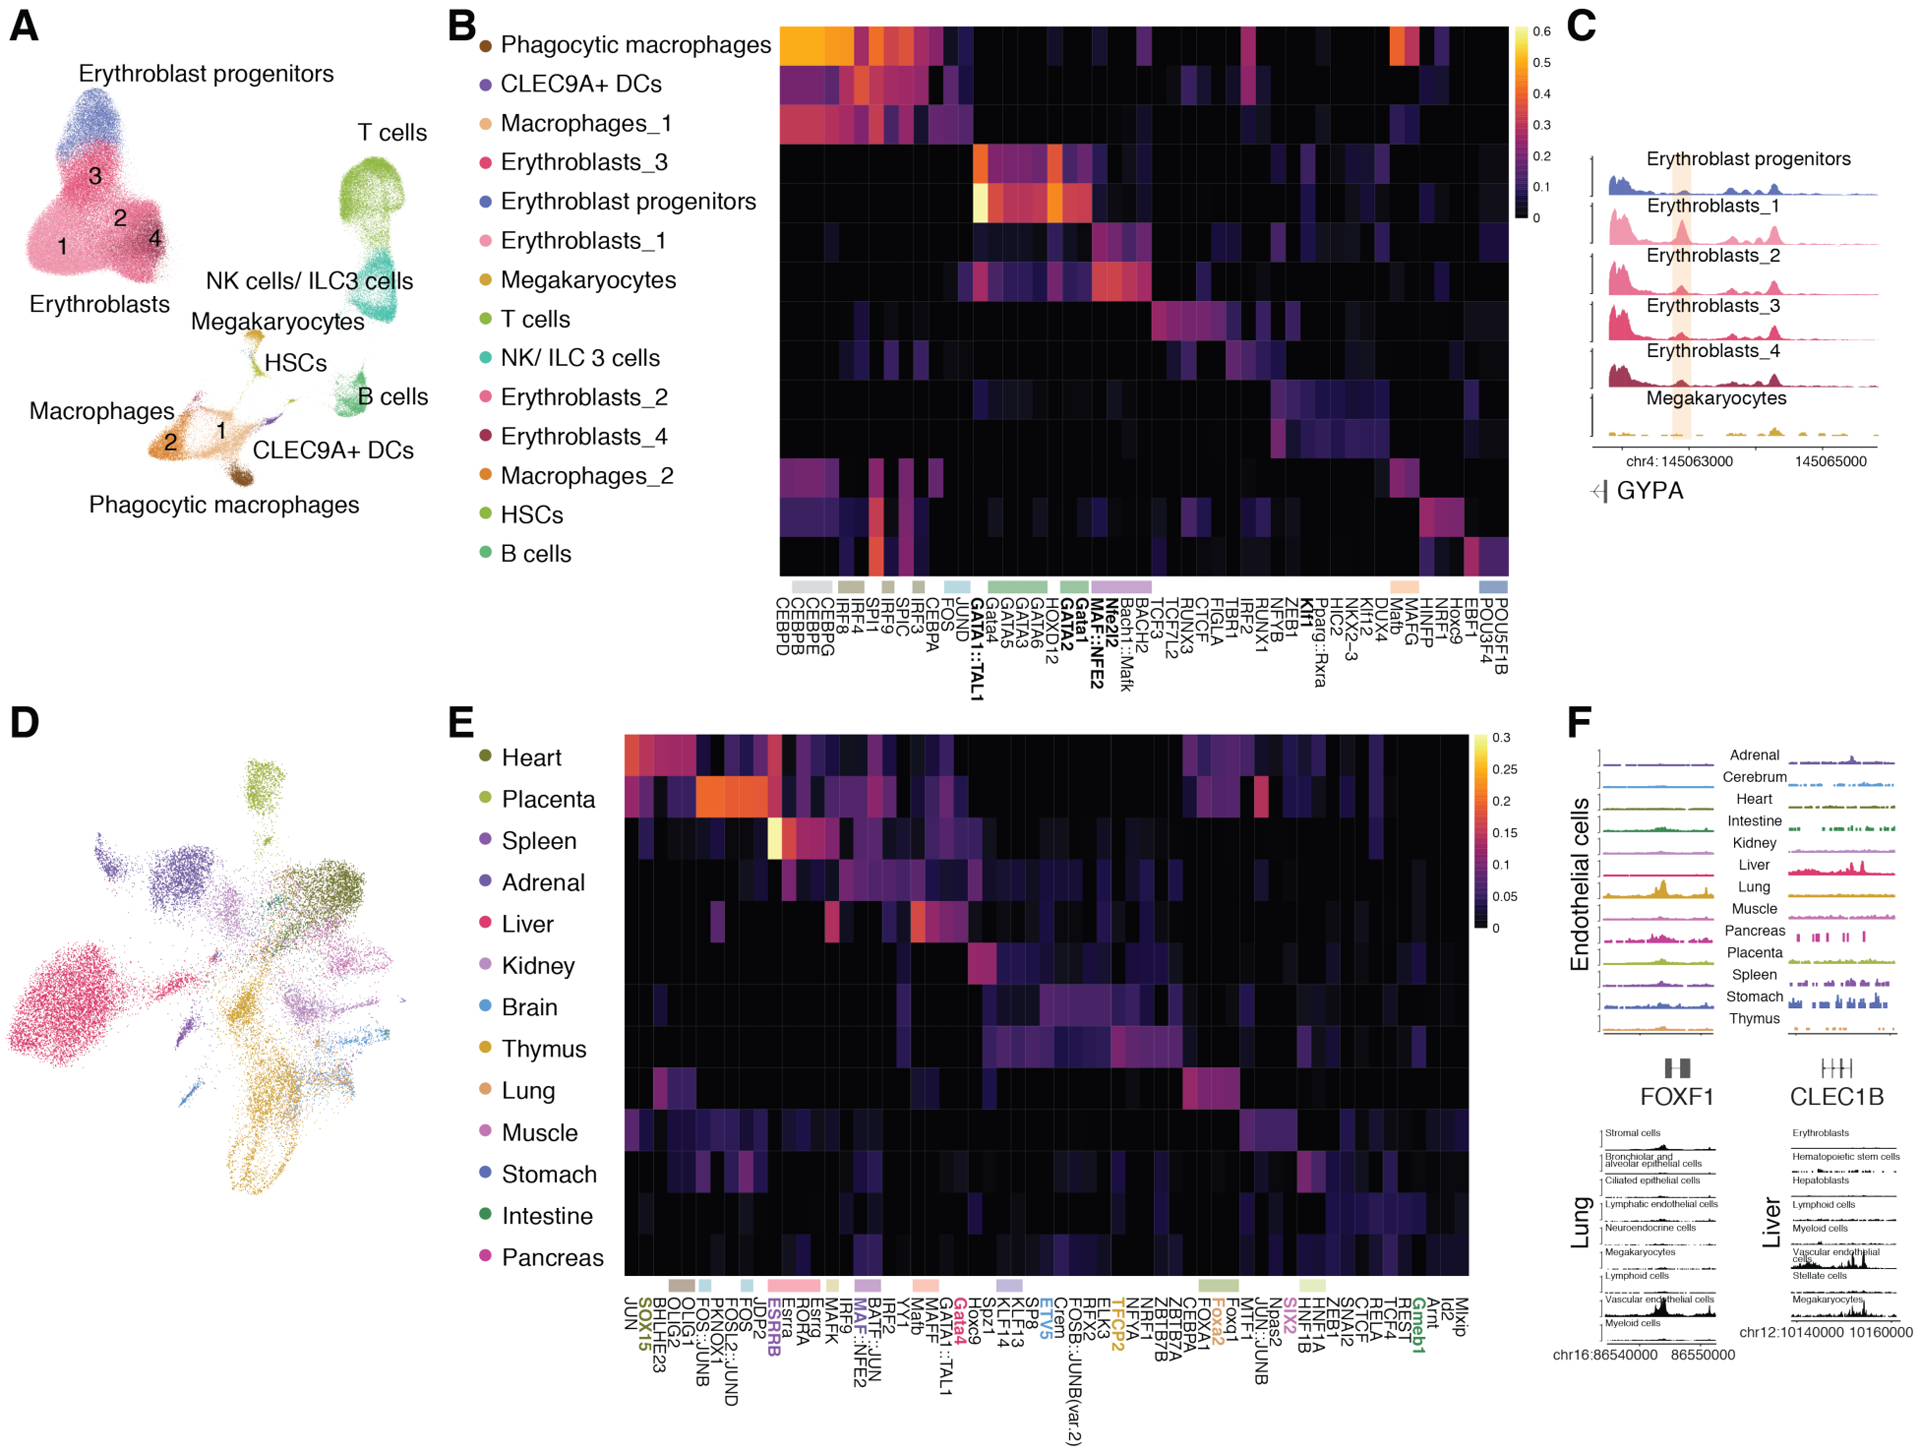
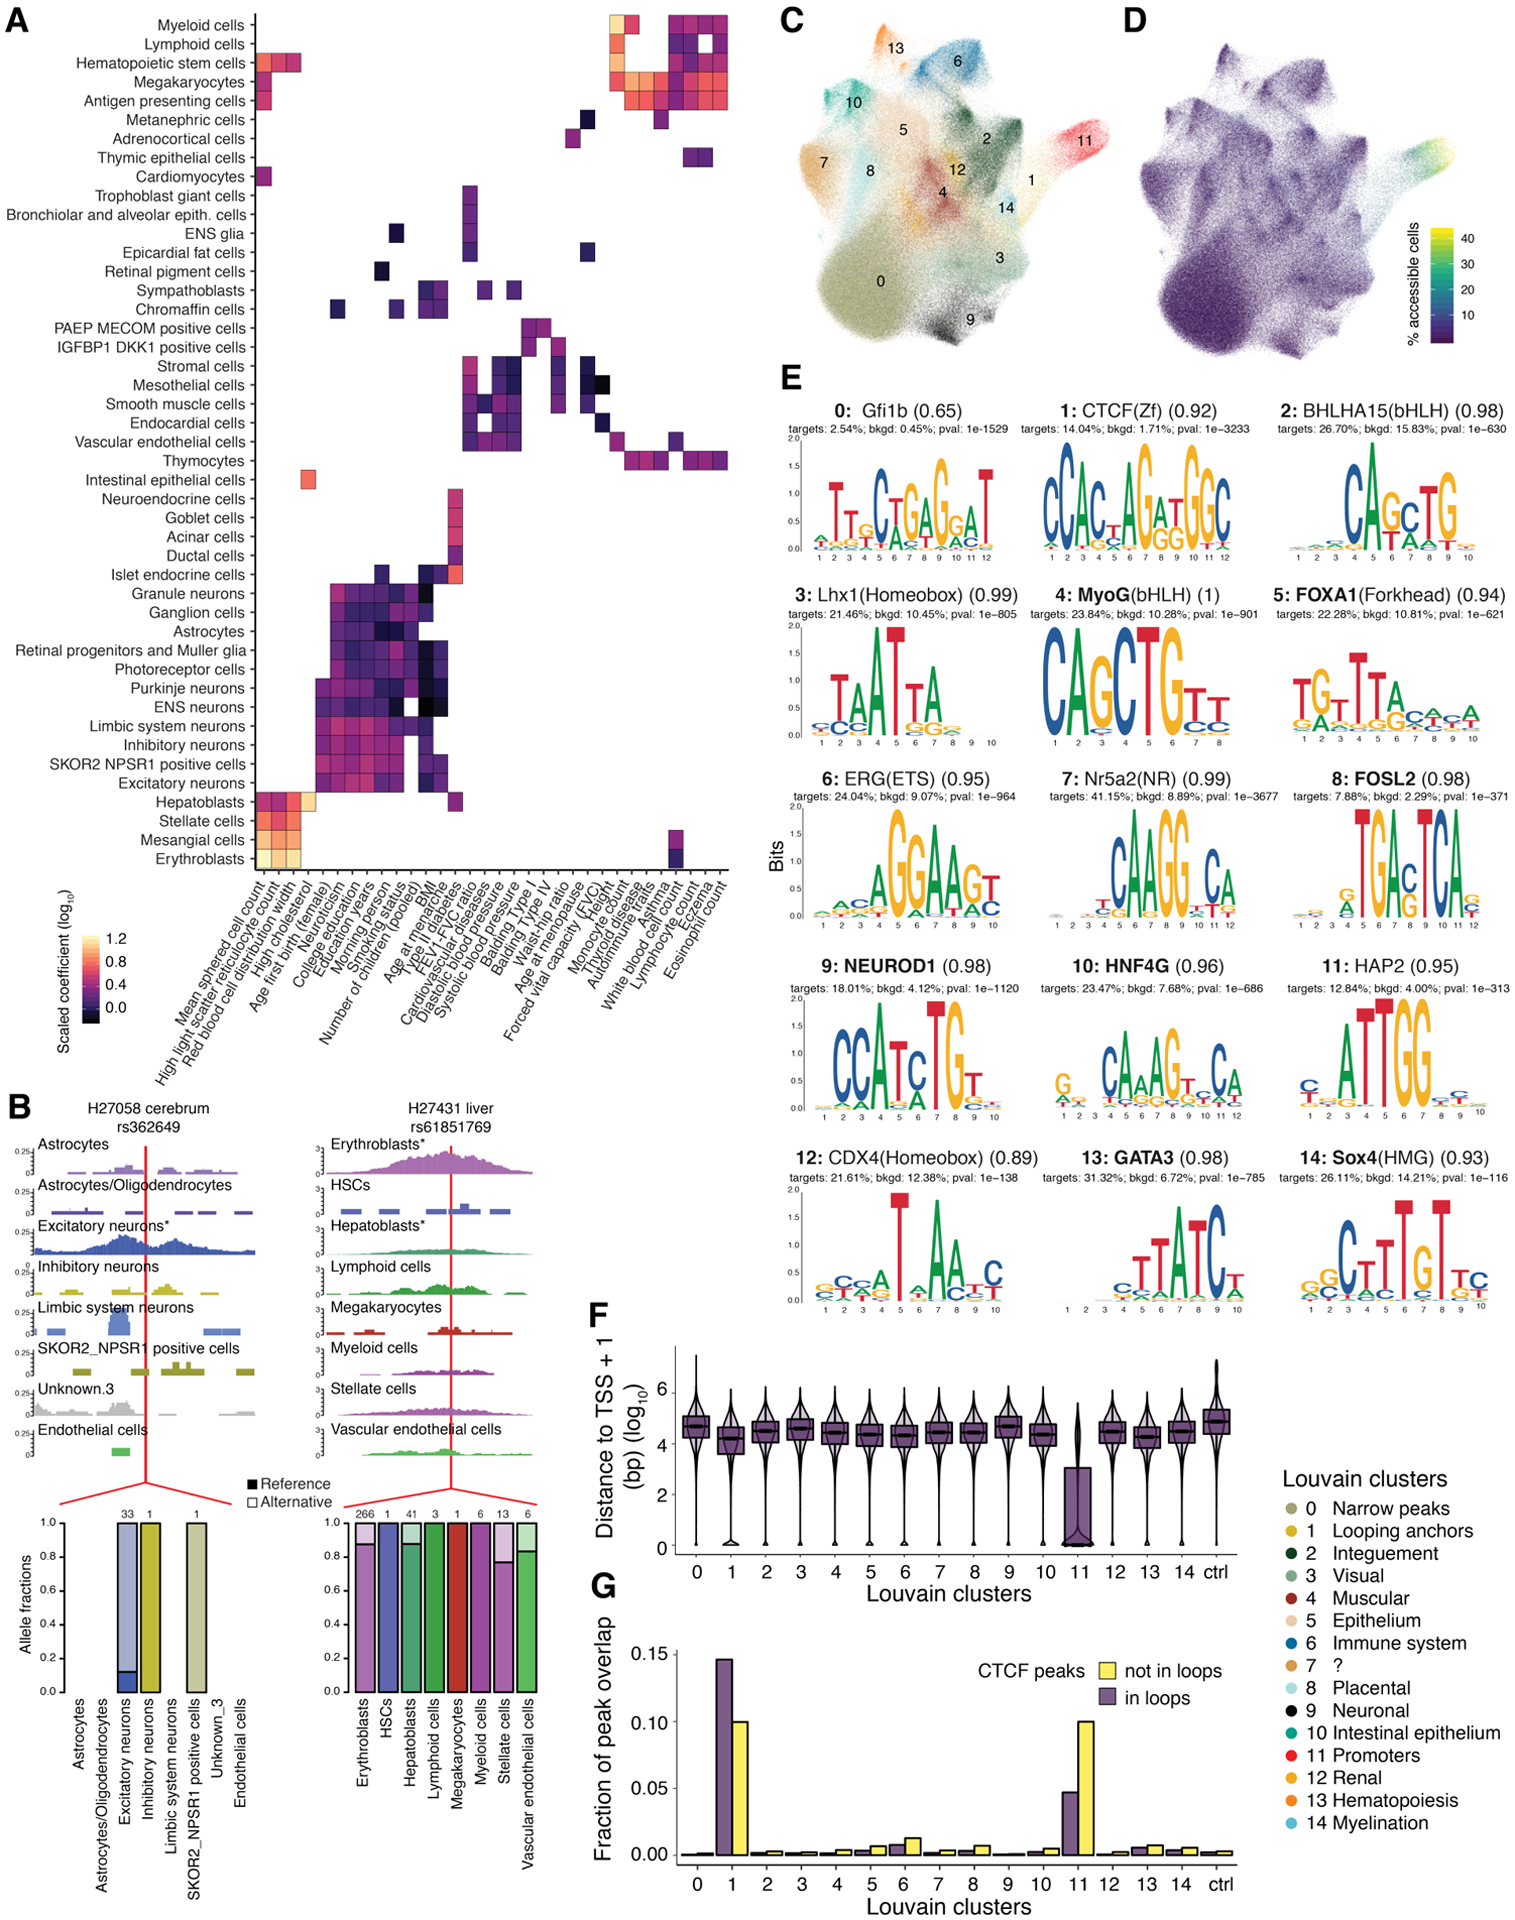
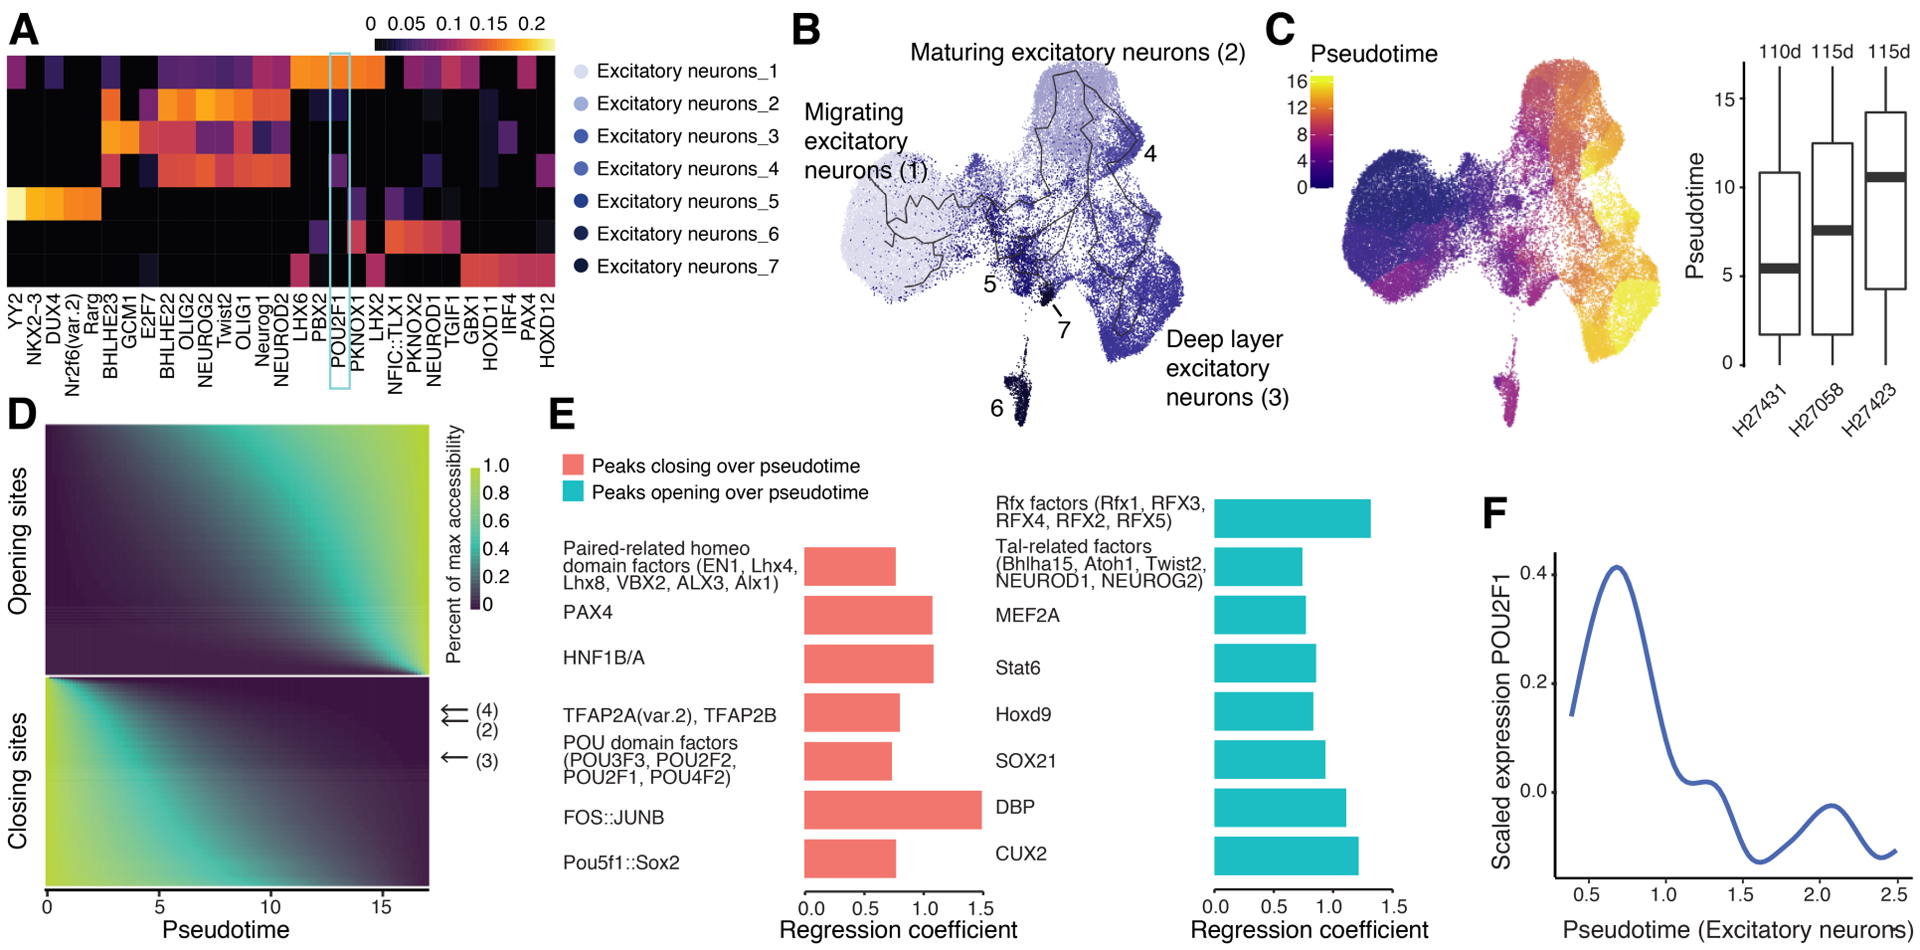
The chromatin landscape underlying the specification of human cell types is of fundamental interest. We generated human cell atlases of chromatin accessibility and gene expression in fetal tissues. For chromatin accessibility, we devised a three-level combinatorial indexing assay and applied it to 53 samples representing 15 organs, profiling ~800,000 single cells. We leveraged cell types defined by gene expression to annotate these data and cataloged hundreds of thousands of candidate regulatory elements that exhibit cell type-specific chromatin accessibility. We investigated the properties of lineage-specific transcription factors (such as POU2F1 in neurons), organ-specific specializations of broadly distributed cell types (such as blood and endothelial), and cell type-specific enrichments of complex trait heritability. These data represent a rich resource for the exploration of in vivo human gene regulation in diverse tissues and cell types.


Conflict of interest statement

Competing interests: D.P., F.Z. and F.J.S. declare competing financial interests in the form of stock ownership and paid employment by Illumina, Inc. J.S. has competing financial interests (paid consulting and/or equity) with Guardant Health, Maze Therapeutics, Camp4 Therapeutics, Nanostring, Phase Genomics, Adaptive Biotechnologies, and Stratos Genomics. One or more embodiments of one or more patents and patent applications filed by Illumina and UW may encompass the methods, reagents, and data disclosed in this manuscript.

Figures

Fig. 1.
Fig. 1.. Design of 3-level sci-ATAC-seq and application to chromatin accessibility profiling of 1.6 million cells from 59 fetal samples.
(A) Schematic of sci-ATAC-seq3. Nuclei are tagmented with Tn5 transposase in bulk. The first two rounds of indexing are achieved by successive ligations to each end of the Tn5 transposase complex, and the third round by PCR. (B) Comparison of complexity and specificity achieved with different versions of the sci-ATAC-seq protocol in mixing experiments of mouse and human suspension cell lines. The estimated total unique reads (‘complexity’) for each cell was calculated with Picard and are displayed as violin plots on a log10 scale (115). The Fraction of Reads in Transcription Start Sites (‘FRiTSS’) was calculated for each cell in the same experiments (bottom). Reads within 500 bp of a Gencode TSS were considered within the TSS. v1: species mixing experiment using our previously published 2-level sci-ATAC-seq protocol (13); 2-level: 2-level version of the new protocol with simultaneous ligations; and 3-level: 3-level version of the new protocol. (C) Barplot showing number of cells profiled per organ (log10 scale). Dots indicate the number of cells remaining after QC filtering procedures. Standard: sentinel tissue (trisomy 18 cerebrum) included in all three experiments. (D) Barplot showing the distribution of sexes for samples corresponding to each organ. (E) Stripchart showing the estimated post-conceptual age of each sample. Samples arranged by organ and slightly jittered to avoid overplotting. (F) Uniform Manifold Approximation and Projection (UMAP) visualization of aggregated chromatin accessibility profiles of single cells from each of the samples, colored by organ. Normalized accessibility at a master set of peaks was quantified for each ‘pseudobulk’ sample and used as an input to UMAP. Shapes indicate the processing batch of each sample.
Fig. 2.
Fig. 2.. Identifying cell types across 15 human organs.
(A) Summary of annotation strategy. Cell types were first annotated in sci-RNA-seq data (16) gathered from matching tissues based on marker gene expression (left). Louvain clusters were identified in sci-ATAC-seq data for each tissue. Next, gene level accessibility scores were calculated for each of these clusters and matched to RNA clusters based on non-negative least squares (NNLS) regression, in some cases leading to merging of Louvain clusters (middle). These first-pass automated annotations were refined by manually reviewing the cluster-specific accessibility landscape around marker genes (right), e.g. initially unannotated cluster 8 exhibited specific accessibility at the TTR locus, and was therefore merged with cluster 3 (hepatoblasts). (B) UMAP visualization and annotation of 790,957 cells profiled across 15 organs. The colors correspond to the 54 main cell types that were identified across the different organs.
Fig. 3.
Fig. 3.. Identifying key TF regulators of cell type-specific chromatin accessibility and their modes of action.
(A) Combined UMAP of the entire dataset subsampled to a maximum of 800 cells per initial cluster ID. Cells are colored by 54 main cell types as in (B). Groups of related cell types are circled. (B) Fold-change of the top enriched TF motif in cell type-specific peaks for all 54 main cell types. Cell types (rows) are ordered by hierarchical clustering of the motif enrichment matrix (log10-scaled fold-change of the mean motif occurrence in peaks of this cell type relative to the rest of the dataset, qval < 0.01). Additional enriched TF motifs in cell type-specific peaks are provided in File S3. (C) Examples of an activating (left panel) vs. repressive (right panel) TF whose expression levels are positively or negatively correlated with motif accessibility across cell types and tissues, respectively. Each point represents a cell type from a specific tissue (color code as in (B); shape code above). Motif enrichment corresponds to fold-change of the mean motif occurrence in peaks of this cell type relative to the rest of the dataset. Expression values for the TFs are from sci-RNA-seq data collected in matching cell types as described in (16) (natural log of CPM+1). R values are Pearson correlations. (D) Correlation of motif enrichment and expression can be used to predict the mode of action of unclassified TFs. Left panel: TFs were automatically assigned to the category of activator, repressor or unclear on the basis of their associated GO terms. Pearson correlation values of motif enrichment and TF expression were calculated across all cell types in all tissues and are shown by category for all 455 TFs for which we have both values. Most TFs show positive correlation values. Annotated repressors have a lower median R values than activators, with many of the outliers being due to missing or misleading GO term annotations. Right panel: A high absolute R value can serve to classify TFs with unknown mode of action. An example is NFATc3, a likely repressor based on this analysis. (E) Position weight matrices (PWMs) identified by de novo motif search for exemplary cell types with no strong enrichment in (B). De novo motif enrichment was performed with homer (48) in the 2,000 most specific peaks for each cell type using CpG-matched genomic sequences as background. The closest known motif and the score for the motif matching process are indicated below. Further details as well as PWMs for all cell types are provided in Fig. S7.
Fig. 4.
Fig. 4.. Identifying major subgroups and associated TFs in broadly distributed lineages.
(A) UMAP visualization of 152,649 blood cells extracted from all organs, colored and annotated by Louvain clusters. (B) Five TF motifs most strongly enriched in peaks of each Louvain cluster in (A) (log10-scaled fold-change of the mean motif occurrence in peaks of this cluster relative to the rest of the dataset, qval < 1e-6). Highly similar motifs, as determined from RSAT matrix-clustering of the JASPAR vertebrate motif collection (116), are marked by horizontal bars. (C) Example locus upstream of GYPA with differential accessibility across erythroblast populations. Accessibility is summed for all cells in each Louvain cluster and the scale is normalized to account for differences in total reads per cell as well as cell numbers across clusters. Other blood cell types, including megakaryocytes (shown), have negligible accessibility at this region. (D) UMAP visualization of 27,576 vascular endothelial cells extracted from all organs and colored by tissue-of-origin. Colors as in (E). Only the top 20,000 endothelial-specific peaks as determined in each tissue were used for clustering, merged to 94,023 unique peaks across all tissues. (E) Five TF motifs most strongly enriched in peaks of each tissue group in (D) (log10-scaled fold-change of the mean motif occurrence in peaks of this tissue group relative to the rest of the dataset, qval < 1e-4). Highly similar motifs, as determined from RSAT matrix-clustering of the JASPAR vertebrate motif collection (116), are marked by horizontal bars. Motifs whose TFs (or TFs with highly similar motifs) are most highly expressed in endothelial cells from the same tissue in sci-RNA-seq data are highlighted (colors correspond to tissues). (F) Example loci showing specific accessibility in lung (left) or liver (right) endothelial cells. These sites also exhibit tissue-specific accessibility in their tissue-of-origin (bottom) and thus are unlikely to be consequent to residual doublets or free DNA contamination from other cell types. The CLEC1B locus is also accessible in the small cluster of megakaryocytes in liver and is known to be expressed in platelets (117). Accessibility is summed for all cells in each Louvain cluster and the scale is normalized to account for differences in total reads per cell as well as cell numbers across clusters.
Fig. 5.
Fig. 5.. Heritability enrichment and co-accessibility of candidate regulatory regions.
(A) Enrichment of heritability for UK Biobank traits within top 10,000 specific sites for each cell type. Trait/cell type pairs with no significant positive enrichment (q-value > 0.2) are white. A full table of scaled coefficients and q-values for each trait/cell type pair is provided in Table S3. (B) Example sites with allelic imbalance. Browser tracks of accessibility for the cell types in a cerebrum (left) and liver (right) sample are normalized to counts per million reads. Results are presented as unsmoothed base coverage. Asterisks denote cell types with significant allelic imbalance. The red vertical line indicates the position of the SNP exhibiting allelic imbalance. The bar plots below show the relative portions of reads mapping to the reference and alternative allele at that position. Above each bar is the number of reads overlapping the SNP for each cell type. (C) UMAP visualization of a subset of accessible regions from the master set that are >400 bp (447,879 sites), using accessibility profiles from the subsampled cell dataset in Fig. 3B (88,983 cells). Sites are colored by Louvain clusters, which are numbered by decreasing size and annotated into broad categories according to motif enrichment and lineage affiliation of enriched cells. Legend at bottom right of overall figure. Cluster 0 consists of narrower sites with the lowest accessibility across cells and is not enriched for a clear motif, and possibly reflects rare/transient cell states or biological/technical noise. (D) Same as (C), but colored by the percentage of cells in which sites are accessible. A version where the accessible percentage is binned by content is shown in Fig. S13C. (E) Position weight matrices (PWMs) identified by de novo motif search in each of the clusters in (C). De novo motif search was performed with homer (48), using CpG-matched genomic sequences as background. The top PWM per cluster 0–14 is labeled by the closest known motif as determined by homer with the score for the motif matching process indicated in brackets. Listed below are the percentage of sites within the cluster and CpG-matched background sequences that contain a match to the de novo PWM, and a p-value for the enrichment. Motifs associated with pioneer TFs are in boldface. Note that the top motif for cluster 0 is only found in 2.5% of sites and has a poor matching score. (F) Violin plots of the distances of each group of sites in (C) to the nearest TSS is shown. 20,000 random regions located on autosomes with a width corresponding to the median width of all sites in (C) were used as control (ctrl). (G) Fraction of sites within each cluster overlapping with ENCODE-defined CTCF-bound peaks within vs. outside of looping regions. All CTCF ChIP-seq peaks overlapping CTCF motifs in looping regions in GM12878 (n = 8,253) and the same number of ChIP-seq peaks not overlapping looping regions but with the same ChIP-seq score were selected. For each cluster in (C), the fraction of sites overlapping these two CTCF-bound sets was calculated. The same control (ctrl) regions as in (F) were used.
Fig. 6.
Fig. 6.. Chromatin accessibility dynamics in developing excitatory neurons.
(A) TF motifs enriched in excitatory neuron clusters. Fold-change of the top five enriched TF motifs in cluster-specific peaks for each of 7 Louvain clusters that were annotated as excitatory neurons (log10-scaled fold-change of the mean motif occurrence in peaks of this cell subtype relative to the rest of the excitatory neurons, qval < 0.01). POU2F1 enrichment (see text) is highlighted with a vertical box. (B) UMAP visualization and pseudotime trajectory path of 48,733 excitatory neurons colored by Louvain cluster. Color legend in (A). (C) Pseudotime of excitatory neurons. UMAP visualization colored by pseudotime (left) and boxplots of median pseudotime per individual donor (right). Estimated gestational age is indicated above the boxplots. (D) Smoothed pseudotime-dependent accessibility curves of excitatory neurons, generated by a negative binomial regression and scaled as a percent of the maximum accessibility of each site. Sites (rows) are sorted by the pseudotime at which they first reach half their maximum accessibility. A random 10% of accessible sites was selected and 3,387 sites with pseudotime-dependent accessibility (p < 0.05, Wald test) are shown. Peaks from Fig. S18A are highlighted with arrows. (E) Motif enrichments in dynamically accessible sites from (D). Coefficients from logistic regression model using the presence or absence of a given motif in each site to predict whether the site has a given accessibility trend. Plots show the top motifs ordered by Benjamini-Hochberg corrected q-value for each category (q-value < 0.05); similar motifs are grouped together. (F) Expression dynamics of POU2F1 over pseudotime in excitatory neurons. Smoothed POU2F1 expression in matching excitatory neurons from (16) was normalized by size factor in each single cell, then log-transformed and scaled.

Comment in

References

    1. Cusanovich DA, Daza R, Adey A, Pliner HA, Christiansen L, Gunderson KL, Steemers FJ, Trapnell C, Shendure J, Multiplex single cell profiling of chromatin accessibility by combinatorial cellular indexing. Science. 348, 910–914 (2015). - PMC - PubMed
    1. Cao J, Packer JS, Ramani V, Cusanovich DA, Huynh C, Daza R, Qiu X, Lee C, Furlan SN, Steemers FJ, Adey A, Waterston RH, Trapnell C, Shendure J, Comprehensive single-cell transcriptional profiling of a multicellular organism. Science. 357, 661–667 (2017). - PMC - PubMed
    1. Ramani V, Deng X, Qiu R, Gunderson KL, Steemers FJ, Disteche CM, Noble WS, Duan Z, Shendure J, Massively multiplex single-cell Hi-C. Nat. Methods 14, 263–266 (2017). - PMC - PubMed
    1. Mulqueen RM, Pokholok D, Norberg SJ, Torkenczy KA, Fields AJ, Sun D, Sinnamon JR, Shendure J, Trapnell C, O’Roak BJ, Xia Z, Steemers FJ, Adey AC, Highly scalable generation of DNA methylation profiles in single cells. Nat. Biotechnol 36, 428–431 (2018). - PMC - PubMed
    1. Yin Y, Jiang Y, Lam K-WG, Berletch JB, Disteche CM, Noble WS, Steemers FJ, Camerini-Otero RD, Adey AC, Shendure J, High-Throughput Single-Cell Sequencing with Linear Amplification. Mol. Cell 76, 676–690 (2019). - PMC - PubMed

Publication types