. 2020 Nov 13;370(6518):eaba7721.
doi: 10.1126/science.aba7721.

A human cell atlas of fetal gene expression

Affiliations

A human cell atlas of fetal gene expression

Junyue Cao et al. Science. .

Abstract

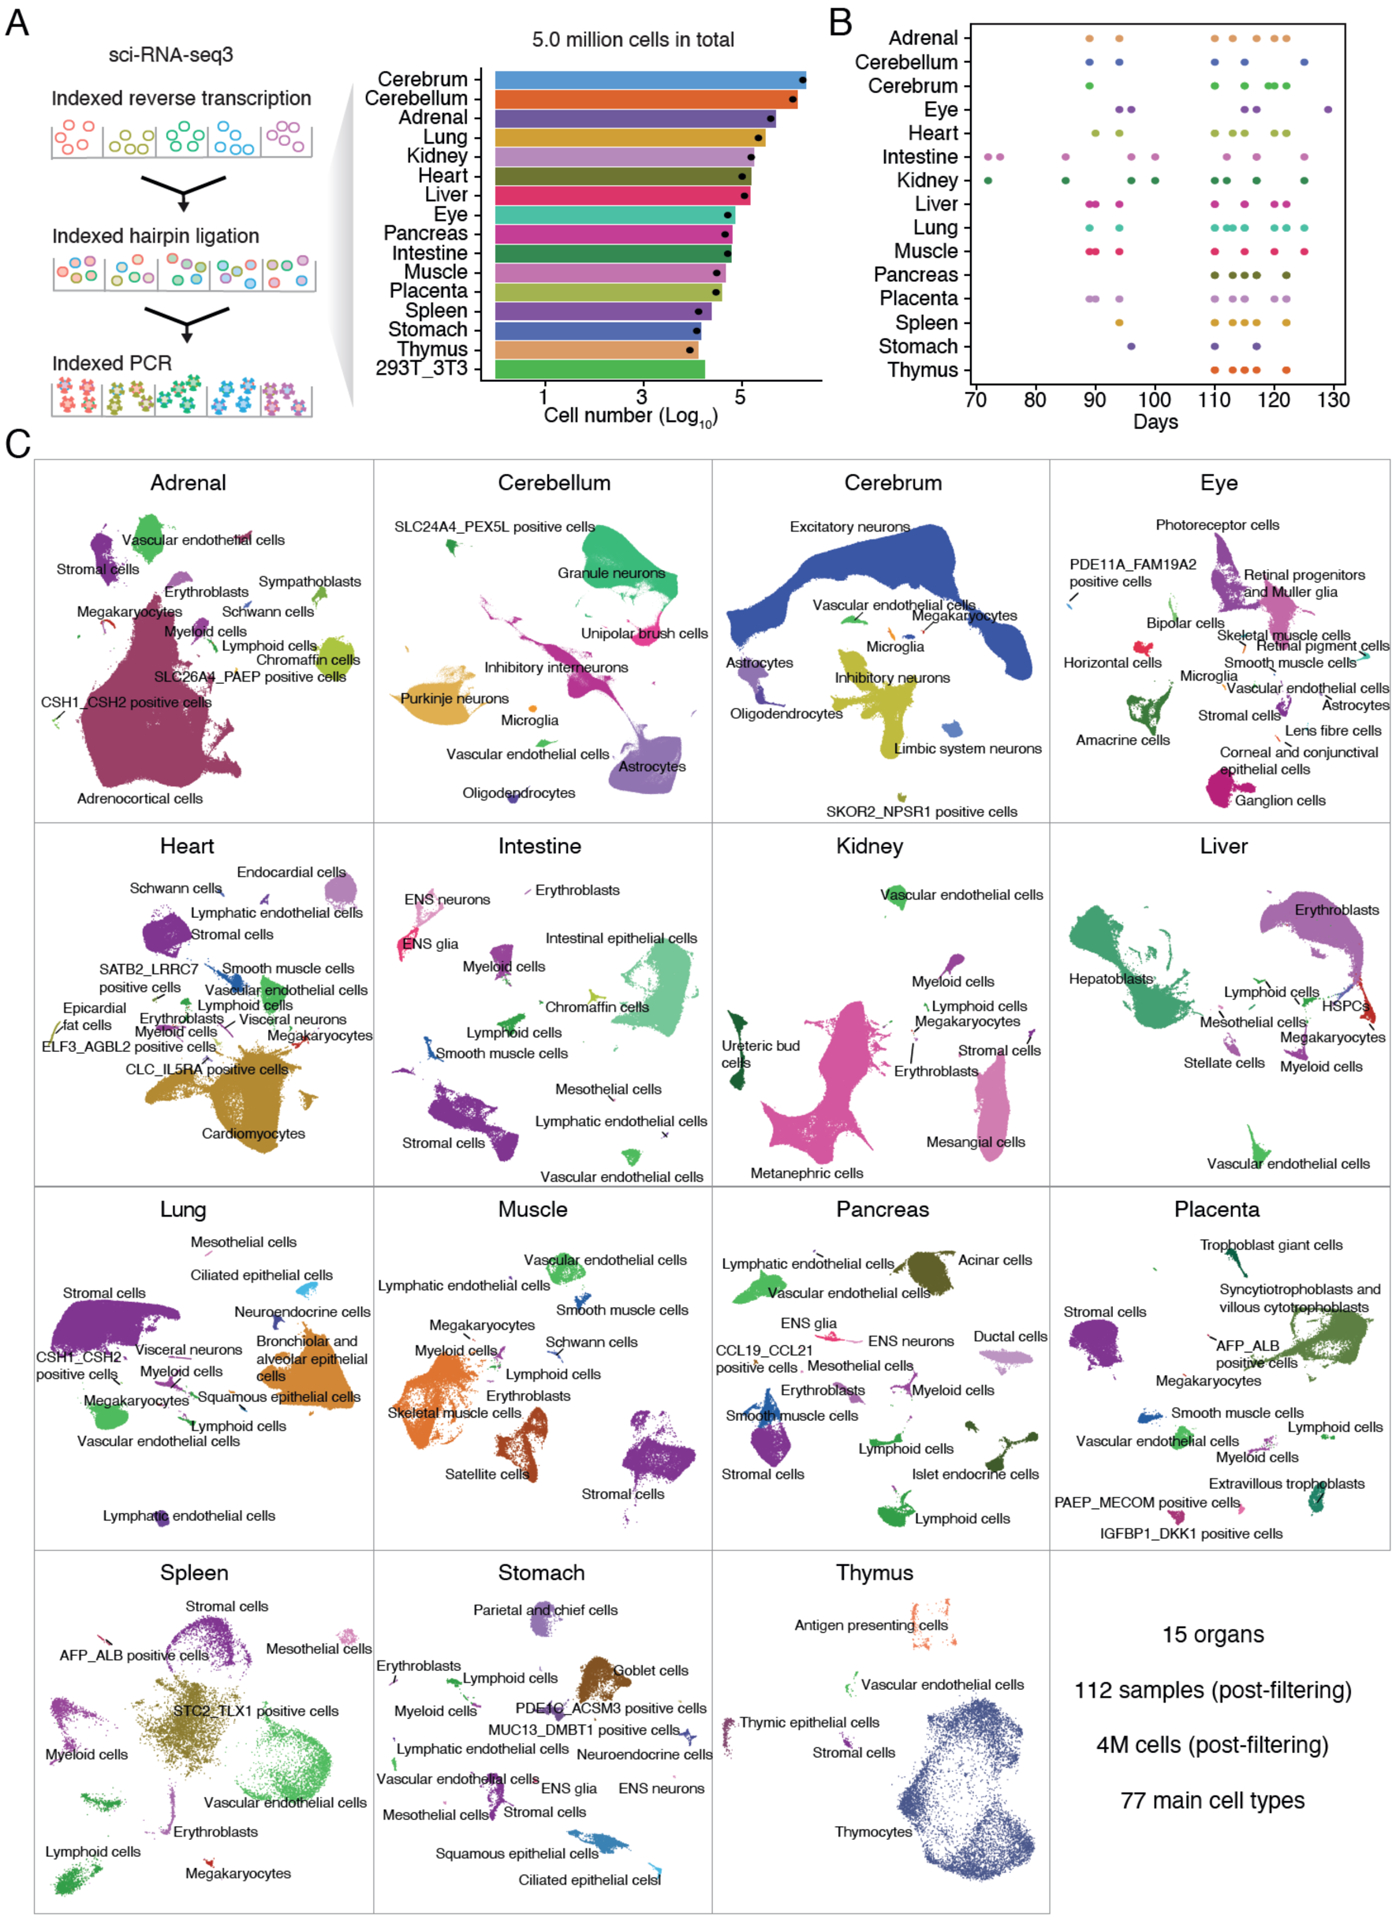
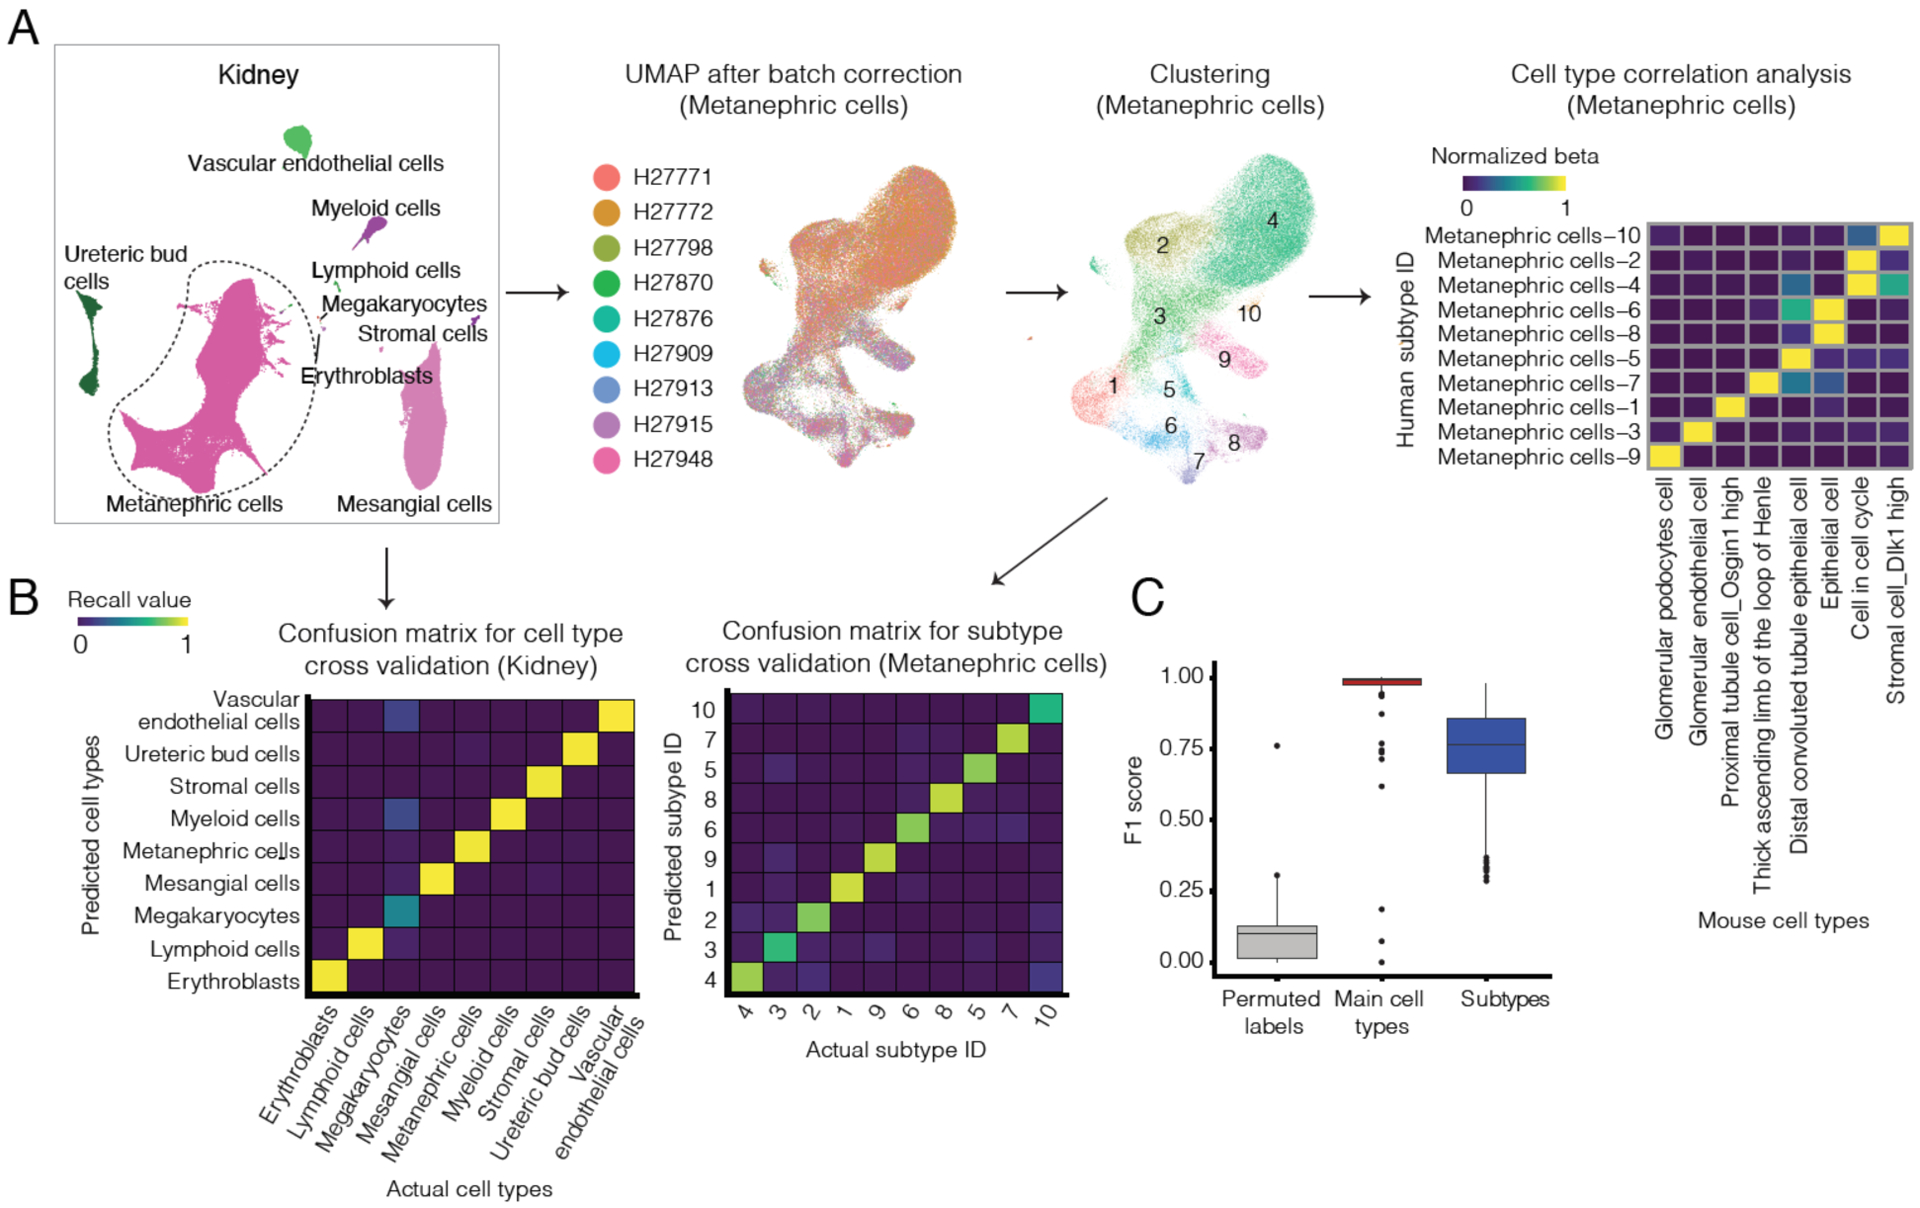
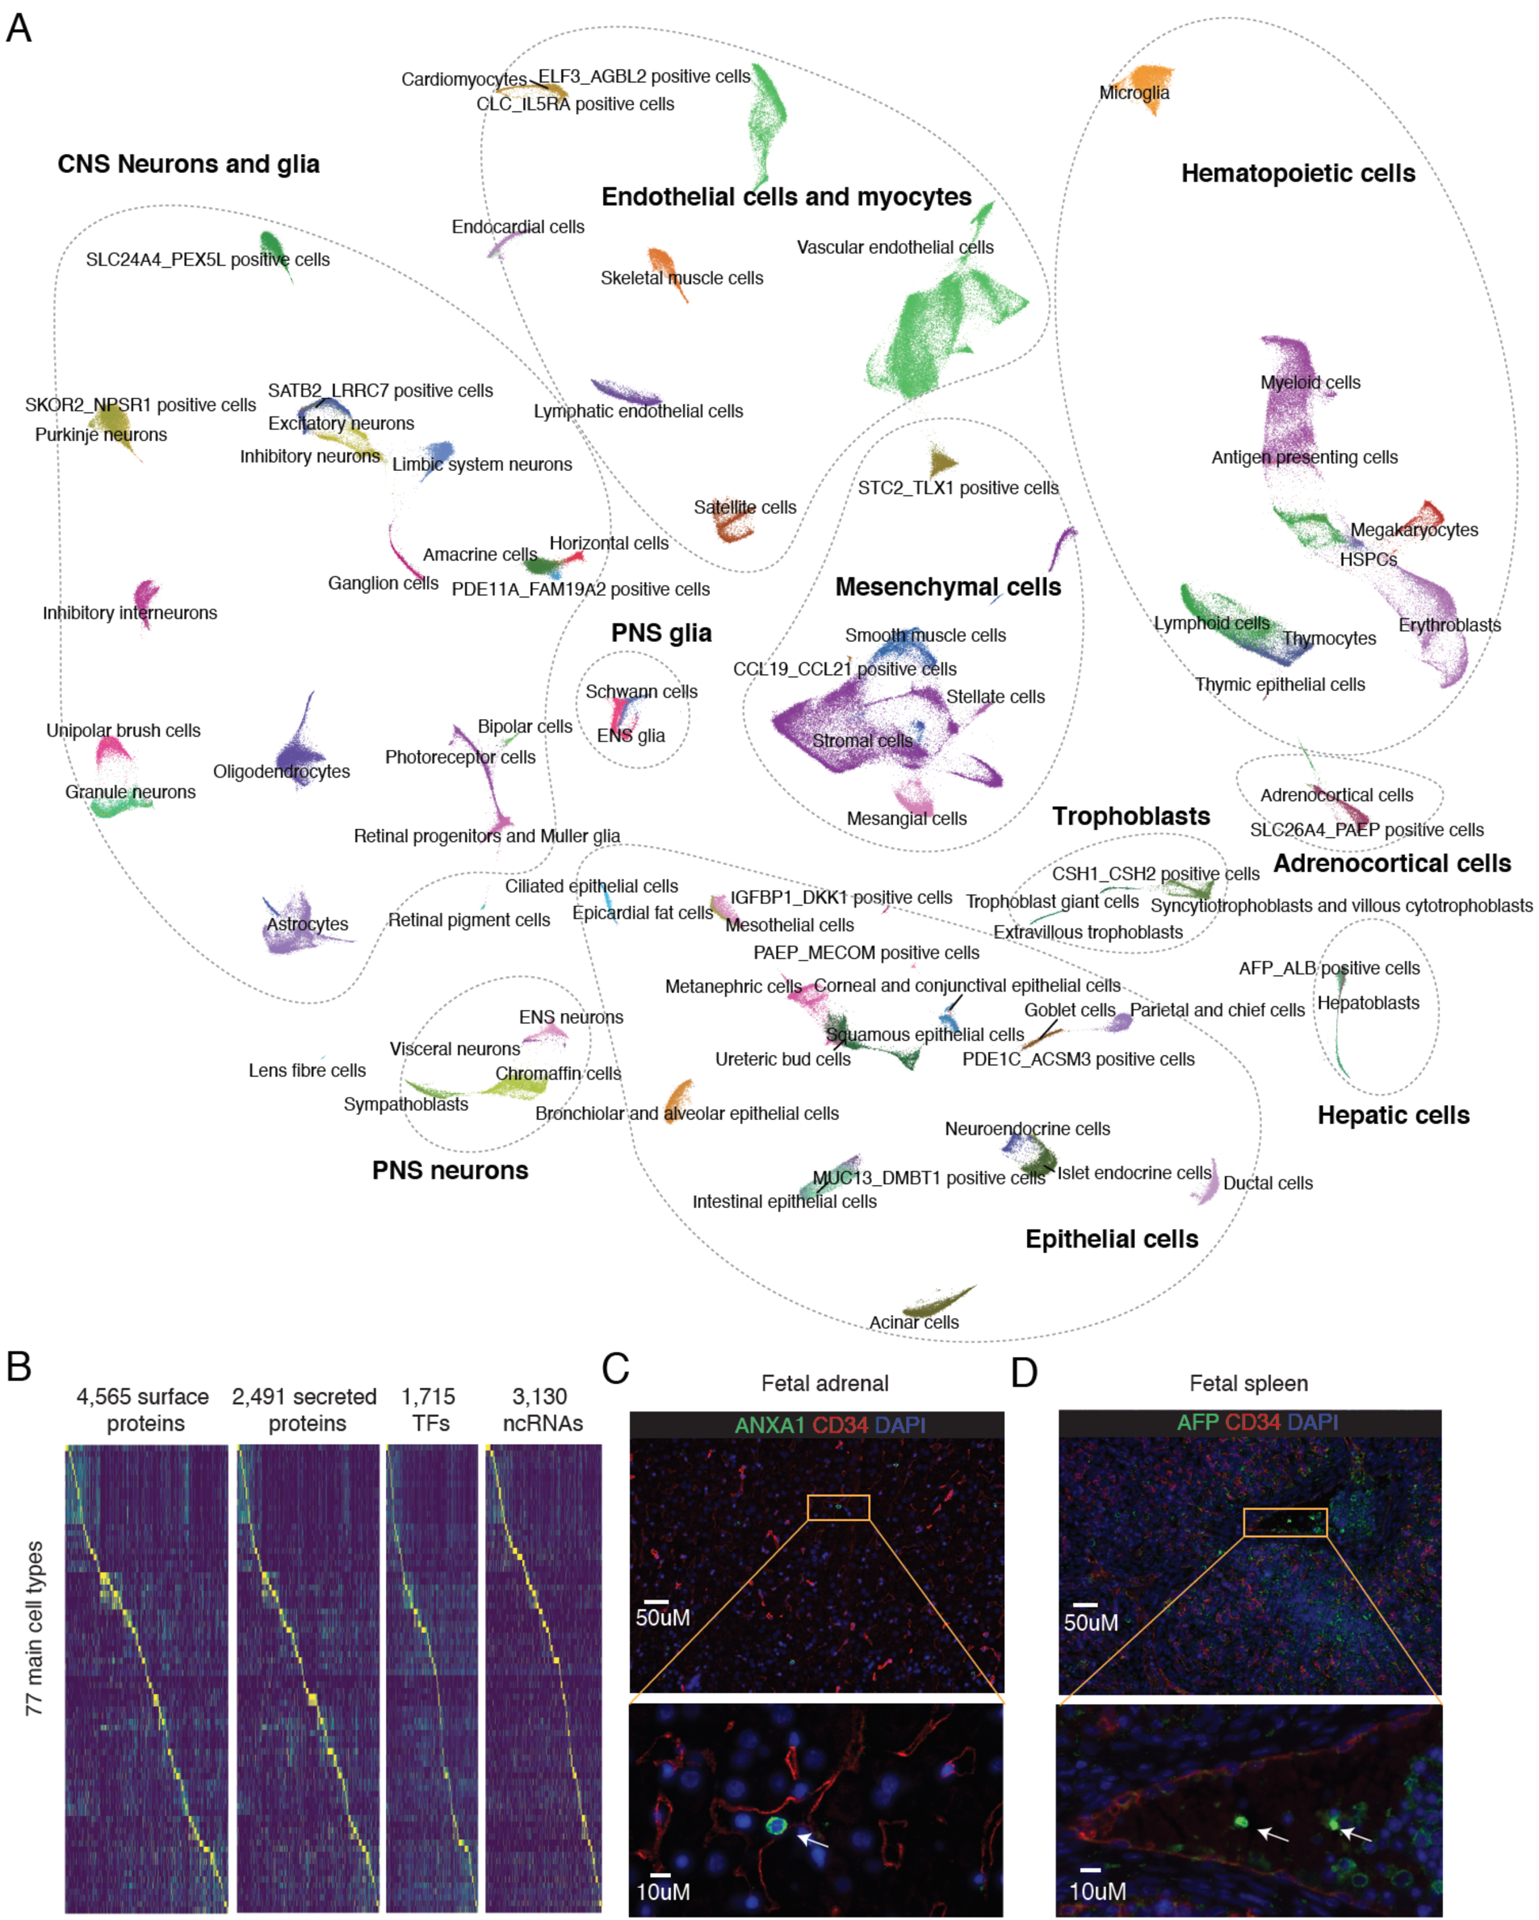
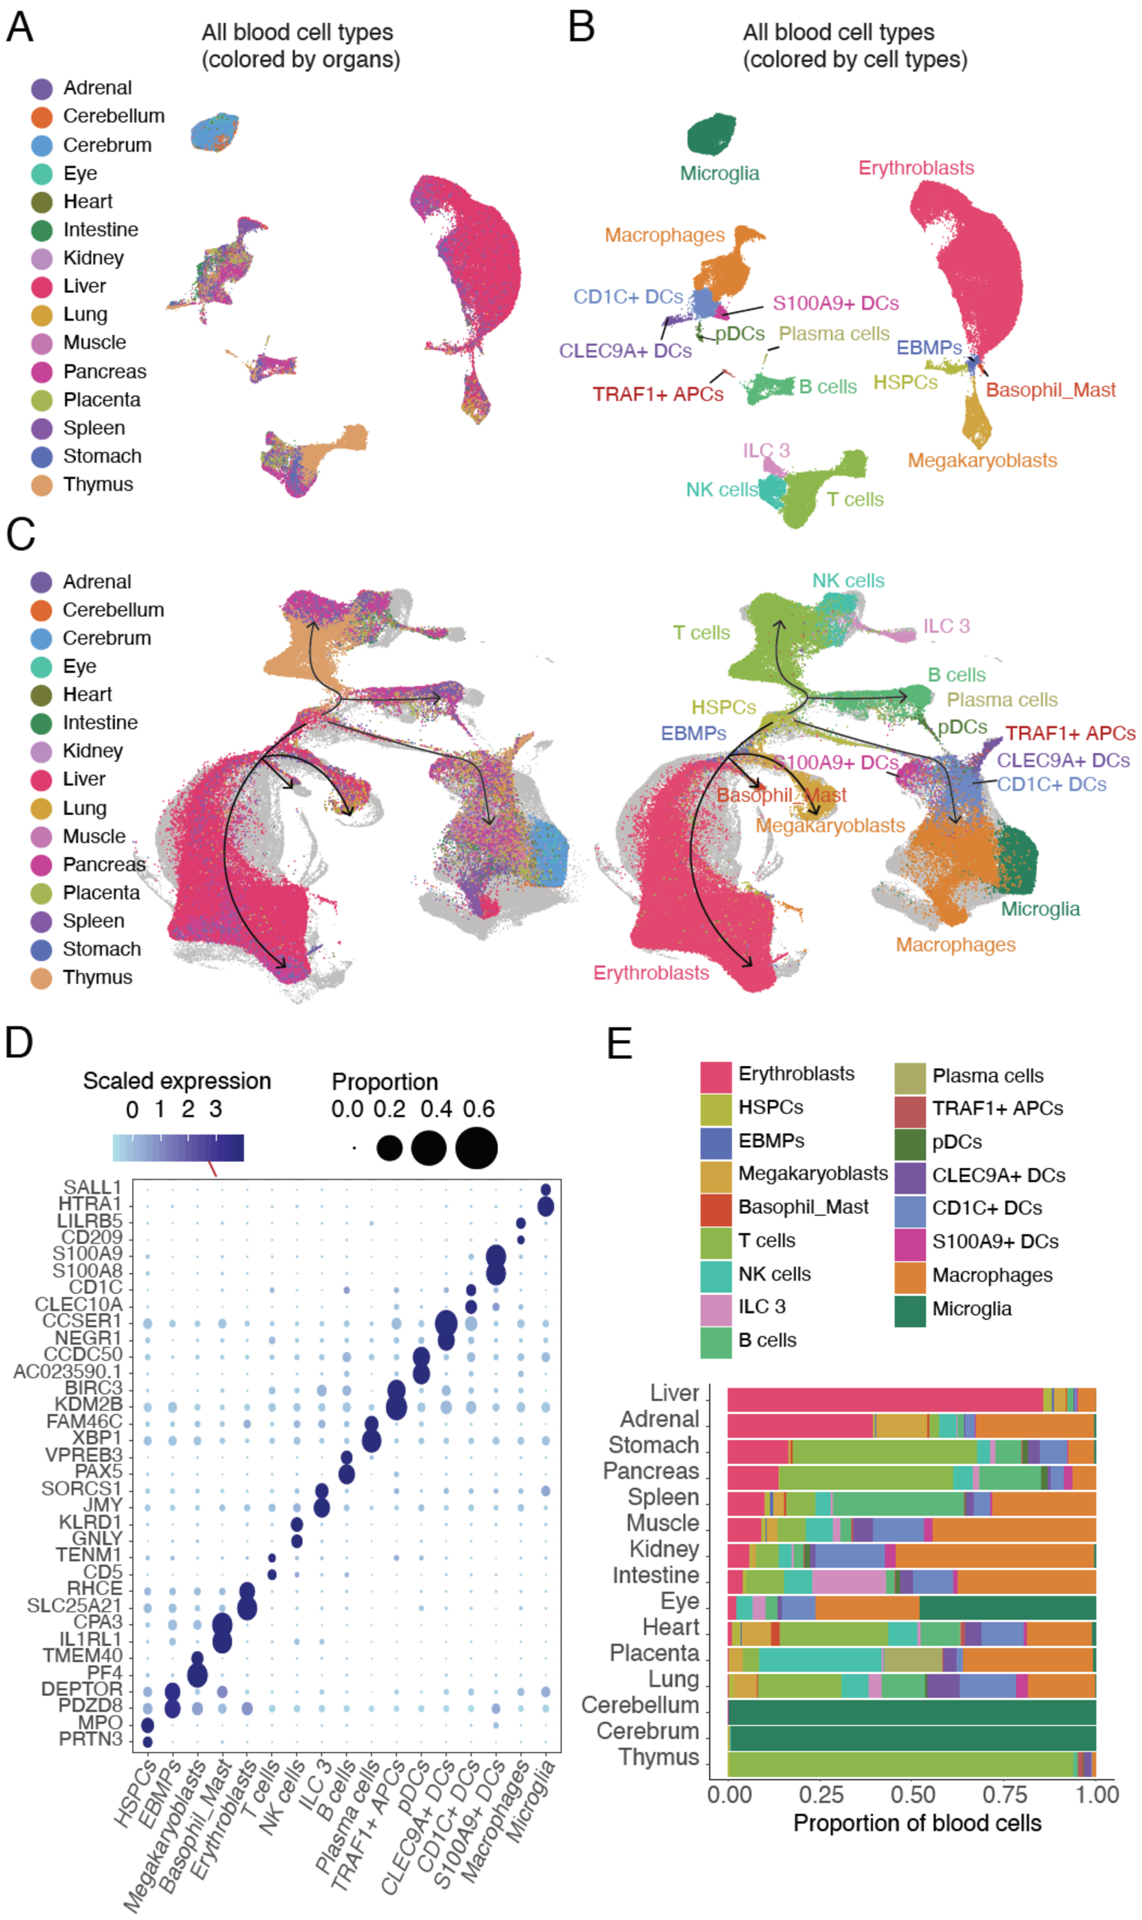
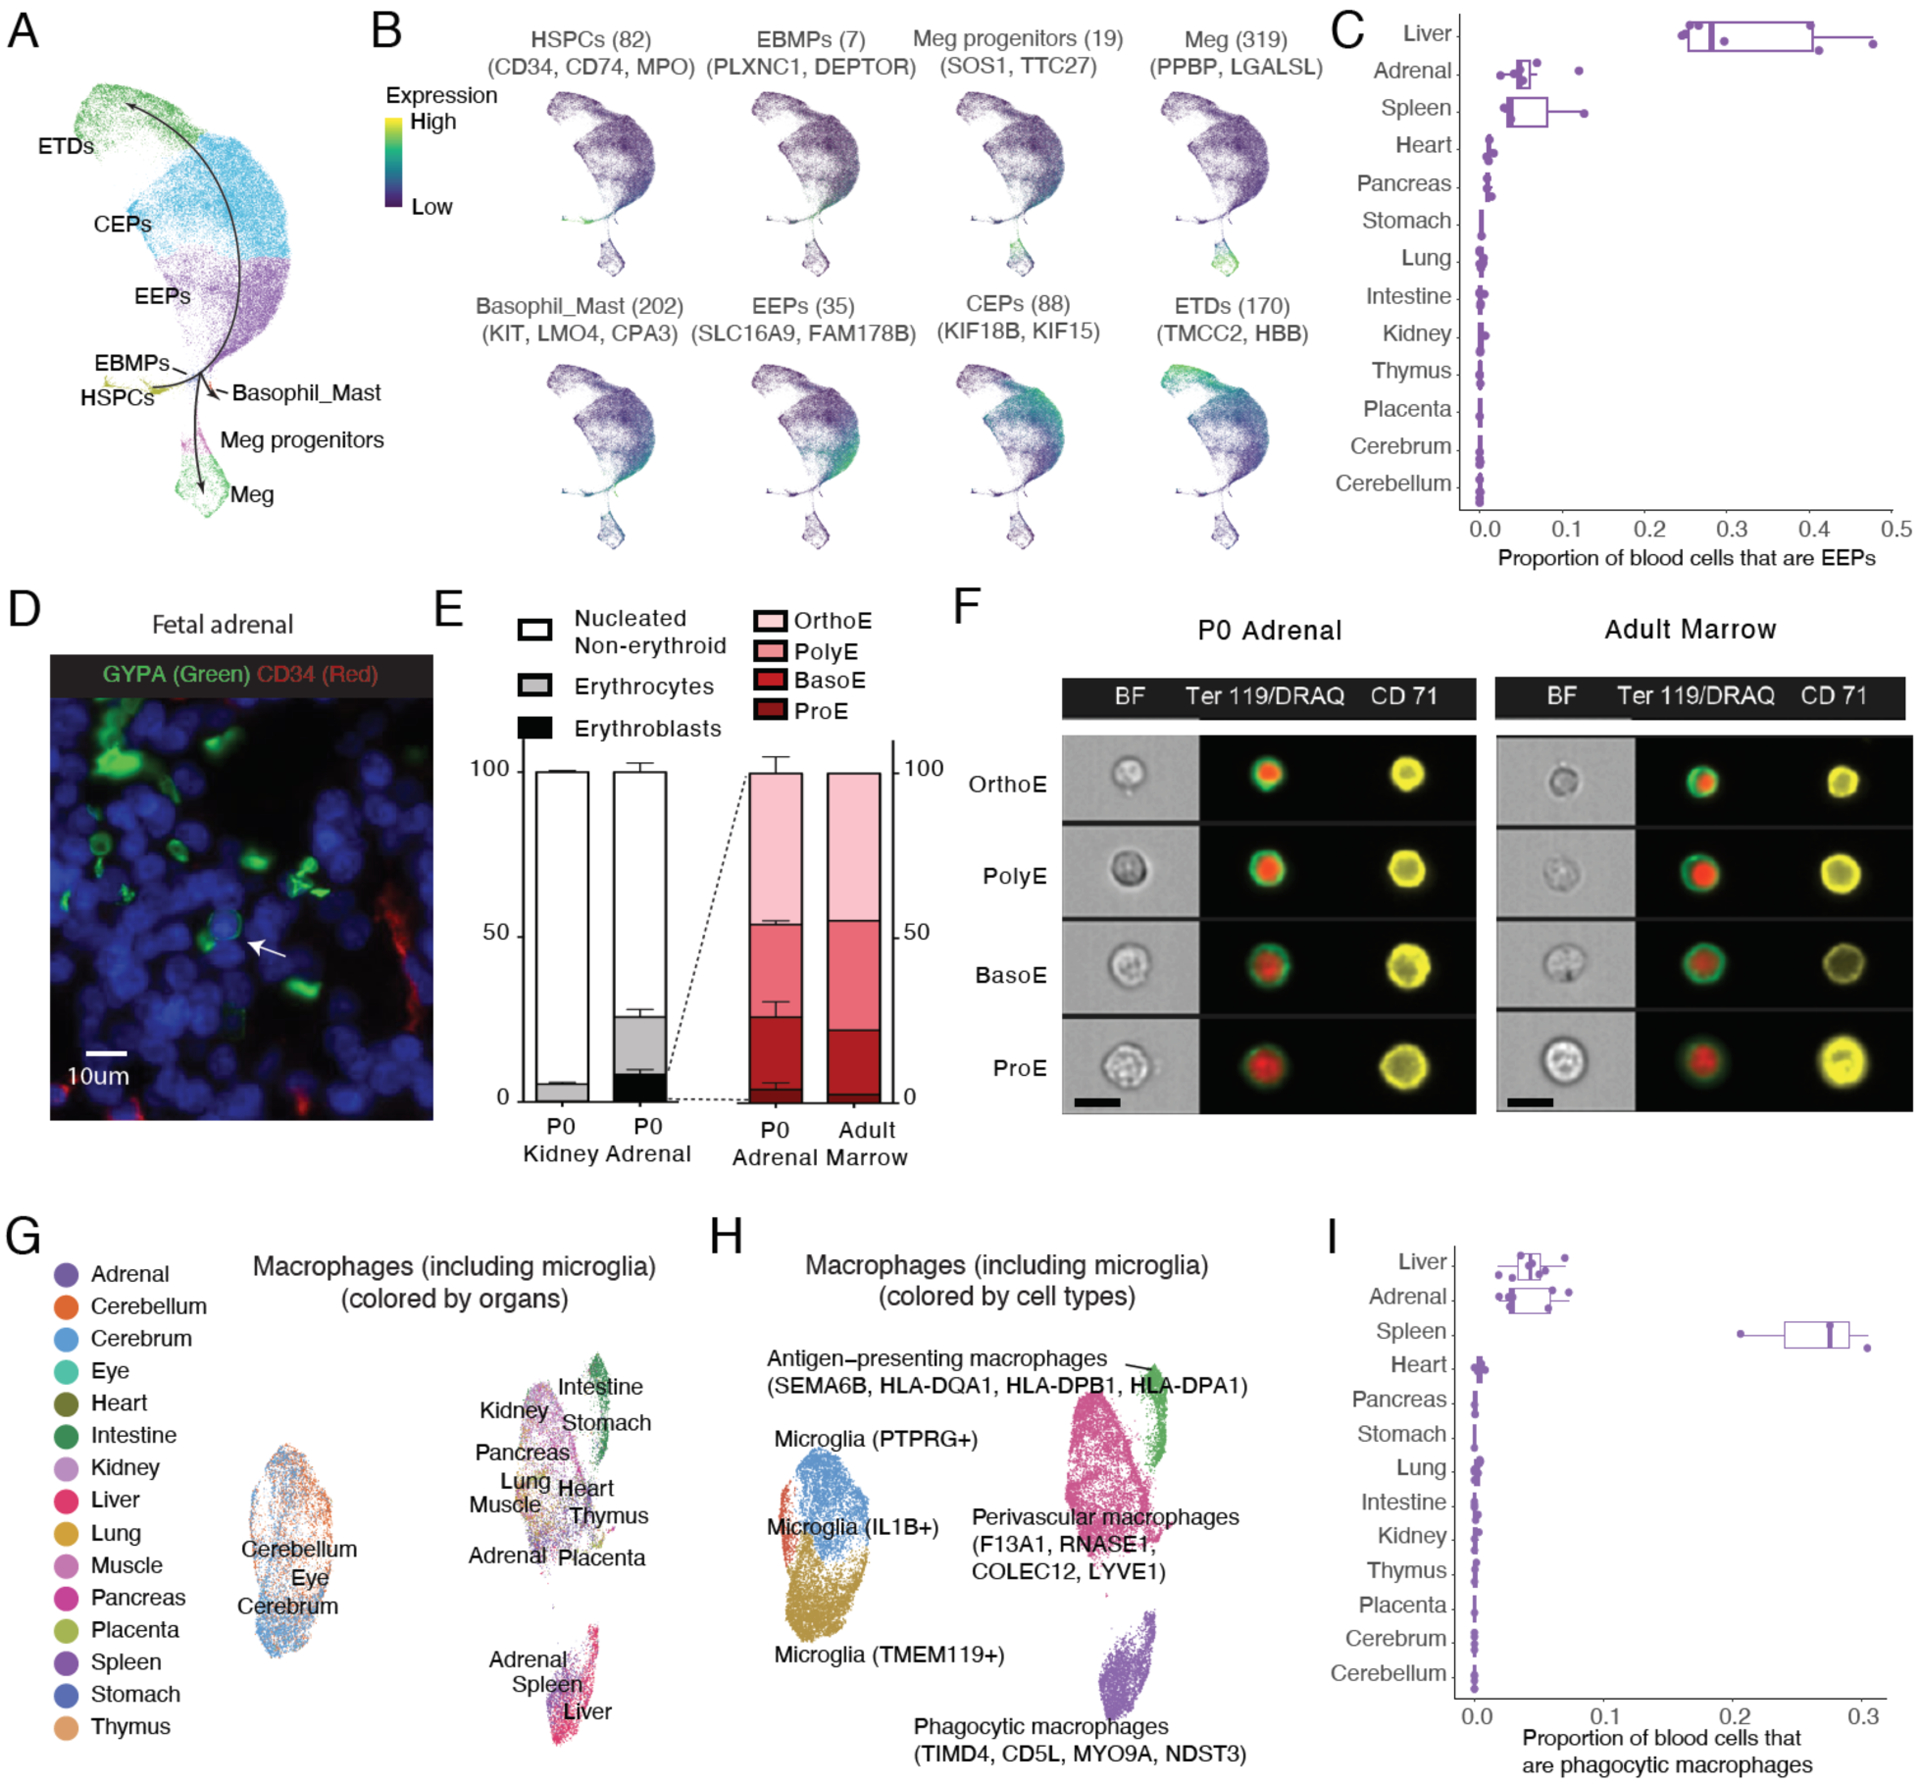
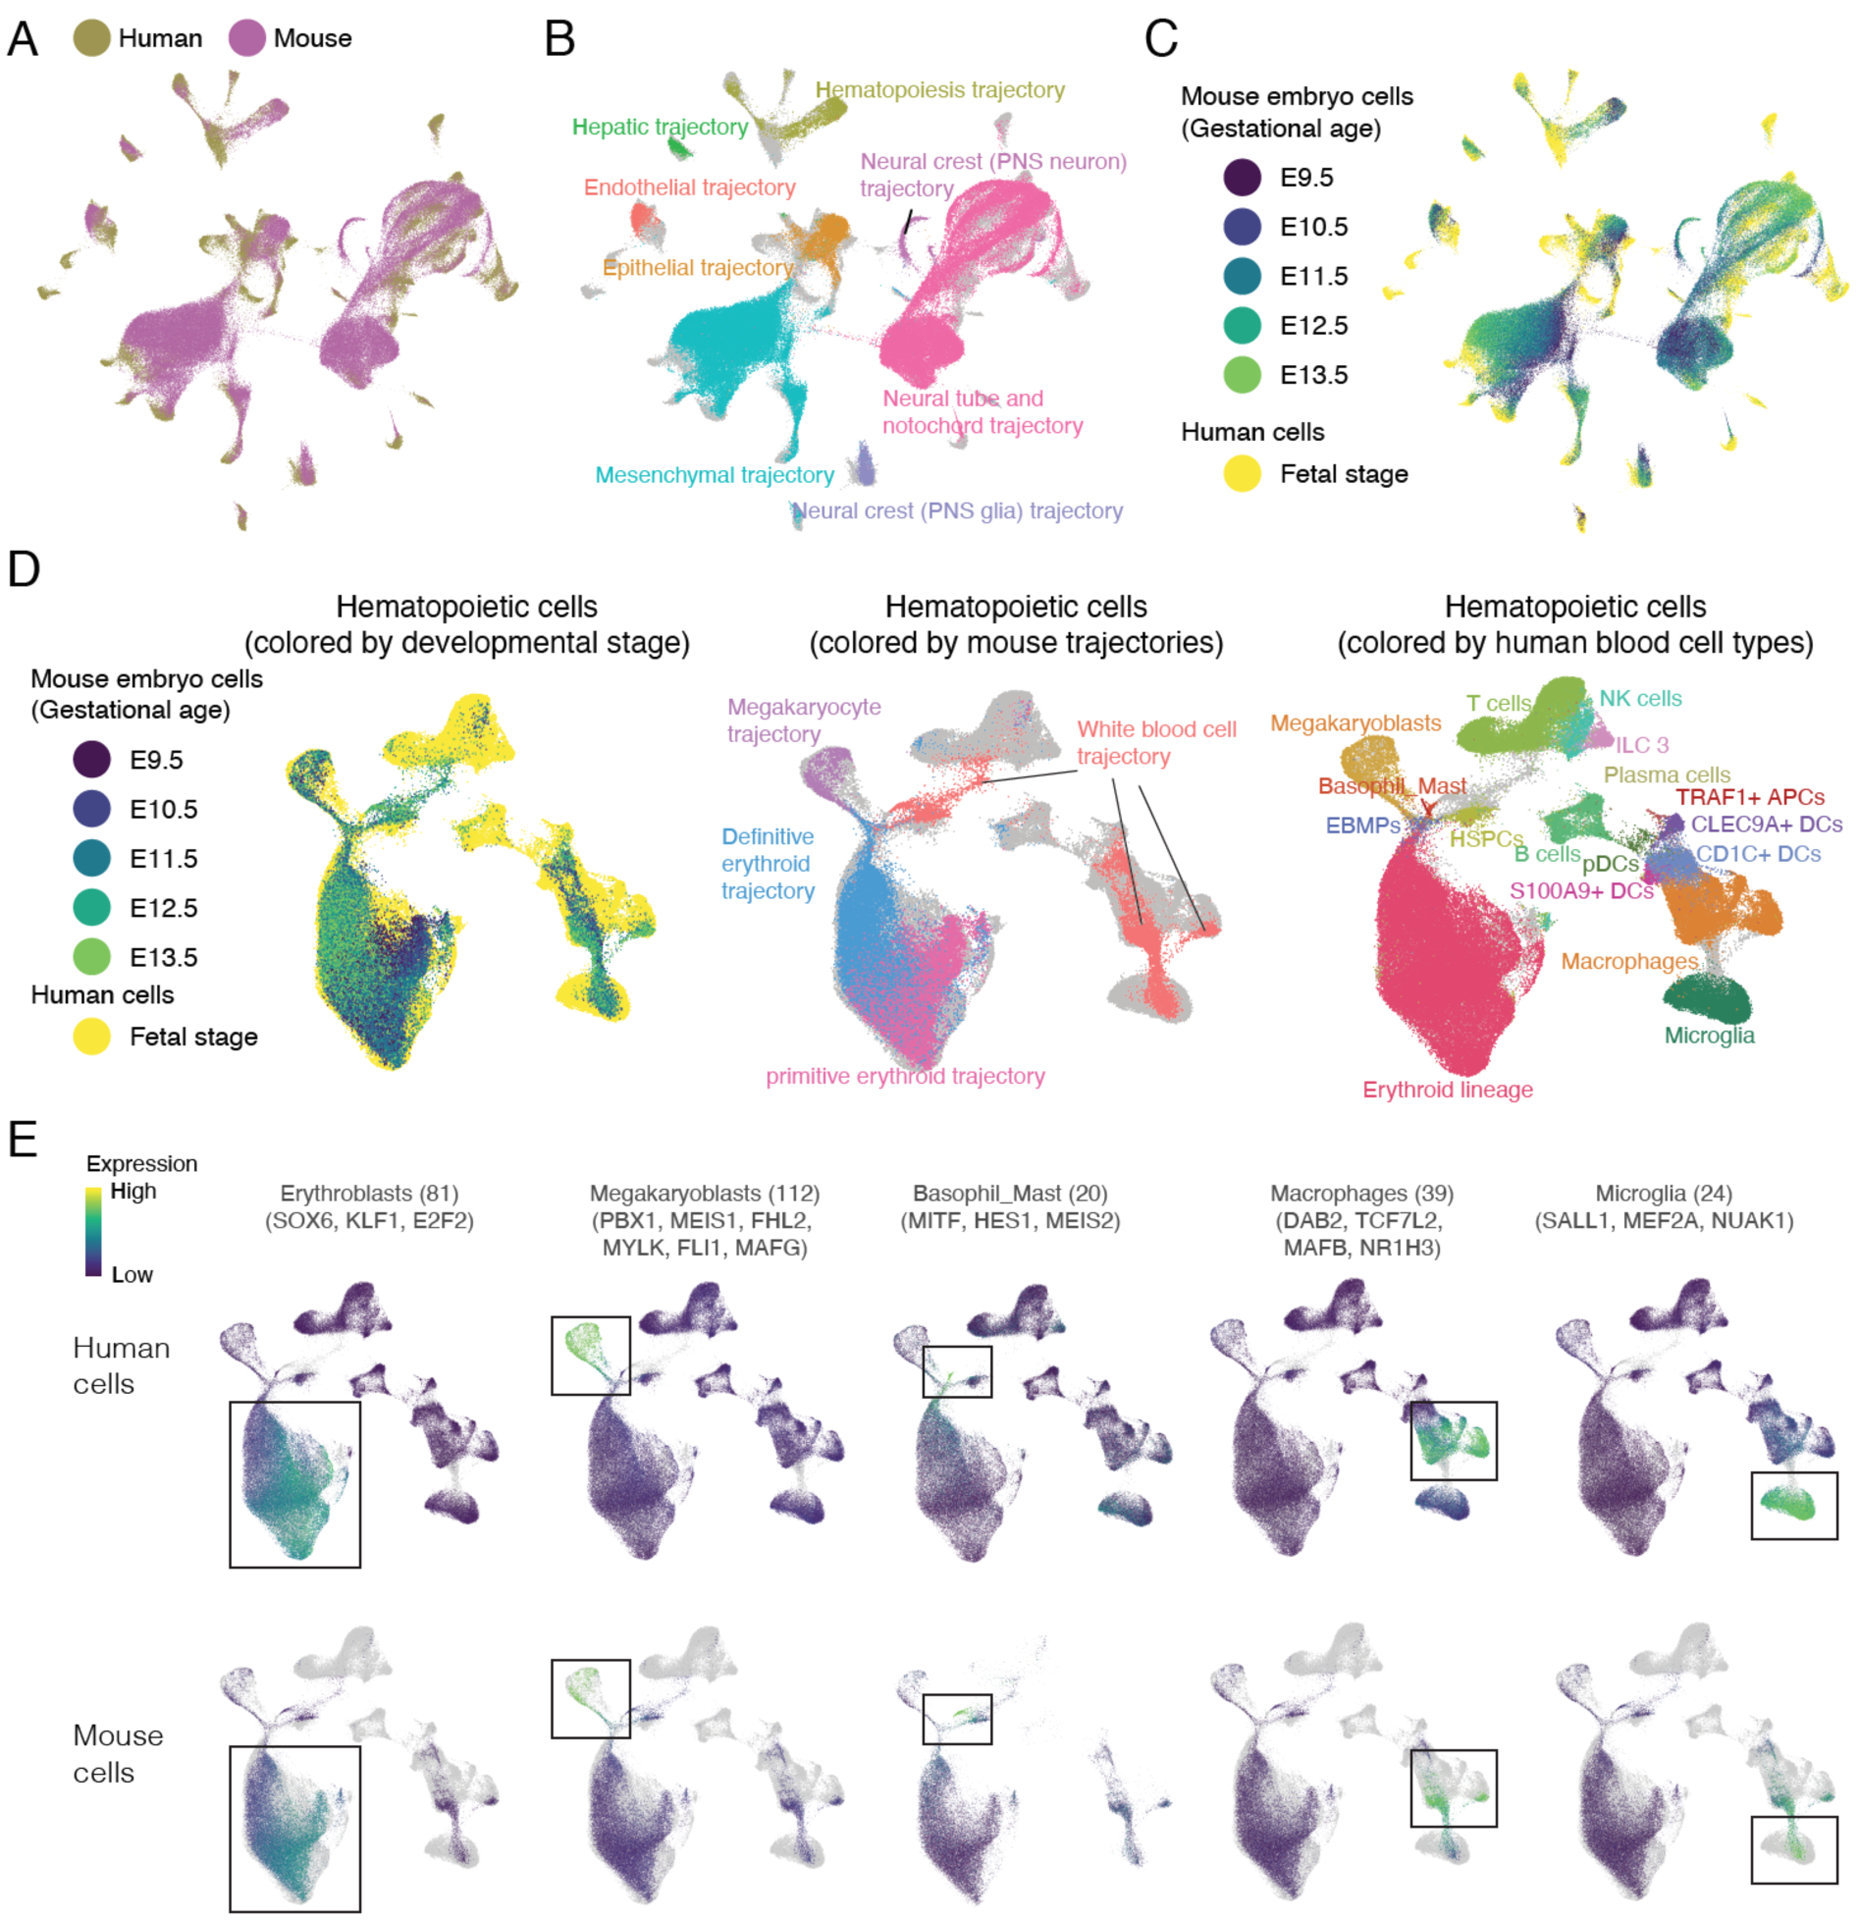
The gene expression program underlying the specification of human cell types is of fundamental interest. We generated human cell atlases of gene expression and chromatin accessibility in fetal tissues. For gene expression, we applied three-level combinatorial indexing to >110 samples representing 15 organs, ultimately profiling ~4 million single cells. We leveraged the literature and other atlases to identify and annotate hundreds of cell types and subtypes, both within and across tissues. Our analyses focused on organ-specific specializations of broadly distributed cell types (such as blood, endothelial, and epithelial), sites of fetal erythropoiesis (which notably included the adrenal gland), and integration with mouse developmental atlases (such as conserved specification of blood cells). These data represent a rich resource for the exploration of in vivo human gene expression in diverse tissues and cell types.


Conflict of interest statement

Competing interests: F.Z. and F.J.S. declare competing financial interests in the form of stock ownership and paid employment by Illumina, Inc. J.S. has competing financial interests (paid consulting and/or equity) with Guardant Health, Maze Therapeutics, Camp4 Therapeutics, Nanostring, Phase Genomics, Adaptive Biotechnologies, and Stratos Genomics. One or more embodiments of one or more patents and patent applications filed by Illumina and UW may encompass the methods, reagents, and data disclosed in this manuscript.

Figures

Figure 1.
Figure 1.. Data generation and identifying cell types across 15 human organs.
(A) Project workflow (left) and barplot (right) showing the number of cells profiled per organ on a log10 scale. Dots indicate the number of cells remaining for downstream analysis after QC filtering procedures. (B) Barplot showing the distribution of estimated post-conceptual ages for tissue samples corresponding to each organ. (C) After filtering against low-quality cells and doublet-enriched clusters, 4 million single cell gene expression profiles were subjected to UMAP visualization and Louvain clustering with Monocle 3 on a per-organ basis. Clusters were initially annotated on a per-organ basis as well, utilizing recent organ-specific cell atlas efforts, which yielded 172 main cell types (colors and labels). Because many cell type annotations appear in multiple organs (e.g. vascular endothelial cells), we consolidated these to 77 main cell types.
Figure 2.
Figure 2.. Identification of cell subtypes.
(A) Pipeline for cell subtype identification. Briefly, on a tissue-by-tissue basis, we subjected each main cell type with >1,000 cells to batch correction (102), UMAP visualization and Louvain clustering. Clusters with similar transcriptomes were merged by an automated procedure. Briefly, we applied an intra-dataset cross validation approach (101) to evaluate their specificity and iteratively merged similar clusters. We then compared putative human cell subtypes identified in our data (rows) against annotated mouse cell types from the corresponding tissues (16) (columns) by cell type correlation analysis. Colors correspond to beta values, normalized by the maximum beta value per row. All MCA cell types with a beta of a matched human cell type > 0.01, that is also the maximum beta for that human cell type, are shown for the kidney metanephric cells. (B) Confusion matrix for intra-dataset cell type cross-validation with an SVM classifier for main cell types (left) and metanephric subtypes (right) in the kidney. 2,000 cells (or all cells for cell types with less than 2,000 cells profiled) are randomly sampled for each cell type or subtype before cross-validation analysis. (C) Box plot showing the cell specificity score (F1 score) distribution for permuted controls, main cell types and subtypes, from intra-dataset cross validation.
Figure 3.
Figure 3.. Integrated visualization of cell types across all profiled tissues.
(A) From each organ, we sampled 5,000 cells from each cell type (or all cells for cell types with fewer than 5,000 cells in a given organ). These were subjected to UMAP visualization on the basis of the top differentially expressed genes across cell types within each organ. Here they are colored by cell type labels, with colors as in Fig. 1C. In Fig. S10A, the same UMAP visualization is colored by tissue-of-origin. (B) Heatmap showing the relative expression of surface and secreted protein-coding genes, non-coding RNAs, and TFs (columns) in 77 main cell types (rows). UMI counts for genes are scaled for library size, log-transformed, and then mapped to Z scores and capped to [0, 3]. (C-D) Representative fluorescence microscopy of human fetal adrenal (C) or spleen (D) tissue, staining for for endothelium (CD34+), CSH1+, CSH2+ cells (ANXA1+; labeled by arrowhead) (C) or AFP+, ALB+ cells (AFP+ and labeled by arrowhead) (D). Nuclei are stained with blue DAPI. Bottom panels correspond to inset zooms. Scale bars, 50 μm (top) and 10 μm (bottom).
Figure 4.
Figure 4.. Identification and characterization of blood cell subtypes and developmental trajectories.
(A-B) UMAP visualization and marker-based annotation of blood cell types colored by organ type (A) and cell type (B). (C) UMAP visualization of blood cells, integrating across all profiled organs of this study and an scRNA-seq atlas of blood cells from human fetal liver (108). Cells from (108) are colored in light grey, while cells from our study are colored by tissue of origin (left) or blood cell types (right). Black arrows indicate inferred cell state transition directions from HSPCs to all main blood lineages. (D) Dotplot showing expression of two selected marker genes per cell type. The size of the dot encodes the % of cells within a cell type in which that marker was detected, and its color encodes the average expression level. (E) Barplot showing the estimated fraction of cells per organ derived from each of the 17 annotated blood cell types.
Figure 5.
Figure 5.. Identification and characterization of erythropoiesis and macrophage differentiation in adrenal gland.
(A) Zoomed view of the erythropoiesis trajectory portion of Fig. 4B, colored by erythroid or megakaryocyte subtype. Black arrows show trajectory directionalities defined by (123). (B) Plots similar to (A), colored by the normalized expression of cell type-specific genes (FDR of 0.05 and over 2-fold expression difference between first and second ranked cell type), with the number of cell type-specific genes used and names of top few genes shown. UMI counts for these genes are scaled for library size, log-transformed, aggregated and then mapped to Z scores. (C) Point and box plot showing the proportion of blood cells that are EEPs for individual samples of different organs. Samples with low recovery of blood cells (<= 200) are excluded. (D) Representative fluorescence microscopy of human fetal adrenal tissue, staining for endothelium (CD34+) and erythroblasts (nucleated and GYPA+); nuclei stained with blue DAPI. The arrow indicates an GYPA+ erythroblast outside a CD34+ blood vessel. Scale bars, 10 μm. (E) Left: percentage of dissociated kidney and adrenal glands from newborn (P0) mice composed of enucleated erythrocytes and maturing erythroblasts. Right: distribution of maturing erythroblasts (proerythroblasts, ProE; basophilic erythroblasts, BasoE; polychromatophilic erythroblasts, PolyE; and orthochromatic erythroblasts, OrthoE) in the adrenal gland at P0 and in adult bone marrow. Error bars represent mean + SEM, n=3. (F) Representative images of maturing erythroblasts in the P0 adrenal gland and the adult bone marrow. Size bar = 10 μm. (G-H) UMAP visualization and marker-based annotation of macrophage subtypes colored by organ type (G) and subtype name (H). (I) Point and box plot showing the proportion of blood cells that are phagocytic macrophages for individual samples of different organs. Samples with low recovery of blood cells (<= 200) are excluded.
Figure 6.
Figure 6.. Integration of human fetal and mouse embryonic cell atlases.
(A-C) After downsampling as described in the text, we applied Seurat (15) to jointly analyze human fetal and mouse embryonic cells (11). (A) Cells are colored by source species. (B) Mouse cells are colored by the identity of the main mouse embryonic trajectory (11). Human cells are colored in grey. (C) Cells are colored by source and development stage. Within each major trajectory and as previously (11), mouse cells order by successive time points, and human fetal cells appear to project from the last (E13.5) mouse embryonic time point. (D) We applied Seurat (15) to jointly analyze 103,766 human and 40,606 mouse hematopoietic cells. The same UMAP visualization is shown in all panels. Left: Cells are colored by source and development stage. Middle: Mouse cells are colored by the identity of mouse sub-trajectory (11). Human cells are colored in grey. Right: Human cells are colored according to annotations from Fig. 4B. Mouse cells are colored in grey. (E) Plot similar to (D), colored by the normalized expression of human-mouse conserved cell type-specific genes, with their number listed and top TFs named. UMI counts for these genes are scaled for library size, log-transformed, aggregated and then mapped to Z scores.

Comment in

Similar articles

  • A human cell atlas of fetal chromatin accessibility.
    Domcke S, Hill AJ, Daza RM, Cao J, O'Day DR, Pliner HA, Aldinger KA, Pokholok D, Zhang F, Milbank JH, Zager MA, Glass IA, Steemers FJ, Doherty D, Trapnell C, Cusanovich DA, Shendure J. Domcke S, et al. Science. 2020 Nov 13;370(6518):eaba7612. doi: 10.1126/science.aba7612. Science. 2020. PMID: 33184180 Free PMC article.
  • A single-cell atlas of chromatin accessibility in the human genome.
    Zhang K, Hocker JD, Miller M, Hou X, Chiou J, Poirion OB, Qiu Y, Li YE, Gaulton KJ, Wang A, Preissl S, Ren B. Zhang K, et al. Cell. 2021 Nov 24;184(24):5985-6001.e19. doi: 10.1016/j.cell.2021.10.024. Epub 2021 Nov 12. Cell. 2021. PMID: 34774128 Free PMC article.
  • Single cell dual-omic atlas of the human developing retina.
    Zuo Z, Cheng X, Ferdous S, Shao J, Li J, Bao Y, Li J, Lu J, Jacobo Lopez A, Wohlschlegel J, Prieve A, Thomas MG, Reh TA, Li Y, Moshiri A, Chen R. Zuo Z, et al. Nat Commun. 2024 Aug 9;15(1):6792. doi: 10.1038/s41467-024-50853-5. Nat Commun. 2024. PMID: 39117640 Free PMC article.
  • Considerations for building and using integrated single-cell atlases.
    Hrovatin K, Sikkema L, Shitov VA, Heimberg G, Shulman M, Oliver AJ, Mueller MF, Ibarra IL, Wang H, Ramírez-Suástegui C, He P, Schaar AC, Teichmann SA, Theis FJ, Luecken MD. Hrovatin K, et al. Nat Methods. 2025 Jan;22(1):41-57. doi: 10.1038/s41592-024-02532-y. Epub 2024 Dec 13. Nat Methods. 2025. PMID: 39672979 Review.
  • More than a decade of developmental gene expression atlases: where are we now?
    de Boer BA, Ruijter JM, Voorbraak FP, Moorman AF. de Boer BA, et al. Nucleic Acids Res. 2009 Dec;37(22):7349-59. doi: 10.1093/nar/gkp819. Nucleic Acids Res. 2009. PMID: 19822576 Free PMC article. Review.

Cited by

References

    1. de Bakker BS, de Jong KH, Hagoort J, de Bree K, Besselink CT, de Kanter FEC, Veldhuis T, Bais B, Schildmeijer R, Ruijter JM, Oostra R-J, Christoffels VM, Moorman AFM, An interactive three-dimensional digital atlas and quantitative database of human development. Science. 354 (2016), doi:10.1126/science.aag0053. - DOI - PubMed
    1. Yamada S, Samtani RR, Lee ES, Lockett E, Uwabe C, Shiota K, Anderson SA, Lo CW, Developmental atlas of the early first trimester human embryo. Dev. Dyn 239, 1585–1595 (2010). - PMC - PubMed
    1. Jirasek JE, An Atlas of the Human Embryo and Fetus: A Photographic Review of Human Prenatal Development (CRC Press, 2000).
    1. McKusick VA, Mendelian Inheritance in Man and its online version, OMIM. Am. J. Hum. Genet 80, 588–604 (2007). - PMC - PubMed
    1. Mefford HC, Batshaw ML, Hoffman EP, Genomics, intellectual disability, and autism. N. Engl. J. Med 366, 733–743 (2012). - PMC - PubMed

Publication types