. 2020 Nov 12;11(11):973.
doi: 10.1038/s41419-020-03187-1.

Engineering of α-PD-1 antibody-expressing long-lived plasma cells by CRISPR/Cas9-mediated targeted gene integration

Affiliations

Engineering of α-PD-1 antibody-expressing long-lived plasma cells by CRISPR/Cas9-mediated targeted gene integration

Baohong Luo et al. Cell Death Dis. .

Abstract

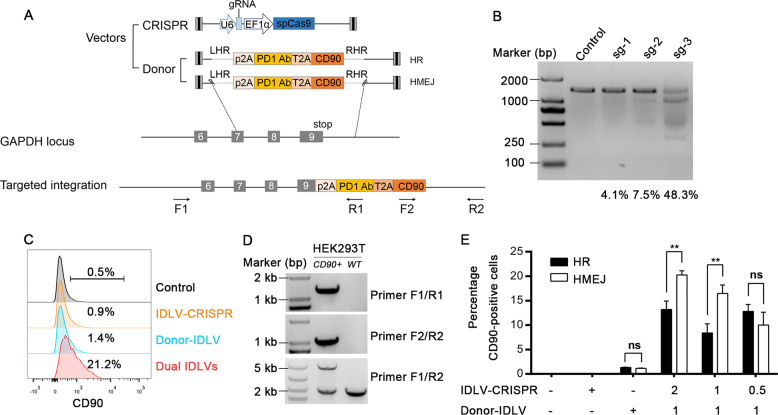
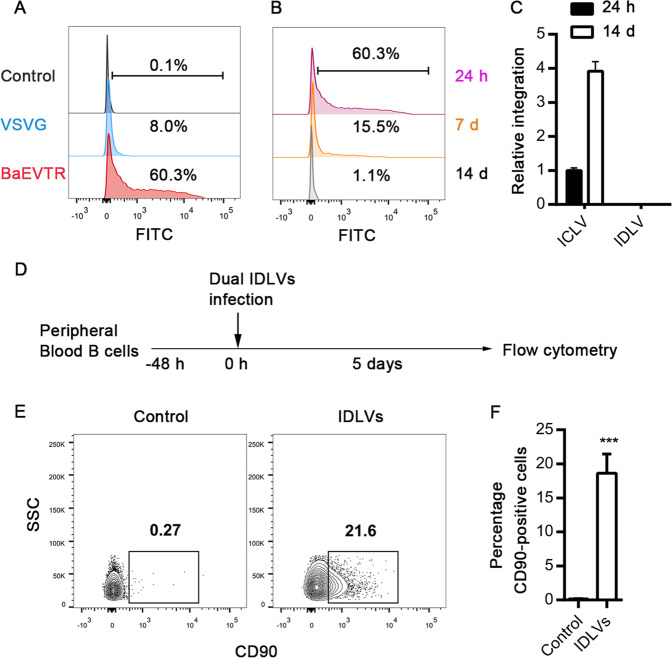
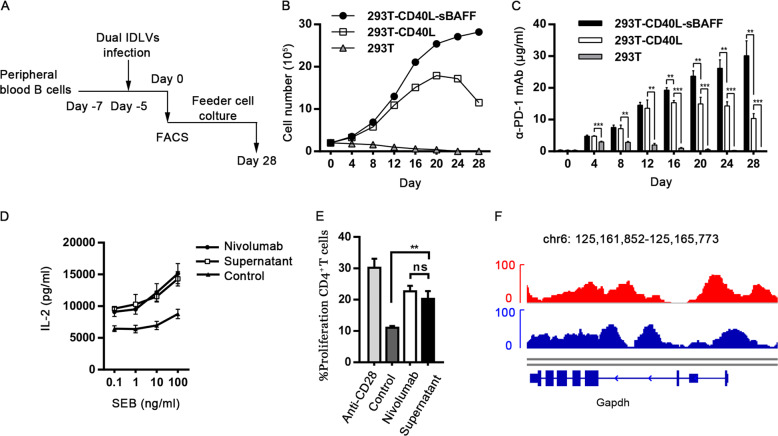
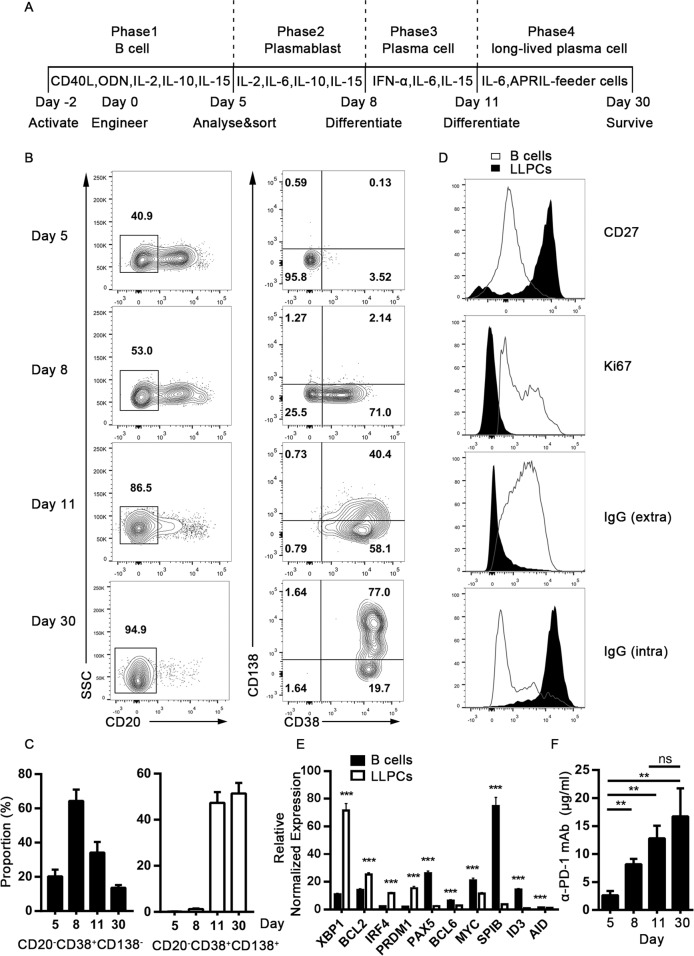
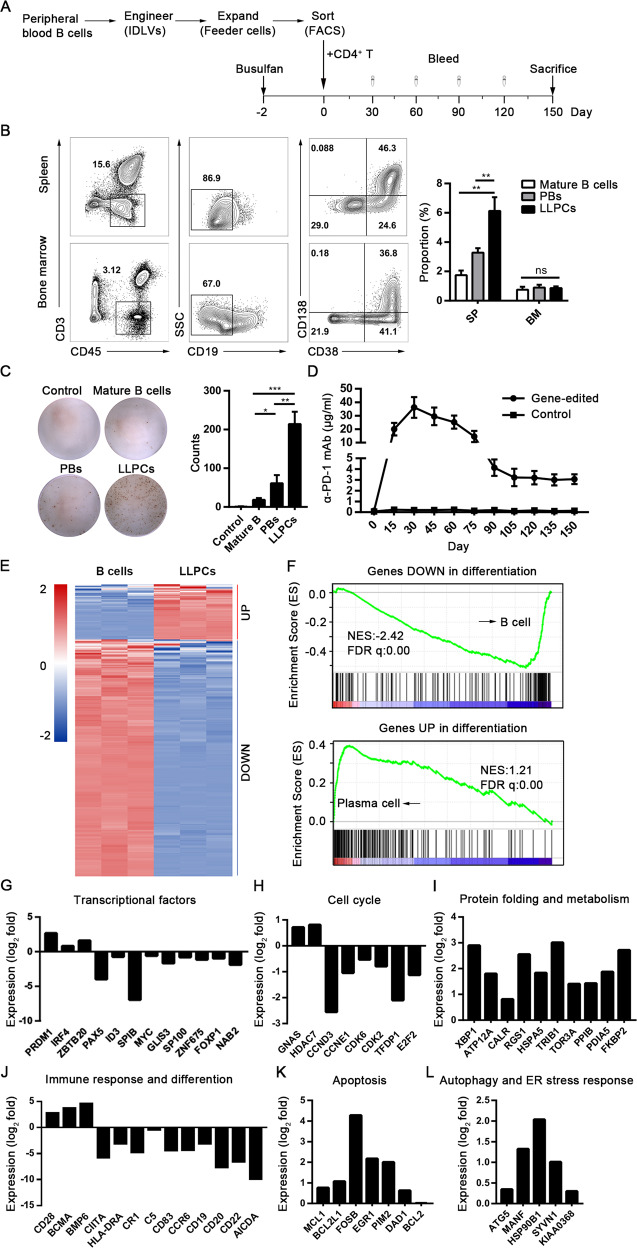
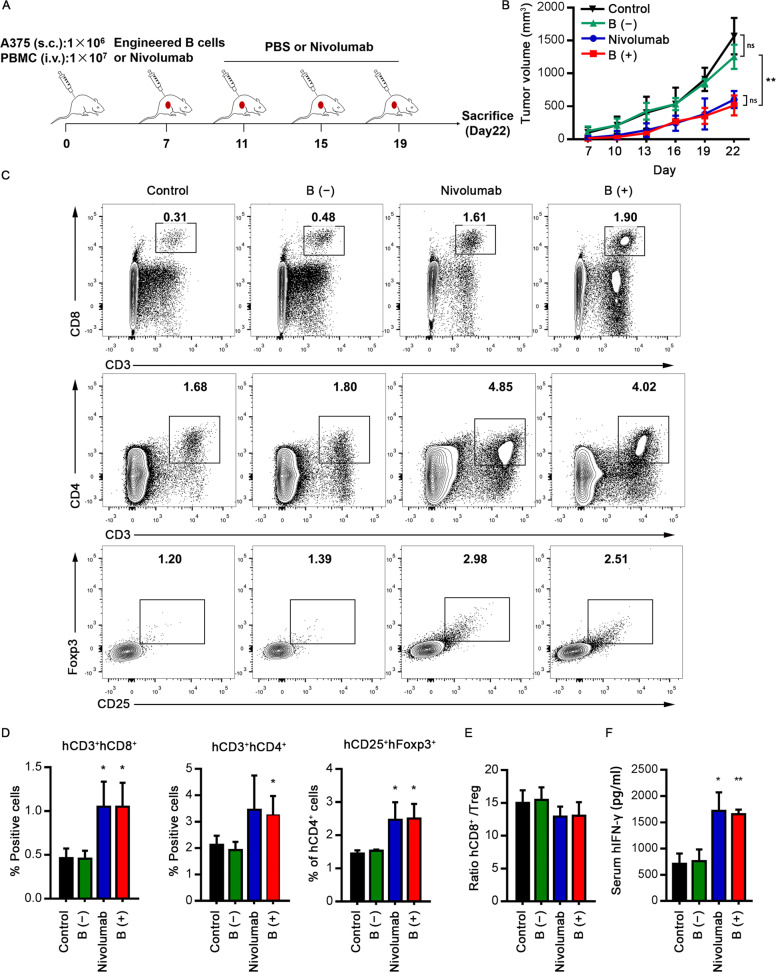
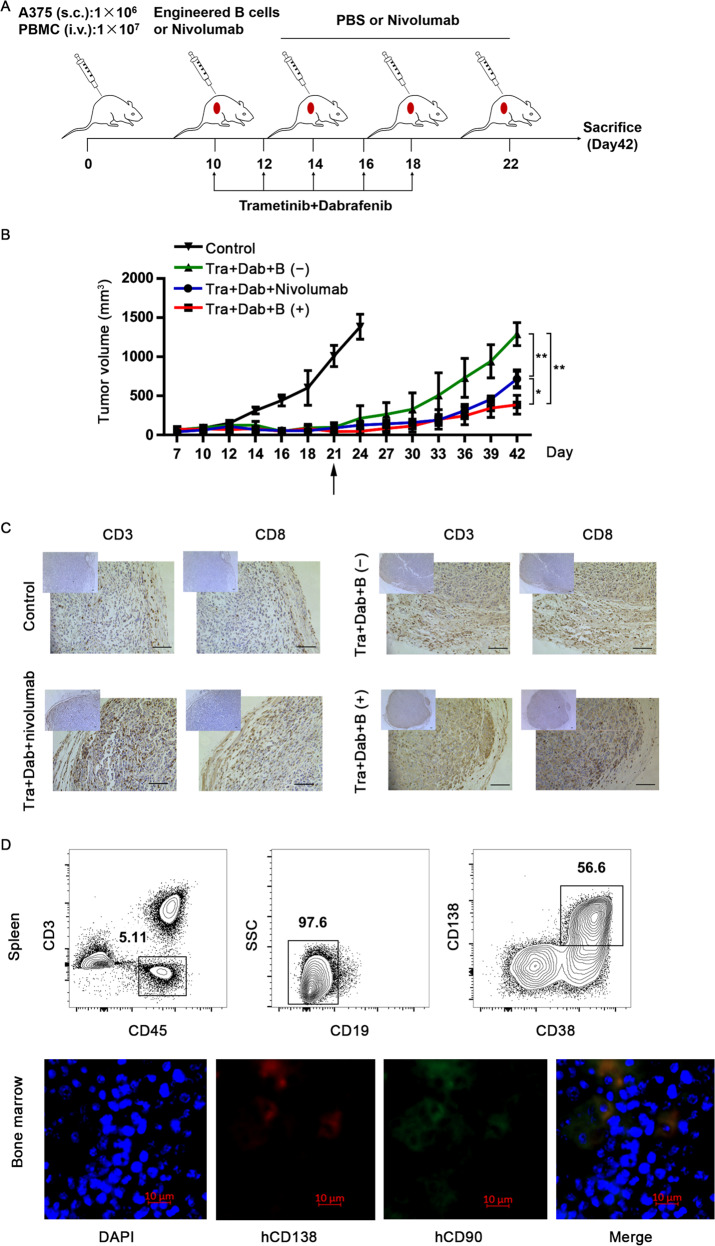
Long-lived plasma cells (LLPCs) are robust specialized antibody-secreting cells that mainly stay in the bone marrow and can persist a lifetime. As they can be generated by inducing the differentiation of B-lymphocytes, we investigated the possibility that human LLPCs might be engineered to express α-PD-1 monoclonal antibody to substitute recombinant α-PD-1 antitumor immunotherapy. To this end, we inserted an α-PD-1 cassette into the GAPDH locus through Cas9/sgRNA-guided specific integration in B-lymphocytes, which was mediated by an integrase-defective lentiviral vector. The edited B cells were capable of differentiating into LLPCs both in vitro and in vivo. Transcriptional profiling analysis confirmed that these cells were typical LLPCs. Importantly, these cells secreted de novo antibodies persistently, which were able to inhibit human melanoma growth via an antibody-mediated checkpoint blockade in xenograft-tumor mice. Our work suggests that the engineered LLPCs may be utilized as a vehicle to constantly produce special antibodies for long-term cellular immunotherapy to eradicate tumors and cellular reservoirs for various pathogens including human immunodeficiency virus type 1 (HIV-1) and hepatitis B virus (HBV).


Conflict of interest statement

The authors have declared that they have no conflict of interest.

Figures

Fig. 1
Fig. 1. CRISPR-Cas9-mediated targeted integration of the α-PD-1 cassette into the GAPDH locus in HEK293T cells via IDLV delivery.
a Schematic overview of the donor plasmid, Cas9/sgRNA expression plasmid, and targeting strategy for α-PD-1 integration into GAPDH 3′-UTR. Positions of the PCR primers (black arrows) used for detection of integrated DNA fragments are indicated. Fine gray lines on donor plasmids indicate sections homologous to the GAPDH locus. Lightning shape, sgRNA target sequence, HR, homologous recombination-based strategy, HMEJ, homology-mediated end joining-based strategy, LHR/RHR, left/right arm of homology recombination, F1/R2, outer forward/reverse primer, F2/R1, inner forward/reverse primer. b The mismatch-sensitive endonuclease T7E1 assay results showed the different efficiencies of Cas9/sgRNA-1, 2, and 3 for targeting human HEK293T genome. HEK293T cells were transfected with Cas9/sgRNA-1, 2 or 3 expression plasmid, without donor plasmid. Genomic DNA was extracted for T7E1 assay at day 4 post transfection. c FACS analysis of HEK293T cells showed the knock-in efficiencies of the α-PD-1 mAb in HEK293T cells. IDLV with HR-donor alone, IDLV expressing Cas9/sgRNA alone, or the two IDLVs together, were allowed to infect HEK293T cells. Control without IDLV infection is shown on the top. d CD90+ cells were sorted for genomic PCR analysis. Two sets of primers specific for the 5′ or 3′ integration junctions were used. Primer pair F1/R1 and F2/R2 amplified the 5′-junction (1435 bp) and the 3′-junction (1008 bp) of the transgene integration respectively. Primers F1/R2 amplified two DNA fragments that represent the wild type (2176 bp) and modified gene (4929 bp), respectively. e Relative knock-in efficiencies of HR and HMEJ-based strategies in HEK293T cells. Cells were infected with IDLV carried HR-donor or HMEJ-donor along with IDLV expressing Cas9/sgRNA at different MOIs. CD90 expression was analyzed by FACS 5 days post infection. Data are representative of three independent experiments (means ± SEM), **P < 0.01, ns, no significant difference; two-tailed Student’s t test (e) was used.
Fig. 2
Fig. 2. Efficient targeted integration of α-PD-1 mAb into human primary B cells.
a Comparison of transduction rates between BaEVTR and VSVG pseudotyped IDLVs. An incubation of the freshly pre-stimulated B cells with BaEVTR or VSVG pseudotyped GFP-encoding IDLVs (MOI of 10, based on titering via flow cytometry for GFP expression) was conducted for 48 h at 37 °C, followed by FACS analysis for detection of GFP+ cells. Pre-stimulated B cells without transduction were used as the control. b A wave of transgene expression was observed at human primary B cells transduced with BaEVTR pseudotyped IDLV. GFP expression was estimated by FACS at 24 h, day 7 or day 14 post transduction. c Detection of BaEVTR pseudotyped ICLVs and IDLVs integration at 24 h or day 14 post transduction with a modified Alu-LTR nested–PCR protocol. Results are presented as mean ± SEM, n = 3. d Schematic representation of the human primary B cells engineering protocol by infection of dual-IDLVs. e Representative flow cytometric analysis for integrated CD90 expression 5 days post infection as indicated in d. Pre-stimulated B cells with only the donor IDLV were used as the control. f The relative knock-in efficiency in human primary B cells transduced with dual-IDLVs are shown. Data are from three independent experiments (means ± SEM), ***P < 0.001; two-tailed Student’s t test (f) was used.
Fig. 3
Fig. 3. Functional α-PD-1 mAb secretion from engineered CD90-expressing B cells.
a Schematic representation of sorting and expansion strategy of engineered CD90-expressing B cells. b Following FACS sorting at day 0 indicated in a, engineered CD90-expressing B cells were co-cultured with the irradiated 293T, 293T-CD40L, or 293T-CD40L-sBAFF feeder cells. The feeder cells were renewed every 4 days and the numbers of B cells were counted to indicate expansion patterns. c As performed in a, culture supernatants of gene-edited B cells co-cultured with feeder cells were collected at various time points, followed by ELISA for detecting α-PD-1 mAb concentration. Data are representative of three independent experiments. d PD-1 blockade-mediated T-cell stimulation assay was performed by SEB stimulation of PBMCs. 1 × 105 PBMCs were stimulated with serial dilutions of SEB in the presence of nivolumab, culture supernatant of gene-edited B cells or untransduced B cells as a control. Supernatants were collected 3 days later and measured for IL-2 levels by ELISA. Nivolumab was used as a positive control. Representative data from three healthy donors are shown. e To conduct a T-cell proliferation assay mediated by PD-1 blockade, PBMCs from healthy donors were stimulated with anti-CD3 antibody and cultured in the presence of anti-CD28, nivolumab, culture supernatant of gene-edited B cells or untransduced B cells as a control for 3 days. The CFSE labeled CD4+ T cells were detected via flow cytometry. f Genome alignment tracks of the normalized ATAC-seq data showed the open chromatin for GAPDH locus in CD90+ engineered B cells cultured at day 28 (red). Pre-sitmulated B cells with only the donor IDLV were used as the control (blue). The results in panels c, d, and e are presented as mean ± SEM, n = 3. **P < 0.01, ***P < 0.001, ns, no significant difference; one-way ANOVA with Tukey’s post hoc tests (ce) were used.
Fig. 4
Fig. 4. Differentiation of gene-edited human primary B cells into LLPCs in vitro.
a Schematic representation of engineered B-cell differentiation into LLPCs in vitro using a multi-step cytokine culture system. b As described in a, engineered B cells differentiated into prePBs, PBs, PCs, and LLPCs respectively at indicated step. CD20, CD38, and CD138 staining were used for phenotype identification by FACS analysis at day 5, 8, 11, and 30 post gene-editing. c Proportion of plasmablasts and plasma cells at the end of the step are shown. d To confirm LLPCs phenotype, relative markers including CD27, ki67, extracellular IgG, and intracellular IgG were detected by FACS analysis. e Transcriptional signatures involved in LLPCs differentiation were tested by Quantitative real-time PCR. f The concentrations of α-PD-1 mAb in the supernatants were monitored at indicated time points during the differentiation process. Results are combined from three independent donors. The results in panels c, e and f are presented as mean ± SEM, n = 3. *P < 0.05, **P < 0.01, ***P < 0.001; two-tailed Student’s t test (e) and one-way ANOVA with Tukey’s post hoc test (f) were used.
Fig. 5
Fig. 5. Generation of α-PD-1 mAb secreting LLPCs from engineered human primary B cells upon transfer into NSG mice.
a The strategy of LLPCs differentiation from engineered primary B cells upon transfer into NSG mice and 5 months of reconstitution. b Representative example of the spleen and bone marrow from humanized NSG mice. The identification of three subsets were shown as follows: mature B cells (CD19+), PBs (CD19CD38+CD138), and putative LLPCs (CD19CD38+CD138+). The proportion of mature B cells, PBs and LLPCs are shown on the right panel. Results are the mean ± SEM from three individual mice. c The ELISpot assay results of the α-PD-1 mAb secreting subsets are shown from a representative experiment. The numbers of spot-forming cells/104 cells are presented on the right panel as the mean number ±SEM from three separate experiments. *P < 0.05, **P < 0.01, ***P < 0.001, ns, no significant difference; one-way ANOVA with Tukey’s post hoc tests (b, c) were used. d The concentrations of α-PD-1 mAb were monitored in serum after the transfer of engineered B cells every 15 days for 5 months. Results from three independent donors were combined. Data are represented as mean ± SEM. e Selected “PC-related genes” are shown from three NSG mice sorted for B cells and LLPCs. Heatmaps showed the z-score normalized expression of the differentially expressed genes involved in the “PC-related gene” signature. RNA expression levels are indicated with a red/blue scale for high and low expression levels, respectively. f GSEA plots showed the enrichment genes of differentiation from B cells compared with plasma cells. The plot of running enrichment score (RES) is shown in green (top). Vertical bar (in black) in the middle indicate a gene within the differentiation gene set. The correlation of gene expression with subclusters is shown on the bottom. gl Ratio of expression (log2 fold) in LLPCs to that in B cells for genes encoding transcription factors (g), cell cycle (h), protein folding and metabolism (i), immune response and B-cell differentiation (j), apoptosis (k), and autophagy and ER stress response (l). Data are pooled from three mice.
Fig. 6
Fig. 6. Enhanced antitumor activity of engineered human B cells via an antibody-mediated PD-1 blockade.
a The strategy of detecting antitumor activity of engineered human B cells secreting α-PD-1 mAb in tumor-xenogenic humanized mice models. 1 × 106 A375 melanoma cells were inoculated subcutaneously into the NSG mice, after which they were randomly sorted into four groups. Xenografted NSG mice were treated with engineered primary B cells, untransduced primary B cells, nivolumab, or isotype control. Nivolumab and isotype control were administrated three times a week. b Analysis of A375 melanoma xenografts growth. Tumor growth was evaluated at indicated time points (four mice in each group). c, d Representative flow cytometric analysis (c) and proportion (d) of tumor-infiltrating hCD4+ T cells, hCD8+ T cells and hCD25+ Foxp3+ Treg population. e The ratio of hCD8+ T cells/hTregs from data shown in d. f The serum hIFN-γ levels were measured by ELISA. The results in panels b, df are presented as mean ± SEM. Data shown are representative of three independent experiments. *P < 0.05, **P < 0.01, ns, no significant difference; one-way ANOVA with Tukey’s post hoc tests (b, df) were used.
Fig. 7
Fig. 7. Long-term antitumor efficacy of engineered LLPCs in combinations with targeted inhibitors.
a The strategy of investigating long-term efficacy of LLPCs combined with trametinib (Tra) and dabrafenib (Dab) treatment against human A375 melanoma. Mice treated only with vehicle (PBS, pH 7.0) were used as the control. Trametinib and dabrafenib were administrated every 2 days for 10 days. Nivolumab was given three times every week. b Tumor growth curves. Treatments began at day 10. Removing of inhibitors is marked by the black arrow. Representative graph of two repetitions of this experiment is shown. Data are presented as mean ± SEM. *P < 0.05, **P < 0.01; one-way ANOVA with Tukey’s post hoc test (b) was used. c The tumor infiltrating hCD3+ and hCD8+ lymphocytes. The melanoma biopsies were formalin fixed and processed for immunohistochemistry analysis at day 42. Anti-human CD3 antibody and anti-human CD8 antibody were used for primary staining (scale bar, 100 µm). d Representative flow cytometric analysis of LLPCs proportion in the spleen and representative immunofluorescence images indicating the engineered LLPCs population in the bone marrow. Human CD138 is shown in red, human CD90 in green, and DAPI-stained nuclei in blue. Scale bar, 10 μm.

Similar articles

Cited by

References

    1. Lei TC, Scott DW. Induction of tolerance to factor VIII inhibitors by gene therapy with immunodominant A2 and C2 domains presented by B cells as Ig fusion proteins. Blood. 2005;105:4865–4870. - PMC - PubMed
    1. Melo ME, et al. Gene transfer of Ig-fusion proteins into B cells prevents and treats autoimmune diseases. J. Immunol. 2002;168:4788–4795. - PubMed
    1. Tellier J, Nutt SL. Plasma cells: the programming of an antibody-secreting machine. Eur. J. Immunol. 2019;49:30–37. - PubMed
    1. Nutt SL, Hodgkin PD, Tarlinton DM, Corcoran LM. The generation of antibody-secreting plasma cells. Nat. Rev. Immunol. 2015;15:160–171. - PubMed
    1. Kometani K, Kurosaki T. Differentiation and maintenance of long-lived plasma cells. Curr. Opin. Immunol. 2015;33:64–69. - PubMed

Publication types

MeSH terms

Substances