. 2020 Nov 12;11(1):5749.
doi: 10.1038/s41467-020-19478-2.

Collider bias undermines our understanding of COVID-19 disease risk and severity

Affiliations

Collider bias undermines our understanding of COVID-19 disease risk and severity

Gareth J Griffith et al. Nat Commun. .

Abstract

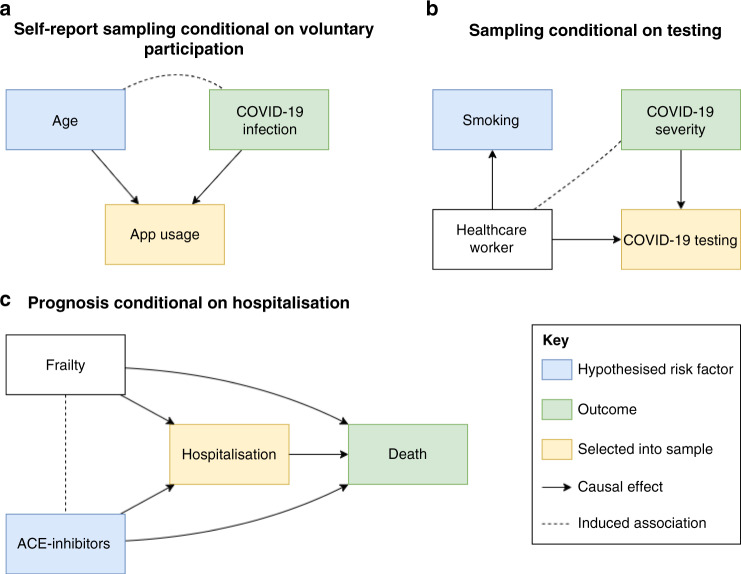
Numerous observational studies have attempted to identify risk factors for infection with SARS-CoV-2 and COVID-19 disease outcomes. Studies have used datasets sampled from patients admitted to hospital, people tested for active infection, or people who volunteered to participate. Here, we highlight the challenge of interpreting observational evidence from such non-representative samples. Collider bias can induce associations between two or more variables which affect the likelihood of an individual being sampled, distorting associations between these variables in the sample. Analysing UK Biobank data, compared to the wider cohort the participants tested for COVID-19 were highly selected for a range of genetic, behavioural, cardiovascular, demographic, and anthropometric traits. We discuss the mechanisms inducing these problems, and approaches that could help mitigate them. While collider bias should be explored in existing studies, the optimal way to mitigate the problem is to use appropriate sampling strategies at the study design stage.


Conflict of interest statement

The authors declare no competing interests.

Figures

Fig. 1
Fig. 1. Illustrative example of collider bias.
a A directed acyclic graph (DAG) illustrating a scenario in which collider bias would distort the estimate of the causal effect of the risk factor on the outcome. Directed arrows indicate causal effects and dotted lines indicate induced associations. Note that the risk factor and the outcome can be associated with sample selection indirectly (e.g. through unmeasured confounding variables), as shown in b. The type of collider bias induced in graph (b) is sometimes referred to as M-bias. To illustrate the example in a, consider academic ability and sporting ability to each influence selection into a prestigious school. As shown in c, these traits are negligibly correlated in the general population (blue dotted line), but because they are selected for enrolment they become strongly correlated when analysing only the selected individuals (red dotted line).
Fig. 2
Fig. 2. Collider bias induced by conditioning on a collider in three scenarios relating to COVID-19 analysis.
These are simplified Directed Acyclic Diagrams where only the main variables of interest have been represented for sake of illustrating collider bias scenarios. All assume no unspecified confounding or other biases. Rectangles represent observed variables and solid directed arrows represent causal effects. The dashed line represents an induced association when conditioning on the collider, which in these scenarios are variables that indicate whether an individual is selected into the sample. a When some hypothesised risk factor (e.g. age) and outcome (e.g. COVID-19 infection) each associate with sample selection (e.g. voluntary data collection via mobile phone apps), the hypothesised risk factor and outcome will be associated within the sample. The presence and direction of these biases are model dependent; where causes are supra-multiplicative they will be positively associated in the sample; where they are sub-multiplicative they will be negatively correlated, and where they are exactly multiplicative they will remain unassociated. We extend this scenario in b where the association between the hypothesised risk factor and the collider does not need to be causal. c When inferring the influence of some hypothesised risk factor on mortality, in an unselected sample the risk factor for infection is a causal factor for death (mediated by COVID-19 infection). However, if analysed only amongst individuals who are known to have COVID-19 (i.e. we condition on the COVID-19 infection variable) then the risk factor for infection will appear to be associated with any other variable that influences both infection and progression. In many circumstances, this can lead to a risk factor for disease onset that appears to be protective for disease progression. Each of these scenarios represents those described in the main text.
Fig. 3
Fig. 3. Quantile-Quantile plot of −log10 p-values for factors influencing being tested for COVID-19 in UK Biobank.
The x-axis represents the expected p-value for 2556 hypothesis tests and y-axis represents the observed p-values. The red line represents the expected relationship under the null hypothesis of no associations.
Fig. 4
Fig. 4. Example of large associations induced by collider bias under the null hypothesis of no causal relationship, using scenarios similar to those reported for the observed protective association of smoking on COVID-19 infection.
Assume a simple scenario in which the hypothesised exposure (A) and outcome (Y) are both binary and each influence probability of being selected into the sample (S) e.g. P(S=1A,Y)=β0+βA+βY+βAY where β0 is the baseline probability of being selected, βA is the effect of A, βY is the effect of Y and βAY is the effect of the interaction between A and Y. The selection mechanism in question is represented in Fig. 1b (without the interaction term drawn). This plot shows which combinations of these parameters would be required to induce an apparent risk effect with magnitude OR > 2 (blue region) or an apparent protective effect with magnitude OR < 0.5 (red region) under the null hypothesis of no causal effect. To create a simplified scenario similar to that in Miyara et al. we use a general population prevalence of smoking of 0.27 and a sample prevalence of 0.05, thus fixing βA at 0.22. Because the prevalence of COVID-19 is not known in the general population, we allow the sample to be over- or under-representative (y-axis). We also allow modest interaction effects. Calculating over this parameter space, 40% of all possible combinations lead to an artefactual 2-fold protective or risk association operating through this simple model of bias alone. It is important to disclose this level of uncertainty when publishing observational estimates.

Similar articles

Cited by

References

    1. Zhang P., et al. Association of inpatient use of angiotensin converting enzyme inhibitors and angiotensin II receptor blockers with mortality among patients with hypertension hospitalized with COVID-19. Circ. Res. 10.1161/CIRCRESAHA.120.317134 (2020) - PMC - PubMed
    1. Wynants L, et al. Prediction models for diagnosis and prognosis of covid-19 infection: systematic review and critical appraisal. BMJ. 2020;369:m1328. doi: 10.1136/bmj.m1328. - DOI - PMC - PubMed
    1. Gudbjartsson D. F., et al. Spread of SARS-CoV-2 in the Icelandic population. N. Engl. J. Med. 10.1056/NEJMoa2006100 (2020) - PMC - PubMed
    1. Chen T, et al. Clinical characteristics of 113 deceased patients with coronavirus disease 2019: retrospective study. BMJ. 2020;368:m1091. doi: 10.1136/bmj.m1091. - DOI - PMC - PubMed
    1. Tostmann A, et al. Strong associations and moderate predictive value of early symptoms for SARS-CoV-2 test positivity among healthcare workers, the Netherlands, March 2020. Eurosurveillance. 2020;25:2000508. doi: 10.2807/1560-7917.ES.2020.25.16.2000508. - DOI - PMC - PubMed

Publication types