. 2020 Nov 12;11(1):5725.
doi: 10.1038/s41467-020-19632-w.

Individual differences among deep neural network models

Affiliations

Individual differences among deep neural network models

Johannes Mehrer et al. Nat Commun. .

Abstract

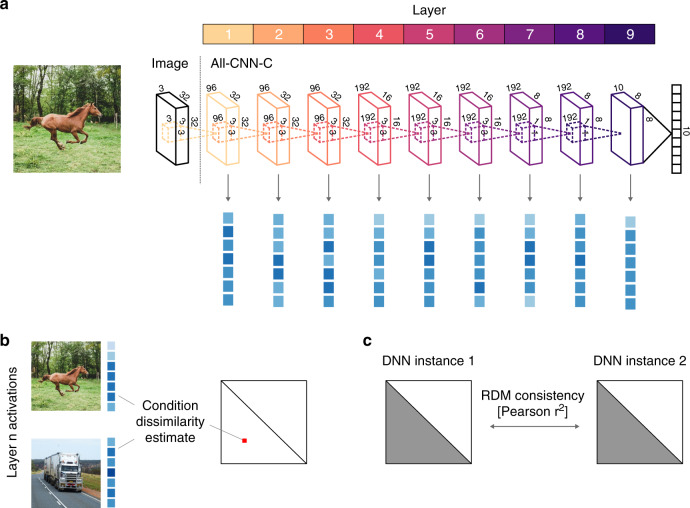
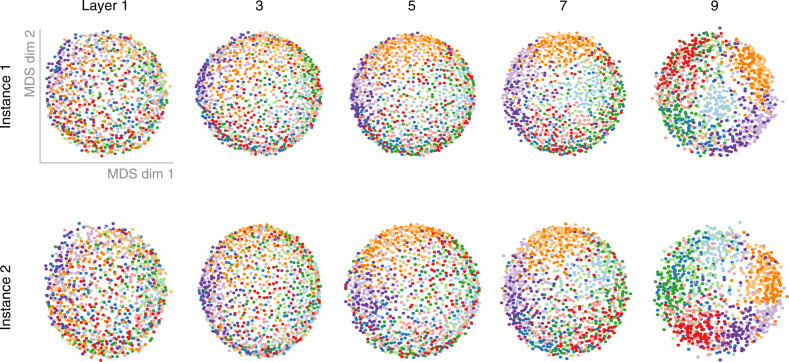
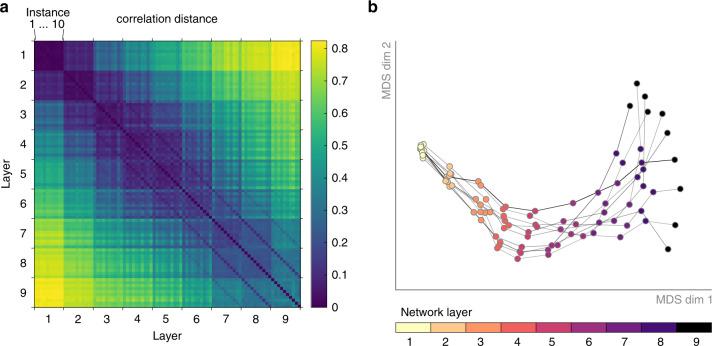
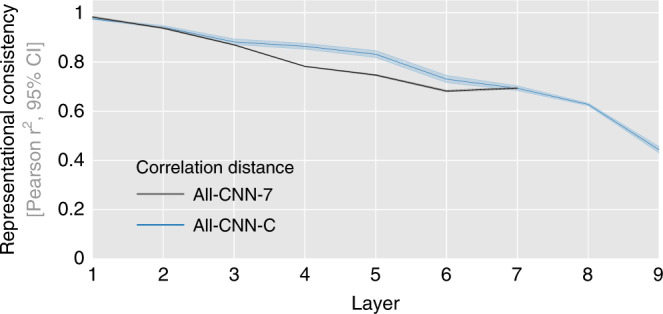
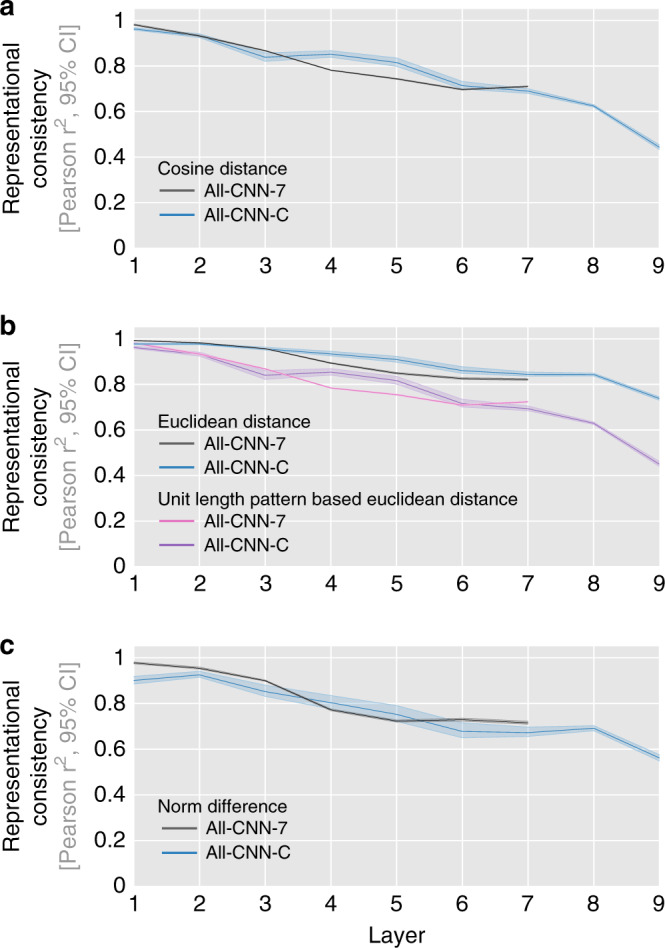
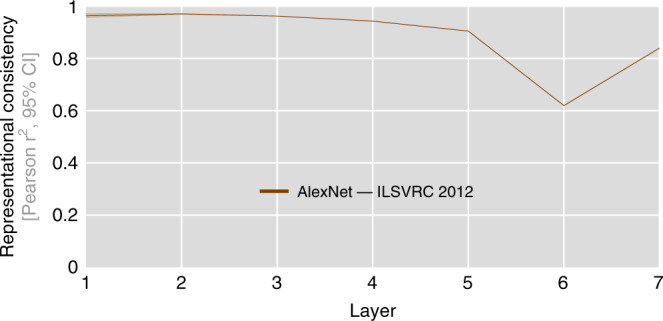
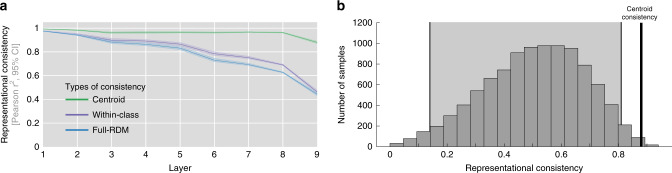
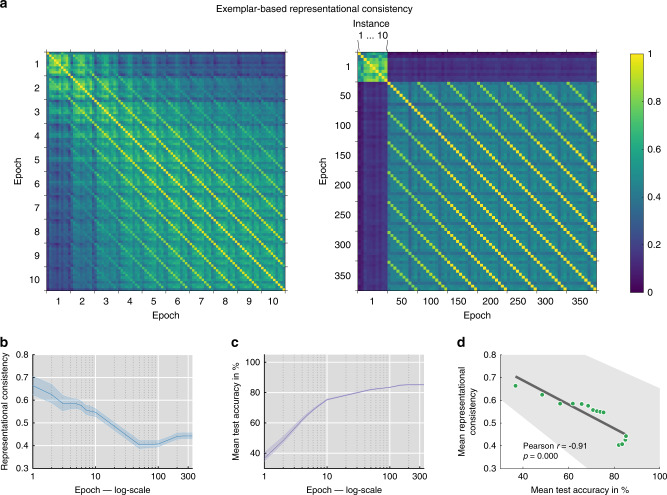
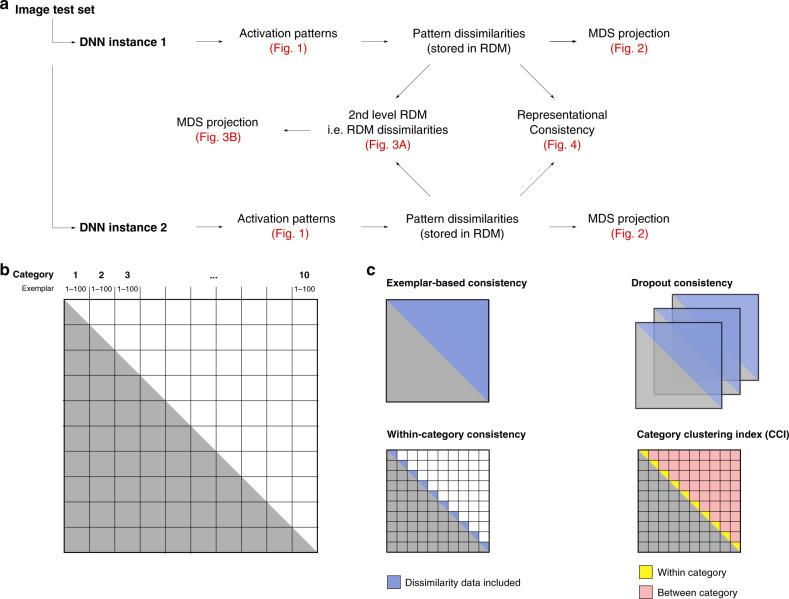
Deep neural networks (DNNs) excel at visual recognition tasks and are increasingly used as a modeling framework for neural computations in the primate brain. Just like individual brains, each DNN has a unique connectivity and representational profile. Here, we investigate individual differences among DNN instances that arise from varying only the random initialization of the network weights. Using tools typically employed in systems neuroscience, we show that this minimal change in initial conditions prior to training leads to substantial differences in intermediate and higher-level network representations despite similar network-level classification performance. We locate the origins of the effects in an under-constrained alignment of category exemplars, rather than misaligned category centroids. These results call into question the common practice of using single networks to derive insights into neural information processing and rather suggest that computational neuroscientists working with DNNs may need to base their inferences on groups of multiple network instances.


Conflict of interest statement

The authors declare no competing interests.

Figures

Fig. 1
Fig. 1. Comparing network-internal representations using RSA and representational consistency.
a Our comparisons of network-internal representations were based on their multivariate activation patterns, extracted from each layer of each network instance as it responded to each of 1000 test images. b These high-dimensional activation vectors were then used to perform a representational similarity analysis (RSA). The fundamental building blocks of RSA are representational dissimilarity matrices (RDMs), which store all pairwise distances between the network’s responses to the set of test stimuli. Each test image elicits a multivariate population response in each of the network’s layers, which corresponds to a point in the respective high-dimensional activation space. The geometry of these points, captured in the RDM, provides insight into the nature of the representation, as it indicates which stimuli are grouped together, and which are separated. c To compare pairs of network instances, we compute their representational consistency, defined as the shared variance between network RDMs.
Fig. 2
Fig. 2. Representational geometries at different network depths of two DNN instances.
The internal representations of two network instances were characterized based on their representational geometries. We computed the pairwise distances (correlation distance) between activity patterns in response to 1000 test stimuli from 10 visual categories and visualized them in 2D via multidimensional scaling (MDS; metric stress criterion; categories shown in different colors). With increasing depth, networks exhibit increased category clustering.
Fig. 3
Fig. 3. Network individual differences emerge with increasing network depth.
a We compare the representational geometries across all network instances (10) and layers (9 convolutional) for All-CNN-C by computing all pairwise distances between the corresponding RDMs. b We projected the data points in a (one for each layer and instance) into 2D via MDS. Layers of individual network instances are connected via gray lines. While early representational geometries are highly similar, individual differences emerge gradually with increasing network depth.
Fig. 4
Fig. 4. Representational consistency decreases with increasing network depth.
Average representational consistency for each network layer computed across all pairwise comparisons of network instances (45 comparisons for 10 instances, computed separately for two network architectures). Error bars indicate 95% confidence intervals (CI, bootstrapped).
Fig. 5
Fig. 5. Representational consistency decreases irrespective of distance measure.
Representational consistency decreases with increasing layer depth for both tested DNN architectures, and across multiple ways to measure distances in multivariate population responses (cosine (a), Euclidean distance and unit length pattern-based Euclidean distance (b), and differences in vector norm (c)). Average representational consistency shown for each layer, computed across all pairwise comparisons of network instances (45 comparisons for 10 instances), together with a 95% bootstrapped confidence interval.
Fig. 6
Fig. 6. Representational consistency decreases in AlexNet.
We repeated our above analyses of representational consistency on a set of AlexNet instances trained on large-scale object classification data set ILSVRC 2012. Again, we only vary the initial random seed of the network weights. In line with our previous results, we observe a decrease in representational consistency from early to late network layers. The minimal average consistency is observed in layer fc6, which exhibits 62% of the shared variance across network RDMs. As AlexNet requires the input of size 224 × 224, which is significantly larger than the 32 × 32 image size of CIFAR-10 used earlier, we created an independent set of larger images from the same 10 categories while following the same data set structure (100 images per CIFAR-10 category). Ten network instances correspond to 45 pairwise distance estimates per network layer, average representational consistency shown here with 95% confidence intervals (bootstrapped).
Fig. 7
Fig. 7. Category centroids are highly consistent across network instances.
a Centroid-based representational consistency (green) remains comparably high throughout, whereas the consistency of within-category distances decreases significantly with increasing network depth (error bars indicate 95% confidence intervals, average data shown, computed from 45 network comparisons across 10 network instances). This indicates that differences in the arrangement of individual category exemplars, rather than large-scale differences between class centroids are the main contributor to the observed individual differences. b High centroid-based representational consistency cannot be explained by the smaller RDMs or the averaging of multiple response patterns, as centroids of randomly sampled classes show a significantly lower mean consistency (95% CI in the light gray background).
Fig. 8
Fig. 8. Effects of Bernoulli dropout on task performance and representational consistency.
a Task performance, the average across all 10 network instances shown with 95% CI for the training set (blue), test set (orange), and when using dropout sampling at inference time for the test set (red, 1 sample). b Average representational consistency in the final convolutional layer of All-CNN-C as a function of dropout probability during training and test (dropout probability at test time set to equal dropout probability during training, consistency derived from 45 network pairs). When using dropout at test time, multiple samples can be drawn for each stimulus in the test set (creating multiple RDMs). Consistency for network pairs was computed for the respective average RDM for each instance. Consistency was observed to be highest when 10 samples were obtained from a DNN trained and tested at a dropout rate of 60%. c The clustering index for the penultimate layer of All-CNN-C increases with increasing Bernoulli dropout probability (10 network instances, error bars 95% CI).
Fig. 9
Fig. 9. Final-layer representational consistency (exemplar-based) across training epochs.
a Comparing representational consistency across early epochs [1 to 10] (left) and throughout all training epochs [1 to 350 in steps of 50] (right). Lines parallel to the main diagonal indicate that network instances remain on their distinct representational trajectory compared to other networks. Average consistency shown across 45 network pairs, derived from 10 network instances. b Representational consistency, computed and averaged across all network pairs (45 pairs total) for each training epoch, demonstrates increasing individual differences with training (shown with 95% CI). c Test performance across training (average top-1 accuracy across 10 network instances with 95% CI). d Representational consistency and test performance exhibit a strong negative relationship (Pearson r = −0.91, p < 0.001; robust correlation) indicating that task training enhances individual differences (dots represent network training epochs, error bar indicates 95% CI).
Fig. 10
Fig. 10. Analysis pipeline details.
a Overview of the different analysis steps taken to produce Figs. 1–4. Test images were processed by individual network instances. These activation vectors were used to compute RDMs for each network instance and layer. These distance matrices were used for MDS projection and as input to (i) representational consistency estimates, and (ii) 2nd level RSA analyses in which RDMs instead of activation patterns are compared. The second-level RDMs were projected into 2D using MDS. b Overview of the first-level RDM structure. These RDMs are of size 1000 × 1000, depicting the activation vector distances for 100 instances of 10 object categories. c Our analyses focus on different aspects of the RDM shown in b. Exemplar-based consistency uses all pairwise differences, whereas within-category consistency focuses on distances among exemplars of the same category only. Consistency with dropout extracts multiple RDM samples and subsequently uses their average to compute consistency. Finally, our category clustering index contrasts distances among category exemplars categories (shown in yellow) with distances between exemplars of different categories (red).

Similar articles

Cited by

References

    1. Cadieu CF, et al. Deep neural networks rival the representation of primate IT cortex for core visual object recognition. PLoS Comput. Biol. 2014;10:e1003963. doi: 10.1371/journal.pcbi.1003963. - DOI - PMC - PubMed
    1. Guclu U, van Gerven MAJ. Deep neural networks reveal a gradient in the complexity of neural representations across the ventral stream. J. Neurosci. 2015;35:10005–10014. doi: 10.1523/JNEUROSCI.5023-14.2015. - DOI - PMC - PubMed
    1. Khaligh-Razavi S-M, Kriegeskorte N. Deep supervised, but not unsupervised, models may explain IT cortical representation. PLoS Comput. Biol. 2014;10:e1003915. doi: 10.1371/journal.pcbi.1003915. - DOI - PMC - PubMed
    1. Schrimpf, M. et al. Brain-score: which artificial neural network for object recognition is most brain-like? Preprint at https://www.biorxiv.org/content/10.1101/407007v2bioRxiv (2018). - DOI
    1. Yamins DLK, et al. Performance-optimized hierarchical models predict neural responses in higher visual cortex. Proc. Natl Acad. Sci. USA. 2014;111:8619–8624. doi: 10.1073/pnas.1403112111. - DOI - PMC - PubMed

Publication types