. 2020 Nov 12;11(1):5731.
doi: 10.1038/s41467-020-19547-6.

Pharmacological targeting of MCL-1 promotes mitophagy and improves disease pathologies in an Alzheimer's disease mouse model

Affiliations

Pharmacological targeting of MCL-1 promotes mitophagy and improves disease pathologies in an Alzheimer's disease mouse model

Xufeng Cen et al. Nat Commun. .

Abstract

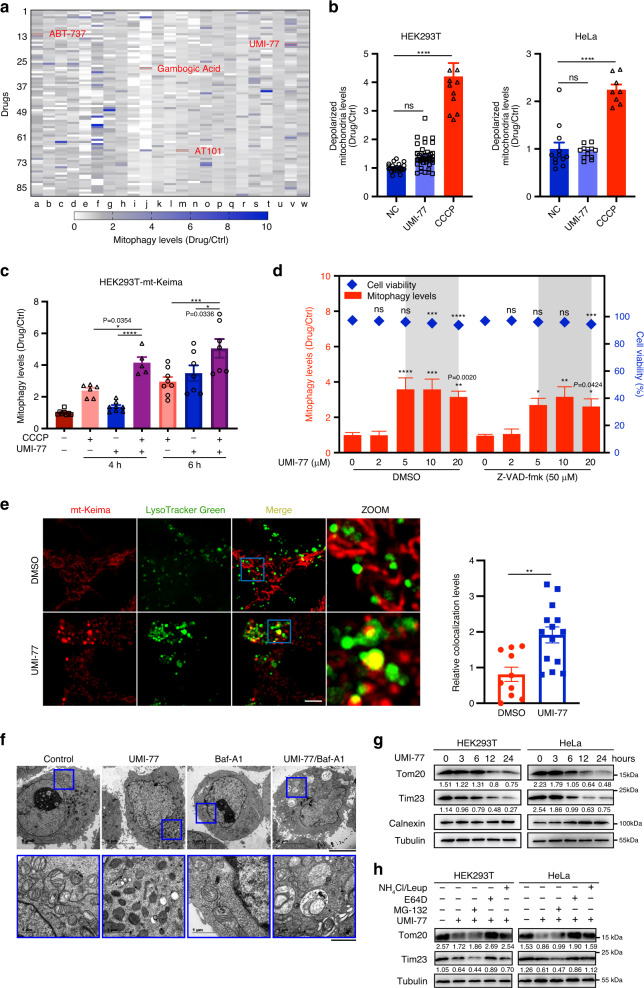
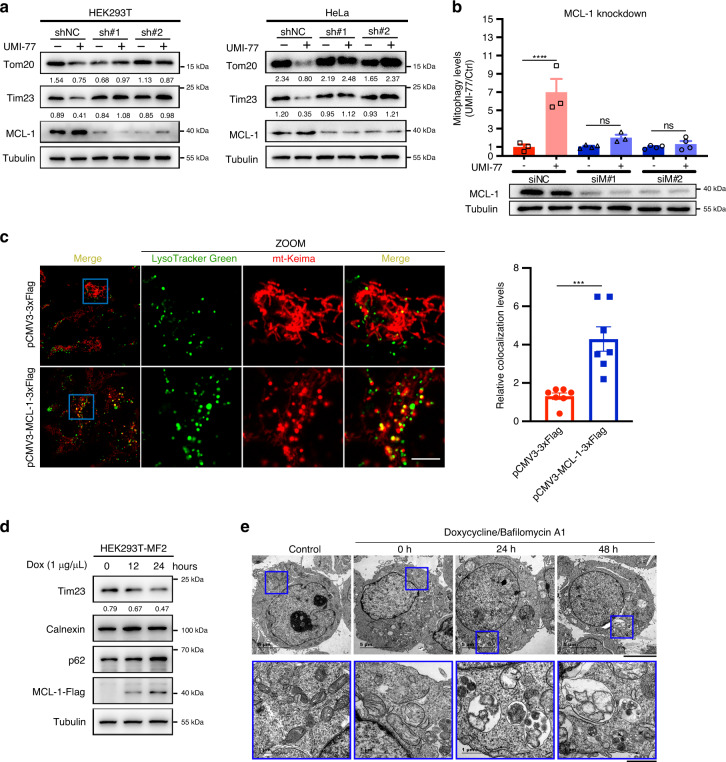
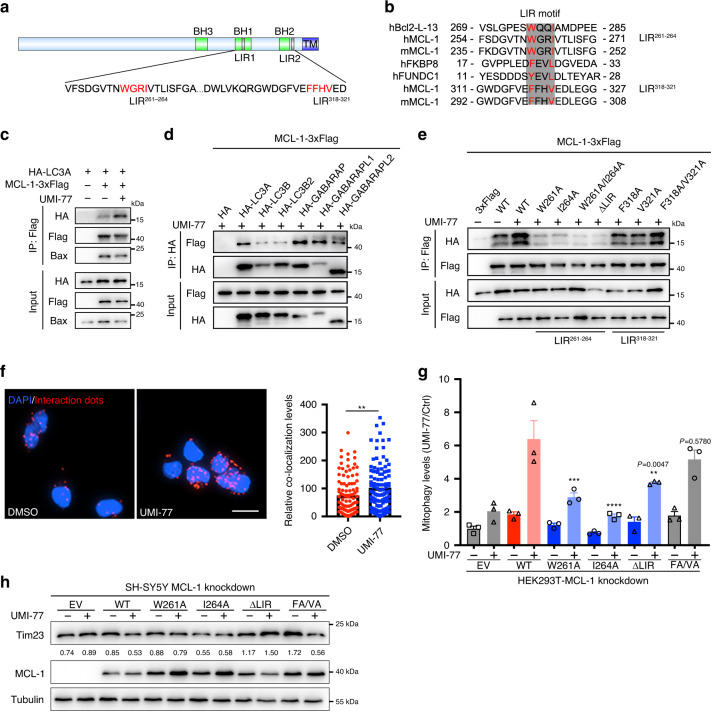
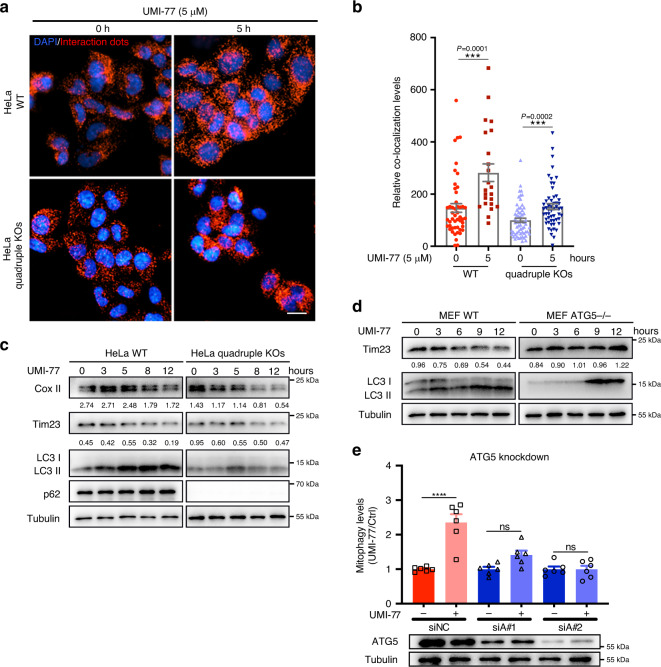
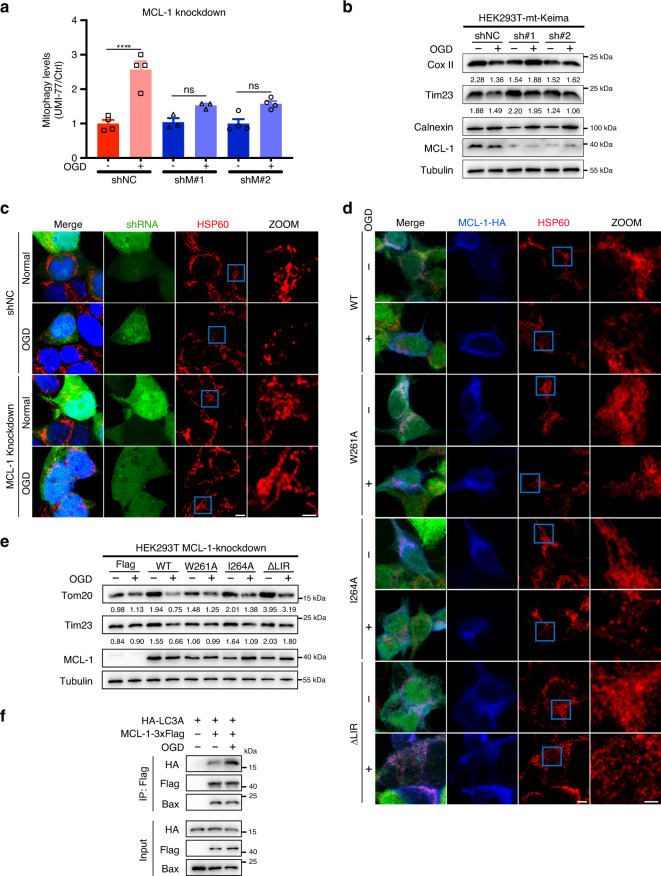
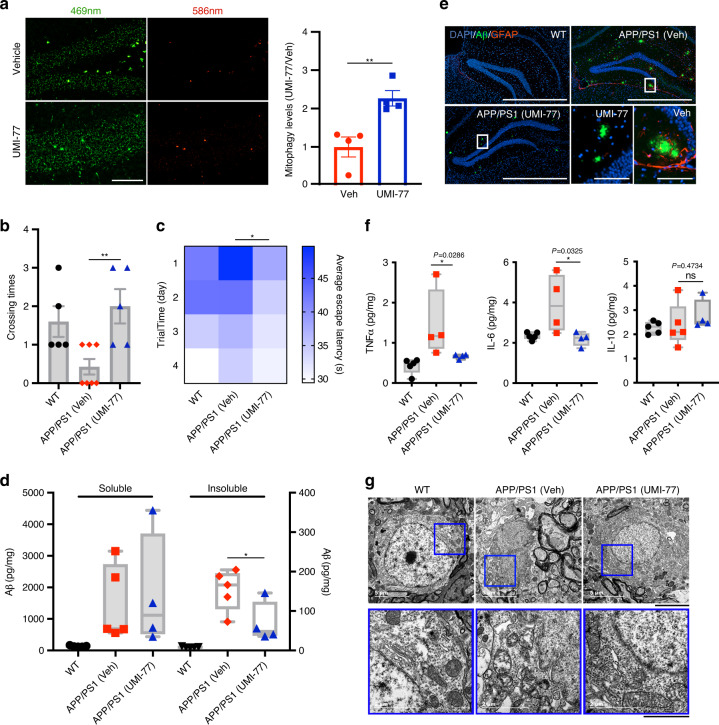
There is increasing evidence that inducing neuronal mitophagy can be used as a therapeutic intervention for Alzheimer's disease. Here, we screen a library of 2024 FDA-approved drugs or drug candidates, revealing UMI-77 as an unexpected mitophagy activator. UMI-77 is an established BH3-mimetic for MCL-1 and was developed to induce apoptosis in cancer cells. We found that at sub-lethal doses, UMI-77 potently induces mitophagy, independent of apoptosis. Our mechanistic studies discovered that MCL-1 is a mitophagy receptor and directly binds to LC3A. Finally, we found that UMI-77 can induce mitophagy in vivo and that it effectively reverses molecular and behavioral phenotypes in the APP/PS1 mouse model of Alzheimer's disease. Our findings shed light on the mechanisms of mitophagy, reveal that MCL-1 is a mitophagy receptor that can be targeted to induce mitophagy, and identify MCL-1 as a drug target for therapeutic intervention in Alzheimer's disease.


Conflict of interest statement

X.C. and H.X. have filed a patent covering the potential application of UMI-77 in AD. The other authors declare no competing interests.

Figures

Fig. 1
Fig. 1. UMI-77 can induce mitophagy, without inducing mitochondrial damage or apoptosis.
a 2024 FDA-approved drugs or drug candidates were used to screen for mitophagy inducers. Each color block represents a drug in the screen. Bcl-2 family proteins inhibitors are indicated in red. b HEK293T and HeLa cells treated with UMI-77 (5 µM) or CCCP (10 µM) for 12 h. Mitochondrial membrane potential was assessed using JC1. One-way ANOVA (data represent mean ± S.E.M.; HEK293T: NC (n = 24), UMI-77 (n = 45), CCCP (n = 12); HeLa: NC (n = 12), UMI-77 (n = 12), CCCP (n = 8). ****p < 0.0001. ns, not significant). c HEK293T-mt-Keima cells were treated with UMI-77 (5 µM) combined with CCCP (10 µM) for 4 or 6 h. The mitophagy levels were analyzed by one-way ANOVA (data represent mean ± S.E.M. The sample size was, in turn, n = 8, n = 6, n = 8, n = 5, n = 8, n = 7, n = 7. ****p < 0.0001, ***p < 0.001, *p < 0.05). d HEK293T cells were transfected with pcDNA3.1-mt-Keima (mitophagy reporter) plasmid and treated with UMI-77 at indicated concentrations with or without Z-VAD-fmk (50 µM) for 12 h. Cell viability was determined using LIVE/DEAD™ imaging kit. One-way ANOVA (data represent mean ± S.E.M.; n = 4. ****p < 0.0001, ***p < 0.001, **p < 0.01, *p < 0.05. ns, not significant). e HEK293T-mt-Keima cells were stained with LysoTracker Green for 30 min, treated with 5 µM UMI-77. Scale bars, 5 µm. Quantification of the number of LysoTracker-positive dots colocalized with mt-Keima in cells were analyzed by two-tailed t test. (mean ± S.E.M.; DMSO (n = 10), UMI-77 (n = 14). **p < 0.01 (P = 0.0021)). f HeLa cells were treated with UMI-77 and Bafilomycin A1 (Baf-A1) for 8 h and analyzed by transmission electron microscopy. Scale bars, 5 µm; insets: Scale bar, 1 μm. g cells were treated with 5 µM UMI-77 for the indicated times and cell lysates were immunoblotted with indicated antibodies. The numbers under the blots represent the gray scale quantification (Tom20/Tubulin, Tim23/Tubulin). h cells were treated with 5 µM UMI-77 in the presence or absence of MG-132, E64D, and NH4Cl/Leupeptin (Leup) for 12 h, and the mitochondrial marker proteins (Tom20, Tim23) were detected by western blotting. The numbers under the blots represent the gray scale quantification (Tom20/Tubulin, Tim23/Tubulin). Source data are provided as a Source Data file.
Fig. 2
Fig. 2. MCL-1 promotes mitophagy and is required for UMI-77-induced mitophagy.
a HEK293T cells were transfected with MCL-1 shRNA for 60 h and treated with 5 µM UMI-77 for 12 h. Cell lysates were immunoblotted for mitochondrial marker proteins (Tom20, Tim23). The numbers under the blots represent the gray scale quantification (Tom20/Tubulin, Tim23/Tubulin). shNC: scrambled shRNA. b HEK293T-mt-Keima cells were transfected with indicated siRNA for 60 h, treated with UMI-77 (5 µM) for 12 h, The siRNA knockdown efficiency was shown using western blot and the mitophagy levels were quantified. One-way ANOVA (data represent mean ± S.E.M.; n = 3. ****p < 0.0001, ns, not significant.). siNC: scrambled siRNA. c HEK293T-mt-Keima cells were transfected with pCMV3-MCL-1-3xFlag and pCMV3-3xFlag plasmid, for 24 h, stained with LysoTracker Green for 30 min and imaged using fluorescence microscopy. Scale bar, 5 µm. Quantification of the number of LysoTracker-positive dots colocalized with mt-Keima in cells were analyzed by two-tailed t test. (data represent mean ± S.E.M.; n = 7 ***p < 0.001 (P = 0.0007)). d MCL-1-expressing HEK293T-MF2 cells were treated with 1 μg/mL doxycycline (Dox) for the indicated times, cell lysates were immunoblotted with indicated antibodies. The numbers under the blot represent the gray scale quantification (Tim23/Tubulin). e HEK293T-MF2 cells were treated with 1 μg/mL doxycycline for the indicated times, treated with Bafilomycin A1 for 6 h, and analyzed by transmission electron microscopy (TEM). Insets (blue boxes) show mitochondria and the autophagosomes engulfing mitochondria. Scale bars, 5 µm; insets: Scale bar, 1 μm. Source data are provided as a Source Data file.
Fig. 3
Fig. 3. The interaction between MCL-1 and LC3A is required for UMI-77-induced mitophagy.
a The schematic diagram of MCL-1 protein indicating two potential LIR (LC3-interacting region) motifs. The image was created by us in this study. b The alignment of LIR sequences of MCL-1, Bcl-2-L-13, FKBP8, and FUNDC1. Red sequences indicate highly conserved residues in LIR motif. h: Human; m: Mouse. The image was created by us in this study. c HEK293T cells were co-transfected with MCL-1-3xFlag and HA-LC3A for 24 h, treated with UMI-77 (10 µM) for 4 h, and the interaction of MCL-1 with HA-LC3A and endogenous Bax was analyzed by immunoprecipitation. d HEK293T cells were co-transfected with MCL-1-3xFlag and HA-tagged Atg8 family proteins for 24 h, treated with UMI-77 (10 µM) for 4 h, and the interaction between MCL-1 and the Atg8 family proteins was analyzed by immunoprecipitation. e HEK293T cells were co-transfected with MCL-1-3xFlag WT or the indicated mutants and LC3A-HA for 24 h, treated with UMI-77 (10 µM) for 4 h, and the interactions were analyzed by immunoprecipitation. f PLA assay for endogenous MCL-1 and LC3A was performed in HEK293T cells treated with UMI-77 (10 µM) for 4 h. Scale bar, 20 μm. Graph on the right–quantification of the PLA dots (data represents mean ± S.E.M.; DMSO (n = 107 cells), UMI-77 (n = 115 cells), **p < 0.01 (P = 0.0065), two-tailed t test). g HEK293T-MCL-1-konckdown cell were co-transfected MCL-1 WT or indicated mutants with mt-Keima plasmid for 48 h, treated with UMI-77 (5 µM) for 12 h. The mitophagy levels were quantified by one-way ANOVA (data represent mean ± S.E.M.; n = 3, ****p < 0.0001, ***p < 0.001, **p < 0.01, ns, not significant.). h SH-SY5Y MCL-1-knockdown cell line was transfected with expression plasmids encoding MCL-1 WT or indicated mutants and treated with UMI-77 (5 µM) for 12 h. The numbers under the blots represent the gray scale quantification (Tim23/Tubulin). Source data are provided as a Source Data file.
Fig. 4
Fig. 4. UMI-77 induces mitophagy in an ATG5-dependent manner, independent of adapter proteins NBR1, TAX1BP1, p62, and NDP52.
a PLA assay for MCL-1 and LC3A were performed in HeLa WT and quadruple KOs (NBR1, TAX1BP1, p62, and NDP52 knockout) cells treated with UMI-77 (5 µM) for the indicated times. Cells were analyzed by fluorescence microscopy. Scale bar, 20 μm. b Quantification of the mean area dots from a by two-tailed t test (data represents mean ± S.E.M. The sample size was, in turn, n = 49, n = 23, n = 60, n = 55 cells, ***p < 0.001). c HeLa WT and quadruple KOs (NBR1, TAX1BP1, p62, and NDP52 knockout) cells were treated with 5 µM UMI-77 for the indicated times and cell lysates were immunoblotted with indicated antibodies. The numbers under the blots represent the gray scale quantification (Cox II/Tubulin, Tim23/Tubulin). d MEF WT and ATG5 knockout cells were treated with 5 µM UMI-77 for the indicated times, and mitochondrial marker protein Tim23 and LC3 were detected by western blotting. The numbers under the blots represent the gray scale quantification (Tim23/Tubulin). e The mitophagy levels of control cells and ATG5 knockdown cells treated with UMI-77 were analyzed using one-way ANOVA (data represent mean ± S.E.M.; n = 6. ****p < 0.0001. ns, not significant). The siRNA knockdown efficiency was shown using western blot. siNC: scrambled siRNA. Source data are provided as a Source Data file.
Fig. 5
Fig. 5. MCL-1 is required for mitophagy induced by oxygen-glucose deprivation.
a HEK293T-mt-Keima cells were infected with lentiviral particles encoding MCL-1 shRNA for 24 h and treated with oxygen-glucose deprivation (OGD) for 5 h. Mitophagy levels were analyzed by one-way ANOVA (data represent mean ± S.E.M.; n = 4. ****p < 0.0001, ns, not significant). shNC: scrambled shRNA. b HEK293T-mt-Keima cells were infected with lentiviral particles encoding MCL-1 shRNA for 24 h and treated with OGD for 5 h. Cell lysates were immunoblotted with indicated antibodies. The numbers under the blots represent the gray scale quantification (Cox II/Tubulin, Tim23/Tubulin). shNC: scrambled shRNA. c HEK293T cells were infected with lentiviral particles encoding MCL-1-shRNA or control-shRNA for 24 h, treated with OGD for 5 h. Cells were fixed and stained with indicated antibodies. Green channel indicated cells were infected successfully. Scale bar, 5 μm; insets: scale bar, 2 μm. shNC: scrambled shRNA. d HEK293T-MCL-1-knockdown cells were transfected with MCL-1 wild-type or indicated mutants for 24 h, treated with OGD for 5 h. Cells were fixed and stained with indicated antibodies, following by fluorescence microscopy analysis. Scale bar, 5 μm; insets: Scale bar, 2 μm. e HEK293T-MCL-1-knockdown cells were transfected with MCL-1 WT or indicated mutants for 24 h, treated with OGD for 5 h. Cell lysates were immunoblotted with indicated antibodies. The numbers under the blots represent the gray scale quantification (Tom20/Tubulin, Tim23/Tubulin). f HEK293T cells were co-transfected with MCL-1-3xFlag and HA-LC3A for 24 h, treated with OGD for 5 h, and the interaction of Flag-tagged MCL-1 with HA-LC3A and endogenous Bax was analyzed by immunoprecipitation. Source data are provided as a Source Data file.
Fig. 6
Fig. 6. UMI-77 ameliorates cognitive decline and amyloid pathologies in the APP/PS1 mouse model of Alzheimer’s disease.
a mt-Keima signal induction by UMI-77 in the mt-Keima mouse brain hippocampus samples. Mice were injected with 10 mg/kg UMI-77 for 6 h and samples were analyzed by fluorescence microscopy (**p < 0.01 (P = 0.0083), two-tailed t test). Scale bar, 100 µm. b The number of times a mouse crossed the platform within 60 s after removing the platform by training with four days ((WT, n = 5), (APP/PS1 + Veh, n = 7), (APP/PS1 + UMI-77, n = 5), **p < 0.01 (P = 0.0053), two-tailed t test). c Latency to escape to a hidden platform in the Morris water maze during a 4-day training period ((WT, n = 5), (APP/PS1 + Veh, n = 7), (APP/PS1 + UMI-77, n = 5), *p < 0.05 (P = 0.0334), two-tailed t test). d Mice were treated as in b and brain tissues were analyzed for soluble and insoluble Aβ1–42 levels, using ELISA (mean ± S.E.M.; *p < 0.05 (P = 0.0463), two-tailed t test). Box plots indicate median (middle line), 25th, 75th percentile (box) and minima and maxima (whiskers). e Mice were treated as in b and IHC of whole brains was performed to stain for amyloid-beta (Aβ) plaques (6E10 antibody, green), astrocytes (GFAP antibody, red) and nuclei (DAPI, blue). Scale bar, 1000 μm; insets: Scale bar, 100 μm. f Mice were treated as in b and the levels of the indicated cytokine levels were measured by ELISA using whole brain lysates (mean ± S.E.M.; *p < 0.05, ns, not significant, two-tailed t test). Box plots indicate median (middle line), 25th, 75th percentile (box) and minima and maxima (whiskers). g Electron microscopy images of mice brain hippocampal tissues. Insets (blue boxes) show mitochondria. Scale bars, 5 µm; insets: Scale bars, 2 µm. Source data are provided as a Source Data file.

Comment in

References

    1. Kerr JS, et al. Mitophagy and Alzheimer’s disease: cellular and molecular mechanisms. Trends Neurosci. 2017;40:151–166. doi: 10.1016/j.tins.2017.01.002. - DOI - PMC - PubMed
    1. Yao J, et al. Mitochondrial bioenergetic deficit precedes Alzheimer’s pathology in female mouse model of Alzheimer’s disease. Proc. Natl. Acad. Sci. USA. 2009;106:14670–14675. doi: 10.1073/pnas.0903563106. - DOI - PMC - PubMed
    1. Lustbader JW, et al. ABAD directly links Abeta to mitochondrial toxicity in Alzheimer’s disease. Science. 2004;304:448–452. doi: 10.1126/science.1091230. - DOI - PubMed
    1. Qin WP, et al. PGC-1 alpha expression decreases in the alzheimer disease brain as a function of dementia. Arch. Neurol. 2009;66:352–361. doi: 10.1001/archneurol.2008.588. - DOI - PMC - PubMed
    1. Austin S, St-Pierre J. PGC1alpha and mitochondrial metabolism–emerging concepts and relevance in ageing and neurodegenerative disorders. J. Cell Sci. 2012;125:4963–4971. doi: 10.1242/jcs.113662. - DOI - PubMed

Publication types

MeSH terms