Comparative Study
. 2020 Nov 12;10(1):19707.
doi: 10.1038/s41598-020-76401-x.

Plasma metabolomics supports the use of long-duration cardiac arrest rodent model to study human disease by demonstrating similar metabolic alterations

Affiliations
Comparative Study

Plasma metabolomics supports the use of long-duration cardiac arrest rodent model to study human disease by demonstrating similar metabolic alterations

Muhammad Shoaib et al. Sci Rep. .

Abstract

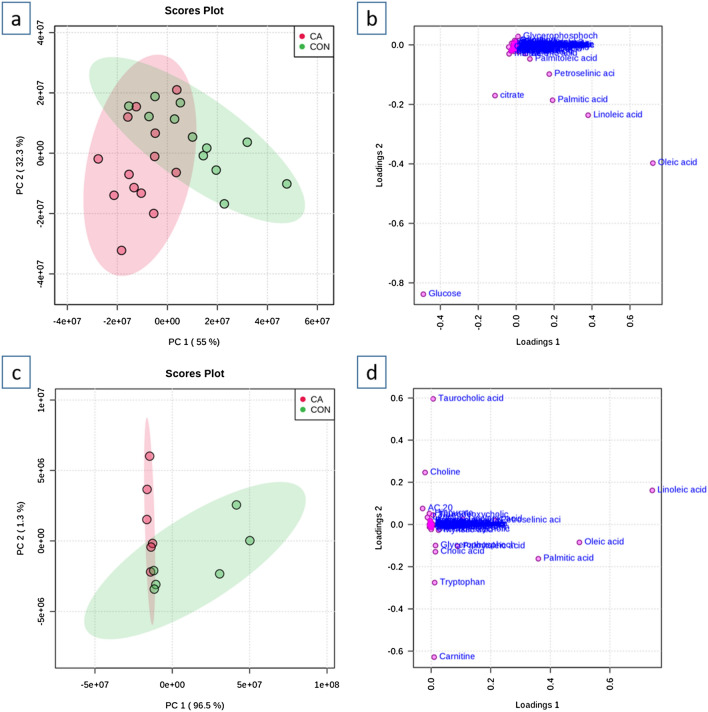
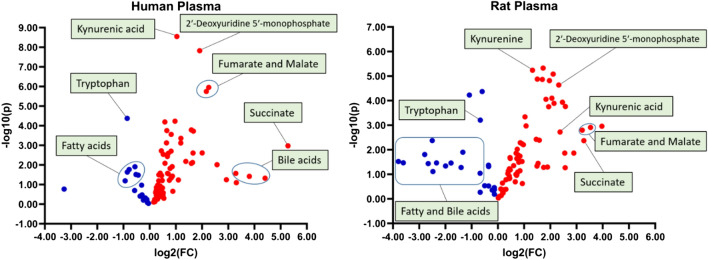
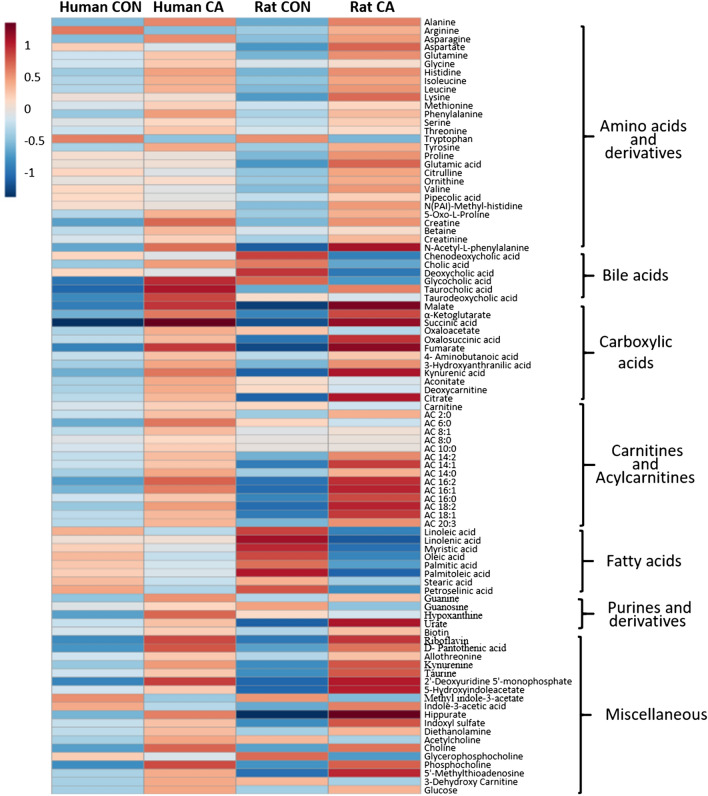
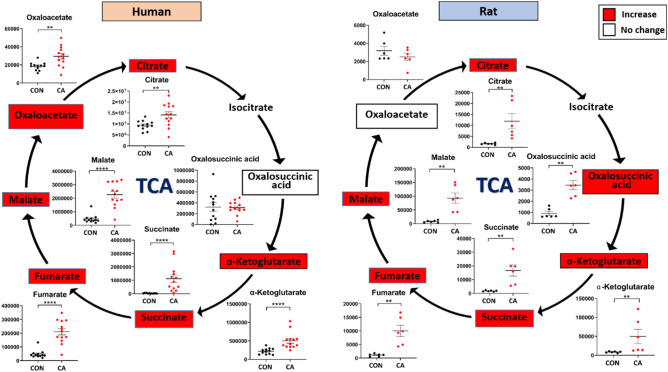
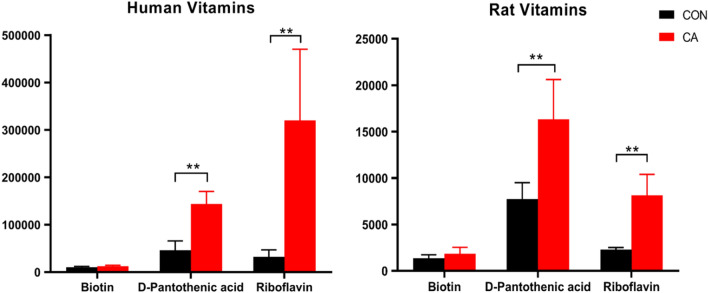
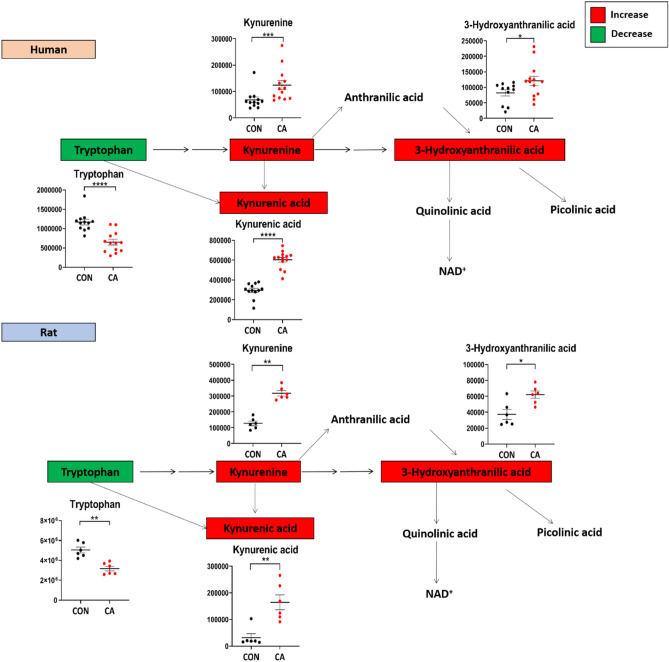
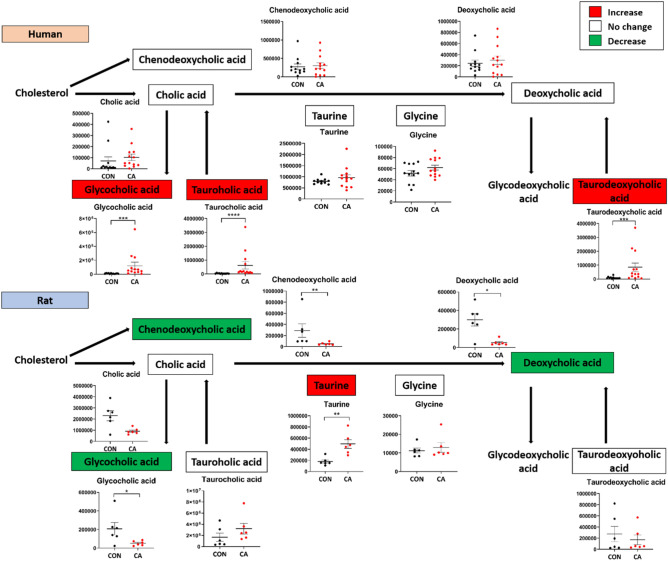
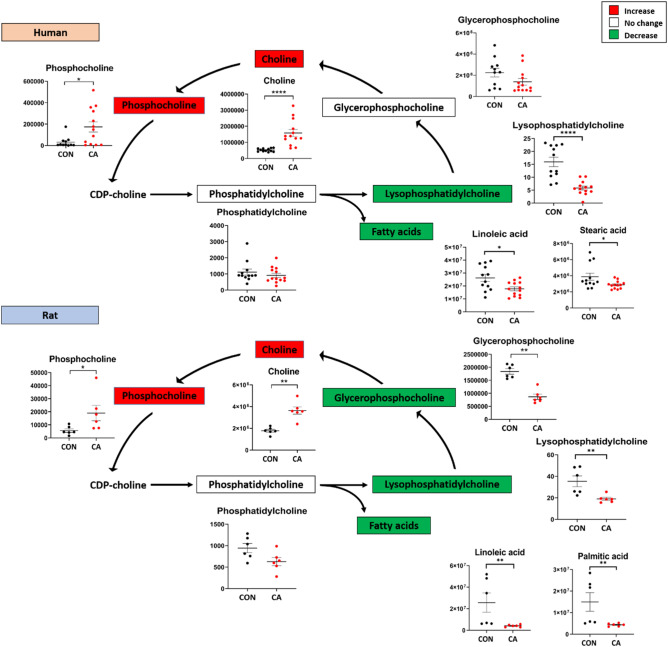
Cardiac arrest (CA) is a leading cause of death and there is a necessity for animal models that accurately represent human injury severity. We evaluated a rat model of severe CA injury by comparing plasma metabolic alterations to human patients. Plasma was obtained from adult human control and CA patients post-resuscitation, and from male Sprague-Dawley rats at baseline and after 20 min CA followed by 30 min cardiopulmonary bypass resuscitation. An untargeted metabolomics evaluation using UPLC-QTOF-MS/MS was performed for plasma metabolome comparison. Here we show the metabolic commonality between humans and our severe injury rat model, highlighting significant metabolic dysfunction as seen by similar alterations in (1) TCA cycle metabolites, (2) tryptophan and kynurenic acid metabolites, and (3) acylcarnitine, fatty acid, and phospholipid metabolites. With substantial interspecies metabolic similarity in post-resuscitation plasma, our long duration CA rat model metabolically replicates human disease and is a suitable model for translational CA research.


Conflict of interest statement

The authors declare no competing interests.

Figures

Figure 1
Figure 1
Principal Components Analysis of human and rat control and post-CA plasma. (a) Scores plot of metabolites from control and post-CA human plasma; (b) Loading plot of metabolites from control and post-CA human plasma; (c) Scores plot of metabolites from control and post-CA rat plasma; (d) Loading plot of metabolites from control and post-CA rat plasma. Although no complete separation was observed between control and post-CA plasma in both humans and rats, there is a noticeable metabolic difference that can be attributed to alterations in fatty acids, amino acids, and TCA metabolites as a function of CA and resuscitation. CON control, CA post-CA and resuscitation.
Figure 2
Figure 2
Metabolic disarray post-CA has a similar pattern in humans and rats. Volcano plot comparison of metabolites in human (left) and rat (right) plasma post-CA identifies substantial changes in metabolites via fold change. Red indicates increased levels, while blue indicates decreased levels.
Figure 3
Figure 3
Humans and rats have similar metabolic alteration patterns post-CA. Heatmap depicts major metabolite alterations in human and rat plasma after CA compared to a normalized control. Metabolites represented as means are arranged in their corresponding metabolic group. The colors of each metabolite represent the degree of variation after resuscitation as compared to control: red indicates increased levels, while blue indicates decreased levels. CON control, CA post-CA and resuscitation.
Figure 4
Figure 4
Highly similar TCA metabolite dysregulation post-CA in both humans and rats. Major metabolite alterations in the TCA cycle of human (left) and rat (right) plasma after CA. The colors of each metabolite correspond to the variation of that metabolite after resuscitation as compared to control: red indicates increased levels, while white indicates no change in levels. Both the human and rat plasma shows a substantial increase in almost all TCA metabolites post-resuscitation. CON control, CA post-CA and resuscitation, y-axis peak area. Data are displayed as mean ± SEM. Statistical analyses for each metabolite were performed using Mann–Whitney U test; **P < 0.01, ***P < 0.001, and ****P < 0.0001.
Figure 5
Figure 5
Similar vitamin alterations post-CA. Alterations in three water-soluble, B vitamins in humans (left) and rats (right) after CA as compared with their respective controls. Both human and rat plasma show a substantial increase in the levels of D-pantothenic acid and riboflavin after CA. CON control, CA post-CA and resuscitation, y-axis peak area. Data are displayed as mean ± SEM. Statistical analyses for each metabolite were performed using Mann–Whitney U test; **P < 0.01.
Figure 6
Figure 6
Highly dysregulated kynurenic acid pathway metabolites post-CA reveals similar dysfunction in humans and rats. Plasma kynurenic acid pathway metabolite alterations in human (top) and rat (bottom) plasma after CA. The colors of each metabolite correspond to the variation of that metabolite after resuscitation as compared to control: red indicates increased levels, while green indicates decreased levels. Both human and rat plasma show a substantial increase in most kynurenic acid pathway metabolites and a substantial decrease in tryptophan levels. CON control, CA post-CA and resuscitation, y-axis peak area. Data are displayed as mean ± SEM. Statistical analyses for each metabolite were performed using Mann–Whitney U test; *P < 0.05, **P < 0.01, ***P < 0.001, and ****P < 0.0001.
Figure 7
Figure 7
Bile acid metabolites reveal less similarity in post-CA alterations in humans and rats. Bile acid metabolite alterations in human (top) and rat (bottom) plasma after CA. The colors of each metabolite correspond to the variation of that metabolite after resuscitation as compared to control: red indicates increased levels, green indicates decreased levels, while white indicates no change in levels. The bile acid levels in humans and rats show some dissimilarity after resuscitation, such that a general increase in the conjugated bile acids, particularly the taurine conjugated acids, was observed in human plasma, while a general decreasing trend was observed in the rats with the exception of taurine. CON control, CA post-CA and resuscitation, y-axis peak area. Data are displayed as mean ± SEM. Statistical analyses for each metabolite were performed using Mann–Whitney U test; *P < 0.05, **P < 0.01, ***P < 0.001, and ****P < 0.0001.
Figure 8
Figure 8
Choline and Phospholipid metabolites have similar alterations post-CA. Choline metabolite alterations in human (top) and rat (bottom) plasma after CA. The colors of each metabolite correspond to the variation of that metabolite after resuscitation as compared to control: red indicates increased levels, green indicates decreased levels, while white indicates no change in levels. Both human and rat plasma post-CA display a substantial increase in choline and phosphocholine, while showing a decrease in certain fatty acids. CON control, CA post-CA and resuscitation, y-axis peak area. Data are displayed as mean ± SEM. Statistical analyses for each metabolite were performed using Mann–Whitney U test; *P < 0.05, **P < 0.01, ***P < 0.001, and ****P < 0.0001.

Similar articles

Cited by

References

    1. Jacobs I, et al. Cardiac arrest and cardiopulmonary resuscitation outcome reports: update and simplification of the Utstein templates for resuscitation registries. A statement for healthcare professionals from a task force of the international liaison committee on resuscitation (American Heart Association, European Resuscitation Council, Australian Resuscitation Council, New Zealand Resuscitation Council, Heart and Stroke Foundation of Canada, InterAmerican Heart Foundation, Resuscitation Council of Southern Africa) Resuscitation. 2004;63:233–249. doi: 10.1016/j.resuscitation.2004.09.008. - DOI - PubMed
    1. Patel, K. & Hipskind, J. E. in StatPearls (2019).
    1. Patil KD, Halperin HR, Becker LB. Cardiac arrest: Resuscitation and reperfusion. Circ. Res. 2015;116:2041–2049. doi: 10.1161/CIRCRESAHA.116.304495. - DOI - PMC - PubMed
    1. Gilmore CM, Rea TD, Becker LJ, Eisenberg MS. Three-phase model of cardiac arrest: Time-dependent benefit of bystander cardiopulmonary resuscitation. Am. J. Cardiol. 2006;98:497–499. doi: 10.1016/j.amjcard.2006.02.055. - DOI - PubMed
    1. Weisfeldt ML, Becker LB. Resuscitation after cardiac arrest: A 3-phase time-sensitive model. JAMA. 2002;288:3035–3038. doi: 10.1001/jama.288.23.3035. - DOI - PubMed

Publication types