. 2020 Nov 12;10(1):19662.
doi: 10.1038/s41598-020-76710-1.

Mathematical modelling of the dynamics and containment of COVID-19 in Ukraine

Affiliations

Mathematical modelling of the dynamics and containment of COVID-19 in Ukraine

Yuliya N Kyrychko et al. Sci Rep. .

Abstract

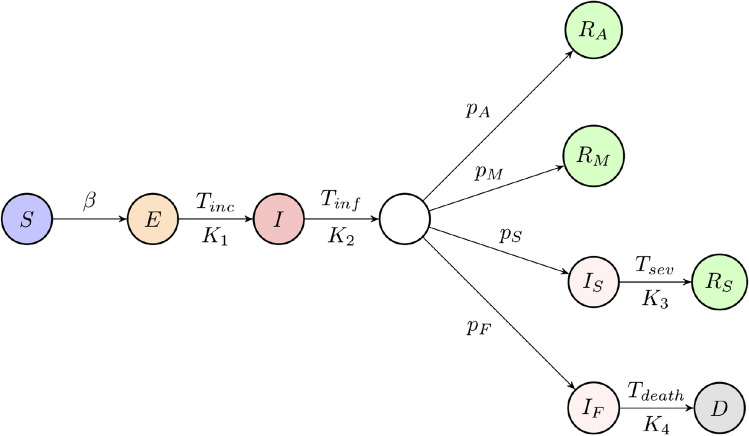
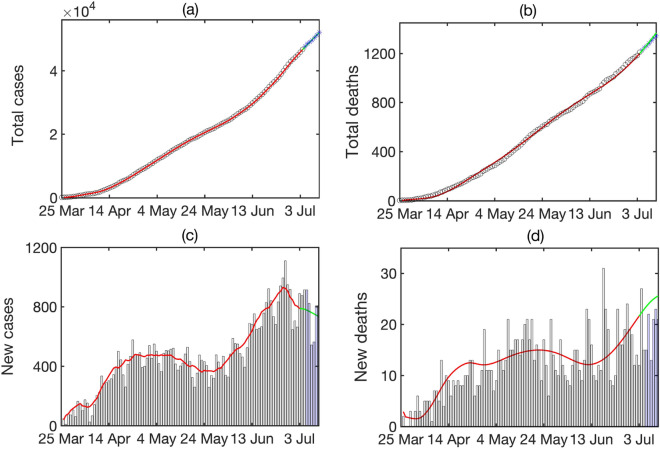
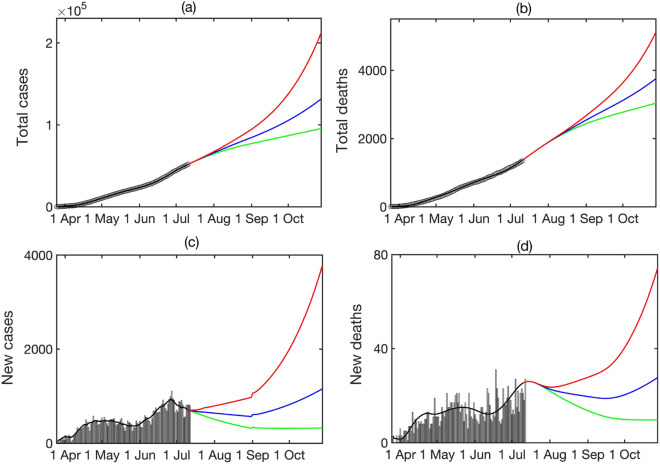
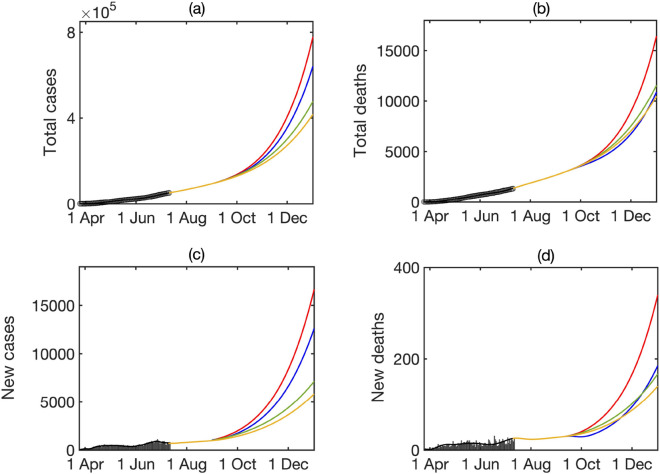
COVID-19 disease caused by the novel SARS-CoV-2 coronavirus has already brought unprecedented challenges for public health and resulted in huge numbers of cases and deaths worldwide. In the absence of effective vaccine, different countries have employed various other types of non-pharmaceutical interventions to contain the spread of this disease, including quarantines and lockdowns, tracking, tracing and isolation of infected individuals, and social distancing measures. Effectiveness of these and other measures of disease containment and prevention to a large degree depends on good understanding of disease dynamics, and robust mathematical models play an important role in forecasting its future dynamics. In this paper we focus on Ukraine, one of Europe's largest countries, and develop a mathematical model of COVID-19 dynamics, using latest data on parameters characterising clinical features of disease. For improved accuracy, our model includes age-stratified disease parameters, as well as age- and location-specific contact matrices to represent contacts. We show that the model is able to provide an accurate short-term forecast for the numbers and age distribution of cases and deaths. We also simulated different lockdown scenarios, and the results suggest that reducing work contacts is more efficient at reducing the disease burden than reducing school contacts, or implementing shielding for people over 60.


Conflict of interest statement

The authors declare no competing interests.

Figures

Figure 1
Figure 1
Schematic diagram of the disease transmission model. Each circle represents one of the compartments, arrows represent transitions between compartments, and letters above/below arrows represent the rates of those transitions. The pairs (Tinc,K1), (Tinf,K2), (Tsev,K3), and (Tdeath,K4) describe, respectively, incubation time, infectious period, hospital recovery period, and time to death, where the first element of each pair is the corresponding time period, and the second element of each pair describes the number of stages in the gamma distribution of that time period.
Figure 2
Figure 2
Distributions of incubation time, hospital recovery period, and time to death. Histograms show actual data from, black curves are fitted gamma distributions with the corresponding parameters.
Figure 3
Figure 3
Total numbers of cases and deaths, and the daily numbers of cases and deaths. Black circles (black histograms) show actual data, red line shows simulation of the model (2), green line shows a projection using simulation of model (2), blue stars (blue histograms) show latest actual data. All data are taken from.
Figure 4
Figure 4
Age distribution of COVID-19 cases and deaths on the 10 July 2020 from the data and from the simulation of model (2).
Figure 5
Figure 5
Longer-term forecast of epidemic dynamics of model (2) continuing with an overall transmission rate β as of 10 July 2020 (green), or the same rate being increased uniformly for all age groups by 10% (blue), and 20% (red) over initial 2 weeks, and then staying constant for the remaining duration of simulation.
Figure 6
Figure 6
Modelling the effects of different quarantine strategies. Red line indicates the baseline forecast for a 20% increased transmission rate without any quarantine measures, green line denotes a 30% reduction in school contacts, blue line denotes a 50% shielding of over 60+ introduced gradually over 2 weeks, and light-brown line denotes a 30% reduction in work contacts. All intervention measures are introduced on the 1st September and are compared to a baseline shown in red.
Figure 7
Figure 7
Population age distribution in Ukraine.
Figure 8
Figure 8
Age-specific and location-specific social contact matrices for Ukraine. The colour code denotes an average number of daily contacts between individuals in different age groups at each type of location, with lighter colours representing a higher degree of mixing. White regions indicate little to no mixing between the corresponding age groups.

References

    1. Li Q, et al. Early transmission dynamics in Wuhan, China, of novel Coronavirus-infected pneumonia. N. Engl. J. Med. 2020;382:1199–1207. doi: 10.1056/NEJMoa2001316. - DOI - PMC - PubMed
    1. Chan JF-W, et al. A familial cluster of pneumonia associated with the 2019 novel coronavirus indicating person-to-person transmission: a study of a family cluster. Lancet. 2020;395:514–523. doi: 10.1016/S0140-6736(20)30154-9. - DOI - PMC - PubMed
    1. Tuite AR, Fisman DN, Greer AL. Mathematical modelling of COVID-19 transmission and mitigation strategies in the population of Ontario, Canada. CMAJ. 2020;192:E497–E505. doi: 10.1503/cmaj.200476. - DOI - PMC - PubMed
    1. Giordano G, et al. Modelling the COVID-19 epidemic and implementation of population-wide interventions in Italy. Nat. Med. 2020;26:855–860. doi: 10.1038/s41591-020-0883-7. - DOI - PMC - PubMed
    1. Tsay C, Lejarza F, Stadtherr MA, Baldea M. Modeling, state estimation and optimal control for the US COVID-19 outbreak. Sci. Rep. 2020;10:10711. doi: 10.1038/s41598-020-67459-8. - DOI - PMC - PubMed

MeSH terms