. 2020 Nov 12;10(1):19759.
doi: 10.1038/s41598-020-75755-6.

Metabolomics profiling of plasma, urine and saliva after short term training in young professional football players in Saudi Arabia

Affiliations

Metabolomics profiling of plasma, urine and saliva after short term training in young professional football players in Saudi Arabia

Mansour A Alzharani et al. Sci Rep. .

Abstract

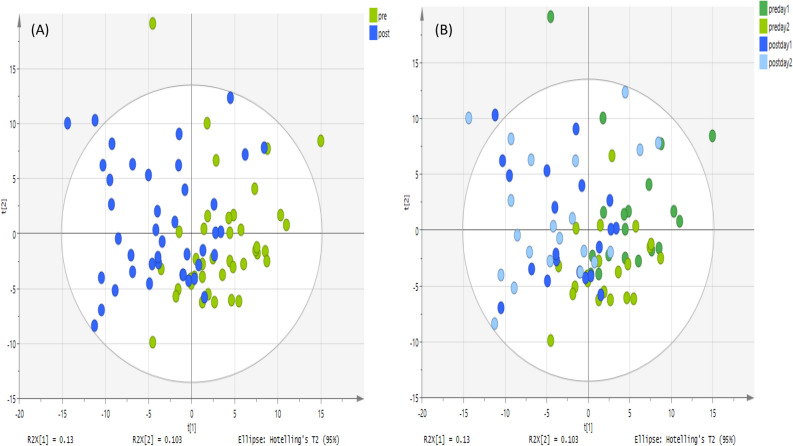
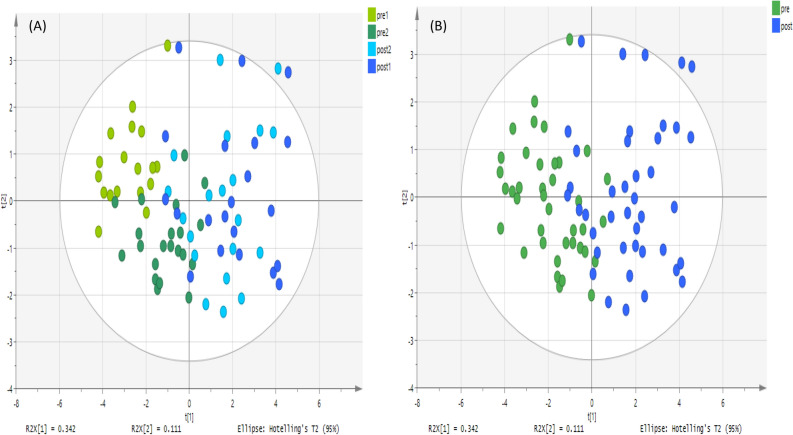
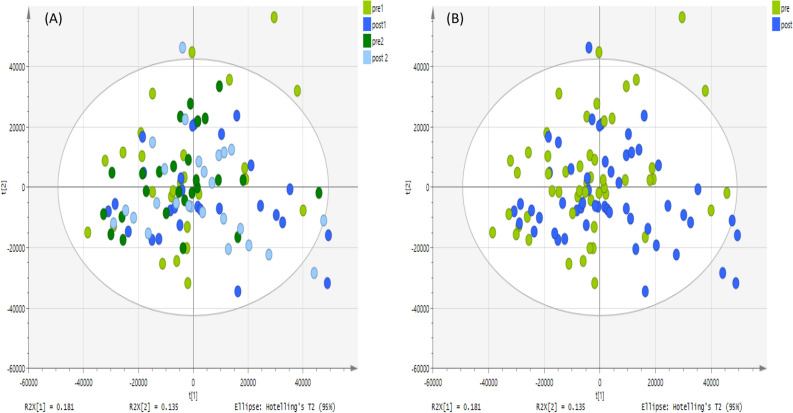
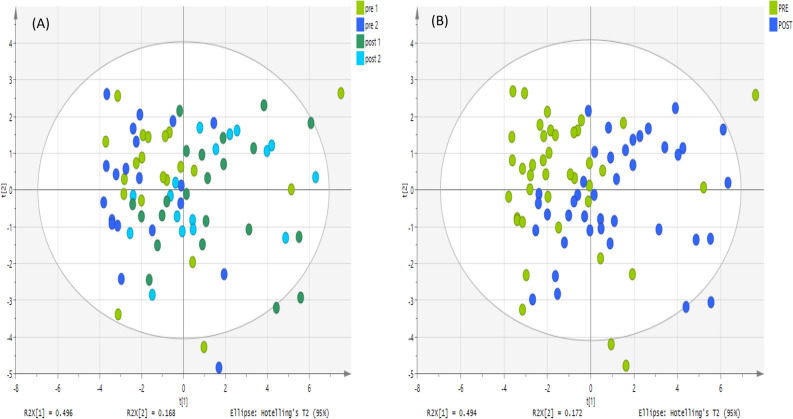
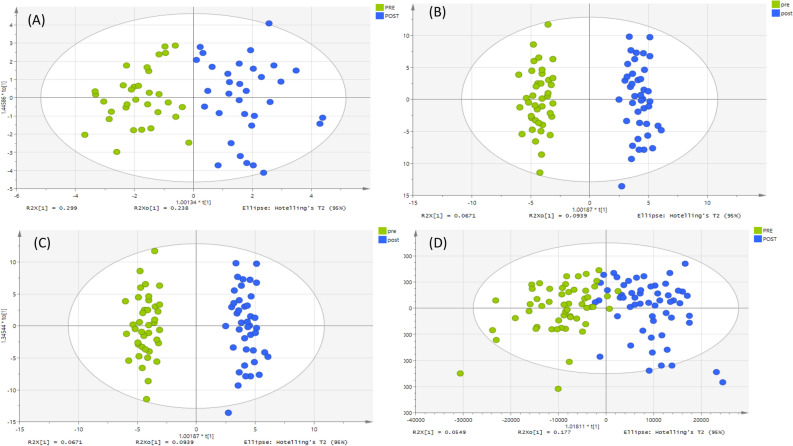
Metabolomics profiling was carried out to observe the effect of short-term intensive physical activity on the metabolome of young Saudi professional football players. Urine, plasma and saliva were collected on 2 days pre- and post-training. An Orbitrap Exactive mass spectrometer was used to analyze the samples. A reversed-phase (RP) column was used for the analysis of non-polar plasma metabolites, and a ZIC-pHILIC column was used for the analysis of plasma, saliva and urine. mzMine was used to extract the data, and the results were modelled using Simca-P 14.1 software. There was no marked variation in the metabolite profiles between pre day 1 and 2 or between post day 1 and 2 according to principal components analysis (PCA). When orthogonal partial least squares (OPLSDA) modelling was also used, and then models could be fitted based on a total number of metabolites of 75, 16 and 32 for urine, plasma and saliva using hydrophilic interaction chromatography (HILIC) and 6 for analysis of plasma with reversed-phase (RP) chromatography respectively. The present study concludes that acylcarnitine may increase post-exercise in football players suggesting that they may burn fat rather than glucose. The levels of carnitine metabolites in plasma post-exercise could provide an important indicator of fitness.


Conflict of interest statement

The authors declare no competing interests.

Figures

Figure 1
Figure 1
PCA score plot. It shows groups of plasma samples based on 211 metabolites analyzed on a ZIC-pHILIC column. The data was Pareto scaled. (A) Green is control; pre-training for both day 1 and 2 respectively (n = 40), and blue is treated; post-training for both day 1 and 2 respectively (n = 40), (B) green and light green are control; pre-training for both day 1 and 2 respectively, (n = 20 of each day) and blue and light blue are treated; post-training for both day 1 and 2 respectively (n = 20 for each day).
Figure 2
Figure 2
PCA score plot. It shows groups of urine samples based on 126 metabolites analyzed on a ZIC-pHILIC column. The data was Pareto scaled. (A) Green and light green are controls; pre-training for both day 1 and 2 respectively (n = 20 of each day). Blue and light blue are treated; post-training for both day 1 and 2 respectively (n = 20 of each day), (B) green is control; pre-training for both day 1 and 2 respectively, (n = 40), and blue is treated; post-training for both day 1 and 2 respectively (n = 40).
Figure 3
Figure 3
PCA score plot. It shows groups of saliva samples based on 331 putative metabolites analyzed on a ZIC-pHILIC column. The data was Pareto scaled. (A) Green and light green are controls; pre-training for both day 1 and 2 respectively (n = 26 of each day), and blue and light blue are treated; post-training for both day 1 and 2 respectively (n = 26 of each day), (B) green is control; pre-training for both day 1 and 2 respectively (n = 52) and blue is treated; post-training for both day 1 and 2 respectively (n = 52).
Figure 4
Figure 4
PCA score plot. It shows groups of plasma samples based on 20 metabolites analyzed on an ACE C4 column. The data was Pareto scaled. (A) Green and blue are control; pre-training for both day 1 and 2 respectively (n = 20 of each day), and light green and light blue are treated; post-training for both day 1 and 2 respectively (n = 20 of each day), (B) green is control; pre-training for both day 1 and 2 respectively (n = 40) and blue is treated; post-training for both day 1 and 2 respectively (n = 40).
Figure 5
Figure 5
OPLS-DA score plots for day 1. The samples according to their classification; green represents the pre-training samples, while blue represents the post-training. The models were fitted based on: (A) 20 putative metabolites in plasma samples, analyzed on an ACE C4 column (B) 211 putative metabolites in plasma samples, analyzed on a ZIC-pHILIC column, (C) 126 putative metabolites in urine samples, analyzed on a ZIC-pHILIC column, (D) 331 putative metabolites in saliva samples, analyzed on a ZIC-pHILIC column, the data was Pareto scaled and log 2 transformed.

References

    1. Cecchini M, et al. Tackling of unhealthy diets, physical inactivity, and obesity: Health effects and cost-effectiveness. Lancet. 2010;376:1775–1784. doi: 10.1016/S0140-6736(10)61514-0. - DOI - PubMed
    1. Sarris J, O’Neil A, Coulson CE, Schweitzer I, Berk M. Lifestyle medicine for depression. BMC Psychiatry. 2014;14:107. doi: 10.1186/1471-244X-14-107. - DOI - PMC - PubMed
    1. Drust B, Reilly T, Cable NT. Physiological responses to laboratory-based soccer-specific intermittent and continuous exercise. J. Sports Sci. 2000;18:885–892. doi: 10.1080/026404100750017814. - DOI - PubMed
    1. Sparling PB, O’Donnell EM, Snow TK. The gender difference in distance running performance has plateaued: An analysis of world rankings from 1980 to 1996. Med. Sci. Sports Exerc. 1998;30:1725–1729. doi: 10.1097/00005768-199812000-00011. - DOI - PubMed
    1. Baker AB, Tang YQ. Aging performance for masters records in athletics, swimming, rowing, cycling, triathlon, and weightlifting. Exp. Aging Res. 2010;36:453–477. doi: 10.1080/0361073X.2010.507433. - DOI - PubMed

Publication types