. 2020 Nov 12;10(1):19617.
doi: 10.1038/s41598-020-76824-6.

Acetylsalicylic acid and salicylic acid present anticancer properties against melanoma by promoting nitric oxide-dependent endoplasmic reticulum stress and apoptosis

Affiliations

Acetylsalicylic acid and salicylic acid present anticancer properties against melanoma by promoting nitric oxide-dependent endoplasmic reticulum stress and apoptosis

Priscila Ausina et al. Sci Rep. .

Abstract

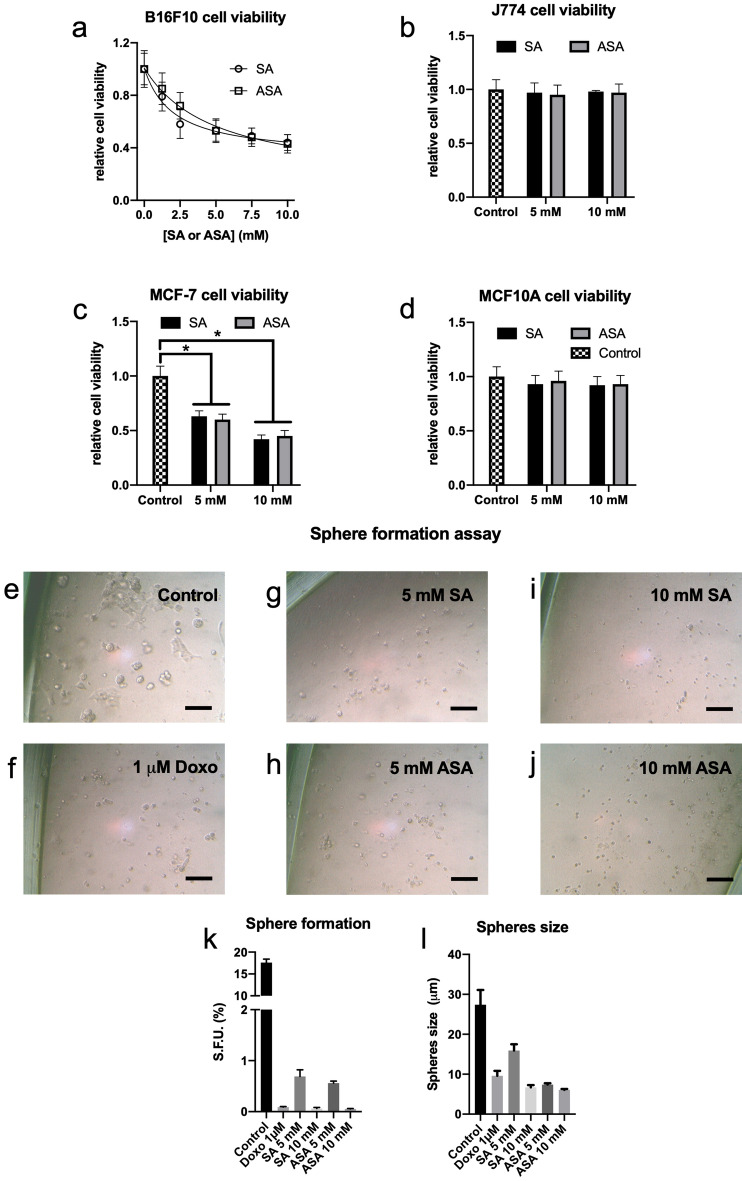
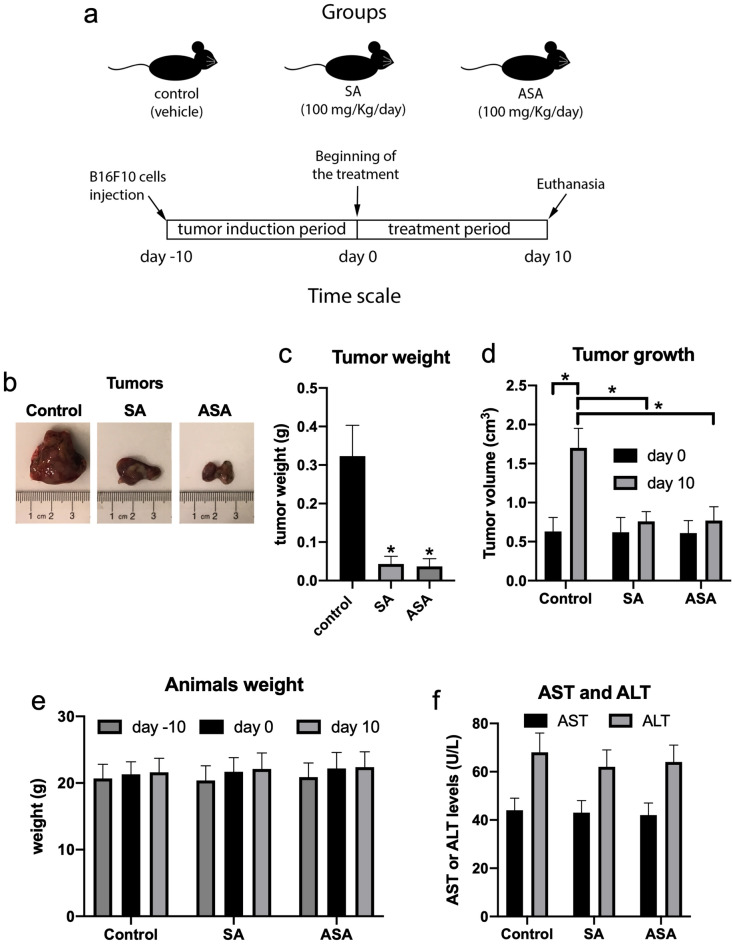
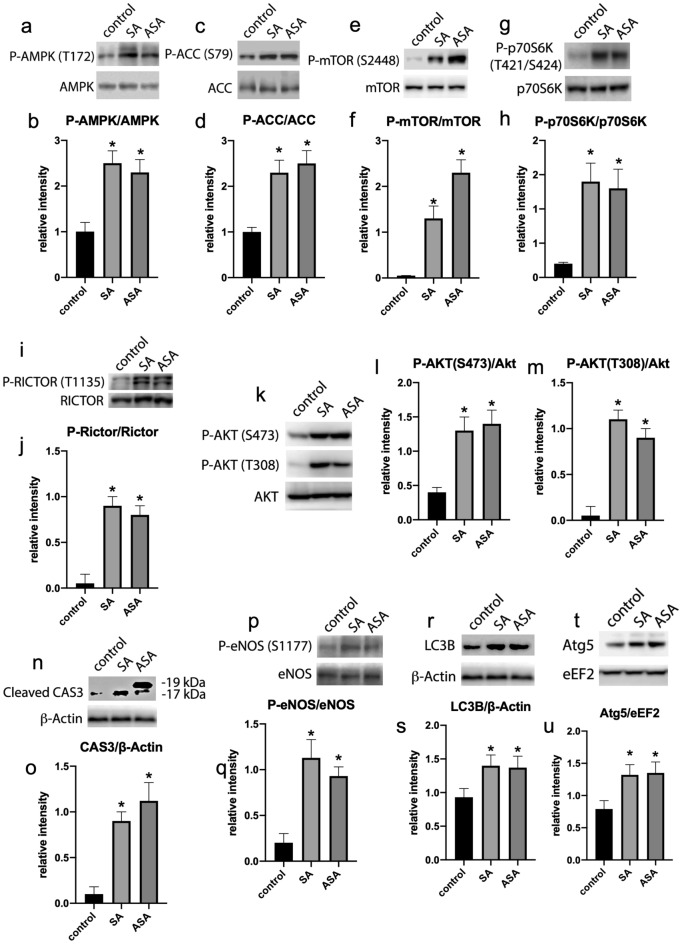
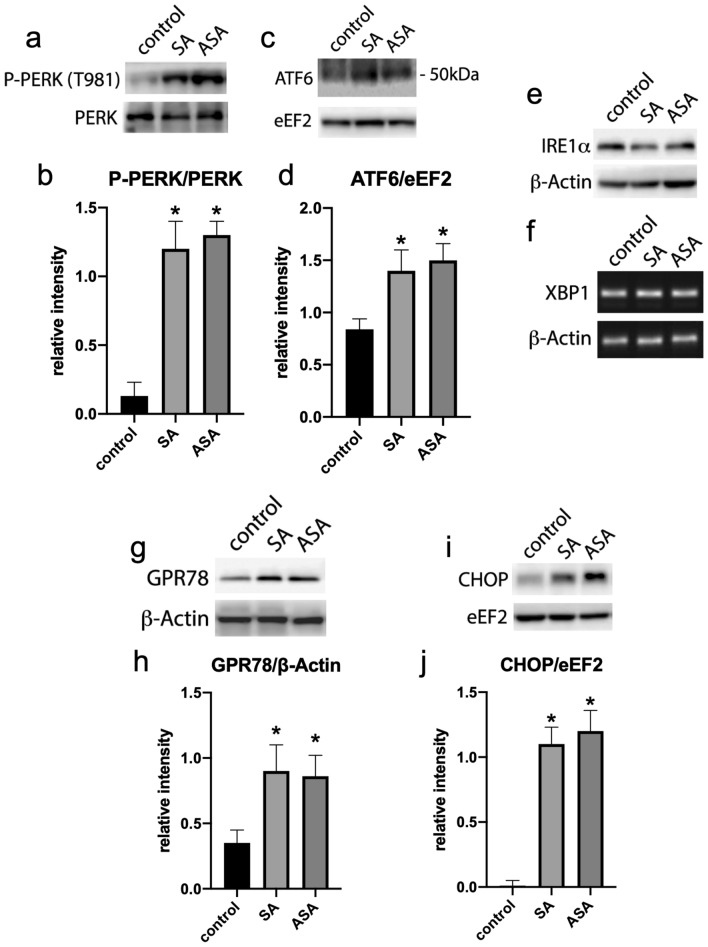
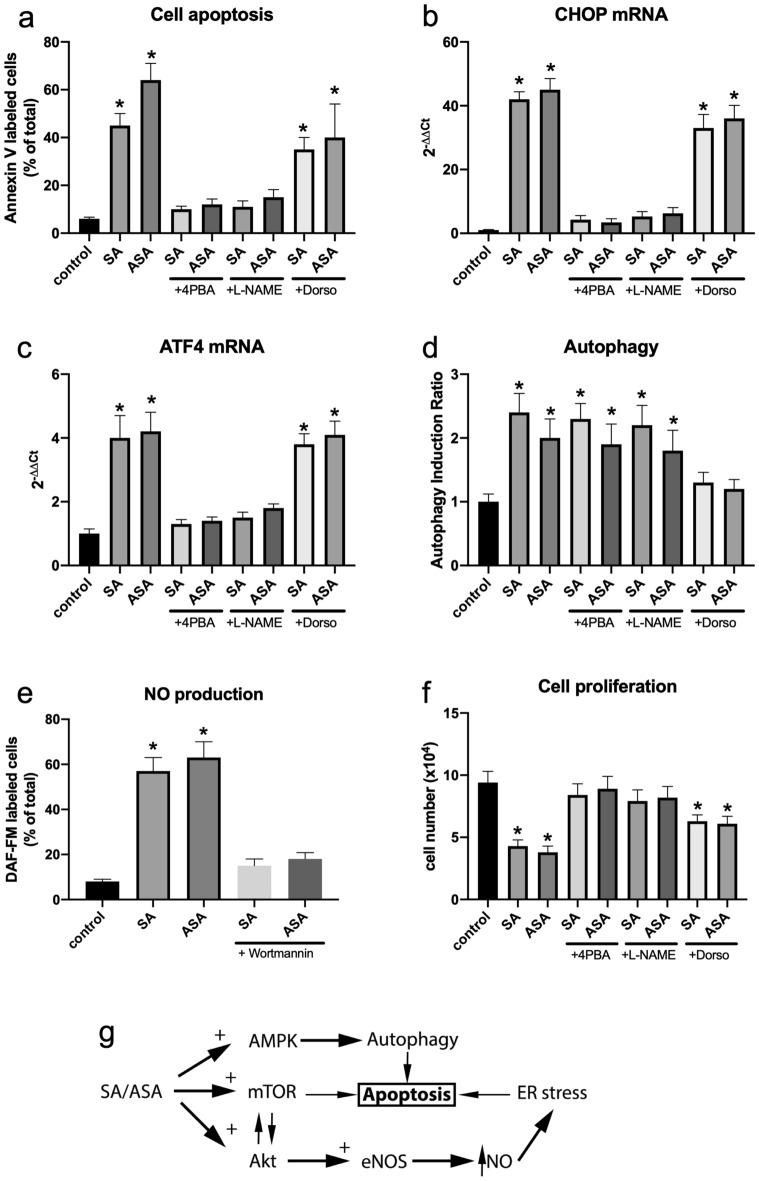
Melanoma is the most aggressive and fatal type of skin cancer due to being highly proliferative. Acetylsalicylic acid (ASA; Aspirin) and salicylic acid (SA) are ancient drugs with multiple applications in medicine. Here, we showed that ASA and SA present anticancer effects against a murine model of implanted melanoma. These effects were also validated in 3D- and 2D-cultured melanoma B16F10 cells, where the drugs promoted pro-apoptotic effects. In both in vivo and in vitro models, SA and ASA triggered endoplasmic reticulum (ER) stress, which culminates with the upregulation of the pro-apoptotic transcription factor C/EBP homologous protein (CHOP). These effects are initiated by ASA/SA-triggered Akt/mTOR/AMPK-dependent activation of nitric oxide synthase 3 (eNOS), which increases nitric oxide and reactive oxygen species production inducing ER stress response. In the end, we propose that ASA and SA instigate anticancer effects by a novel mechanism, the activation of ER stress.


Conflict of interest statement

The authors declare no competing interests.

Figures

Figure 1
Figure 1
SA and ASA reduced cancer cells viability and impeded sphere formation capability in a 3D culture model. B16F10 (Panel a), J774 (Panel b), MCF-7 (Panel c) and MCF10A (Panel d) cells were grown in 2D cultures and treated with the concentrations of SA or ASA indicated on the abscissa for 24 h. These results are presented as the mean ± S.E.M of 4 independent experiments (n = 4). Panels ej: Representative optical microscopy pictures of 3D-cultured B16F10 cells untreated (b) or treated with 1 µM doxorubicin (c), 5 mM SA (d), 5 mM ASA (e), 10 mM SA (f) and 10 mM ASA (g). Panels k and l: quantification of the numbers and the size, respectively, of spheres formed. These results are represented as mean ± S.E.M of 3 independent experiments (n = 3). * means P < 0.05 as compared to the control (One-way ANOVA followed by Dunnett post-test).
Figure 2
Figure 2
The anticancer effects of SA and ASA on a murine model of implanted melanoma. Panel a: design of the animal protocol. Panel b: representative pictures of the tumors extracted from untreated animals and those treated with SA or ASA. Panels c and d: tumors weight and tumors growth, respectively, comparing the control treatment with SA and ASA treatments. Panel e: average values for the mice body weight during the treatment. Panel f: average values for the activity of the liver enzymes AST and ALT in the serum of the animals. Values are mean ± S.E.M. of 8 different animals in each group (n = 8). * means P < 0.05 as compared to the control (One-way ANOVA followed by Dunnett post-test).
Figure 3
Figure 3
Signaling pathways profiles in the tumors extracted from animals treated or not with SA or ASA. Western blots displayed are the whole processed strips, as indicated in “Material and methods” and are representative samples of each group and represented in the graphics as mean ± S.E.M. of 8 different animals (n = 8). Panels a and b: AMPK and phospho-AMPK (T172). Panels c and d: ACC and phospho-ACC (S79). Panels e and f: mTOR and phospho-mTOR (S2448). Panels g and h: p70S6K and phospho-p70S6K (T421/S424). Panels i and j: Rictor and phospho-Rictor (T1135). Panels k, l, and m: Akt and phospho-Akt (T308 or S473). Panels n and o: cleaved CAS3 and ß-Actin (Different exposition periods for cleaved CAS3 are presented in supplementary material, Fig. S3). Panels p and q: eNOS and phospho-eNOS (S1177). Panels r and s: LC3B and ß-Actin. Panels t and u: Atg5 and eEF2. *Means P < 0.05 as compared to the control (One-way ANOVA followed by Dunnett post-test).
Figure 4
Figure 4
ER stress response evaluation in the tumors extracted from animals treated or not with SA or ASA. Western blots displayed are the whole processed strips, as indicated in “Material and methods” and are representative samples of each group and represented in the graphics as mean ± S.E.M. of 8 different animals (n = 8). Panels a and b: PERK and phospho-PERK (T981). Panels c and d: ATF6 and eEF2. Panel e: IRE1α. Panel f: XBP1. Panels g and h: GPR78 and ß-Actin. Panels i and j: CHOP and eEF2. *means P < 0.05 as compared to the control (One-way ANOVA followed by Dunnett post-test).
Figure 5
Figure 5
Reversal of SA and ASA effects on B16F10 cells by the inhibitor of the signaling pathways. Plotted values are mean ± S.E.M. of 3–4 independent experiments (n = 3–4). Panel a: apoptosis. Panel b: CHOP mRNA levels. Panel c: ATF4 mRNA levels. Panel d: autophagy. Panel e: NO production. Panel f: cell proliferation. Panel g: scheme for SA and ASA action. *means P < 0.05 as compared to the control (One-way ANOVA followed by Dunnett post-test).

References

    1. Hotamisligil GS, Davis RJ. Cell signaling and stress responses. Cold Spring Harb. Perspect. Biol. 2016;8:a006072. doi: 10.1101/cshperspect.a006072. - DOI - PMC - PubMed
    1. Tabas I, Ron D. Integrating the mechanisms of apoptosis induced by endoplasmic reticulum stress. Nat. Cell Biol. 2011;13:184–190. doi: 10.1038/ncb0311-184. - DOI - PMC - PubMed
    1. Yang Y, et al. Transcription factor C/EBP homologous protein in health and diseases. Front. Immunol. 2017;8:1612. doi: 10.3389/fimmu.2017.01612. - DOI - PMC - PubMed
    1. Ron D, Walter P. Signal integration in the endoplasmic reticulum unfolded protein response. Nat. Rev. Mol. Cell Biol. 2007;8:519–529. doi: 10.1038/nrm2199. - DOI - PubMed
    1. Hanahan D, Weinberg RA. Hallmarks of cancer: the next generation. Cell. 2011;144:646–674. doi: 10.1016/j.cell.2011.02.013. - DOI - PubMed

Publication types

MeSH terms