. 2020 Nov 12;10(1):19637.
doi: 10.1038/s41598-020-76750-7.

Transcriptome profiling and weighted gene co-expression network analysis of early floral development in Aquilegia coerulea

Affiliations

Transcriptome profiling and weighted gene co-expression network analysis of early floral development in Aquilegia coerulea

Ya Min et al. Sci Rep. .

Abstract

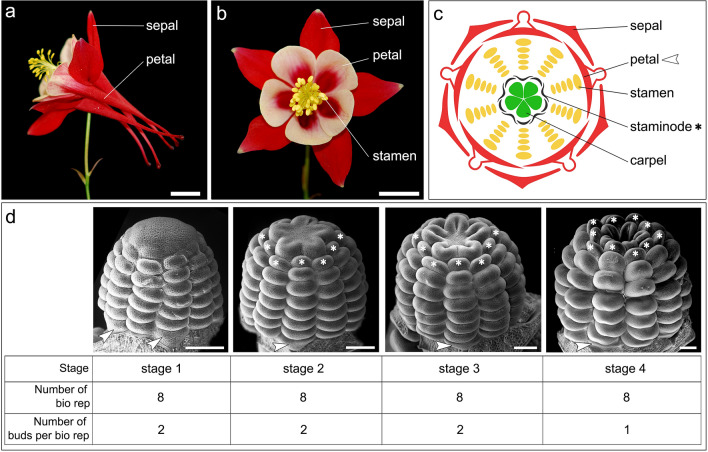
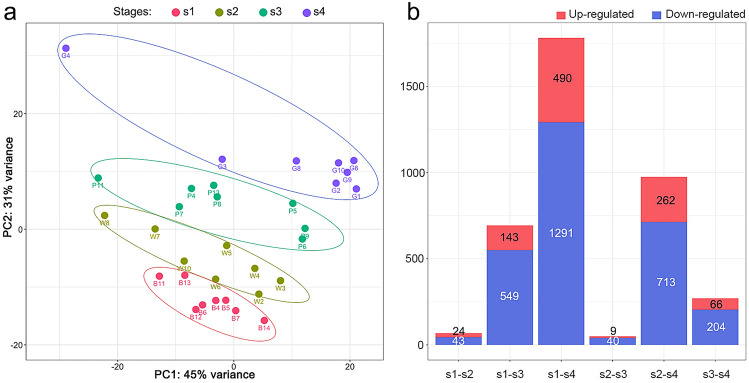
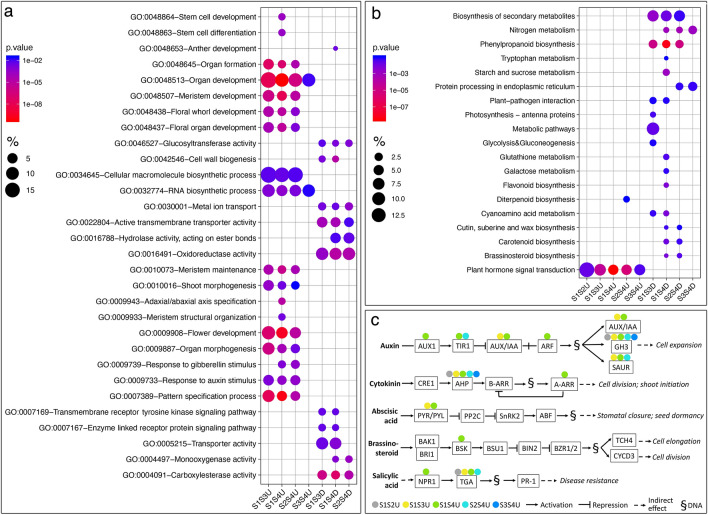
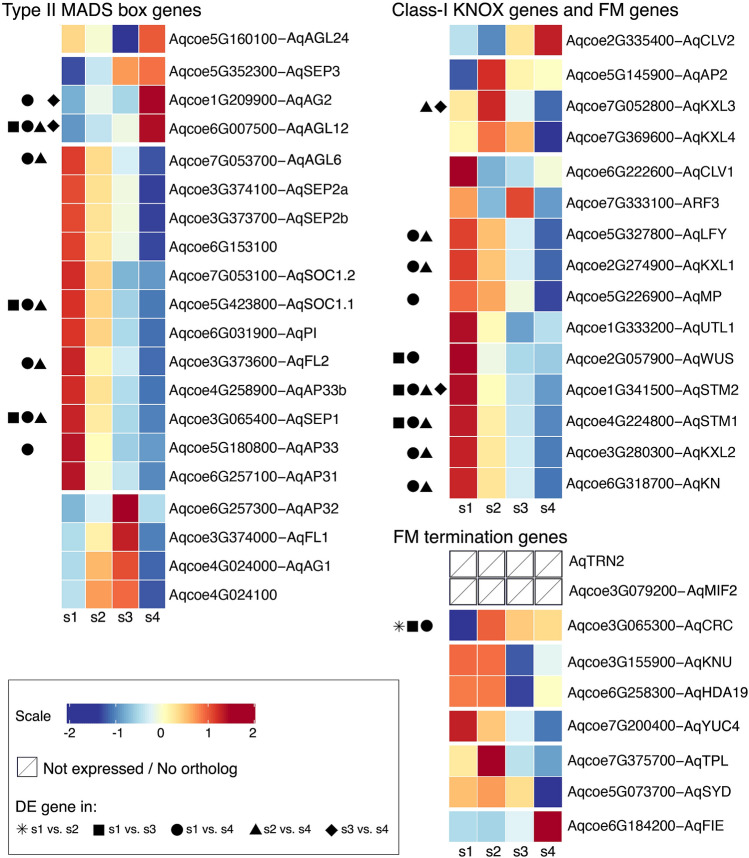
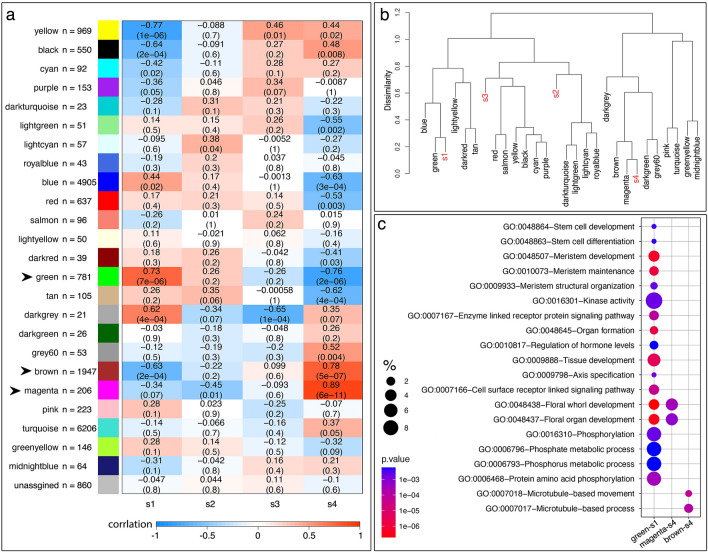
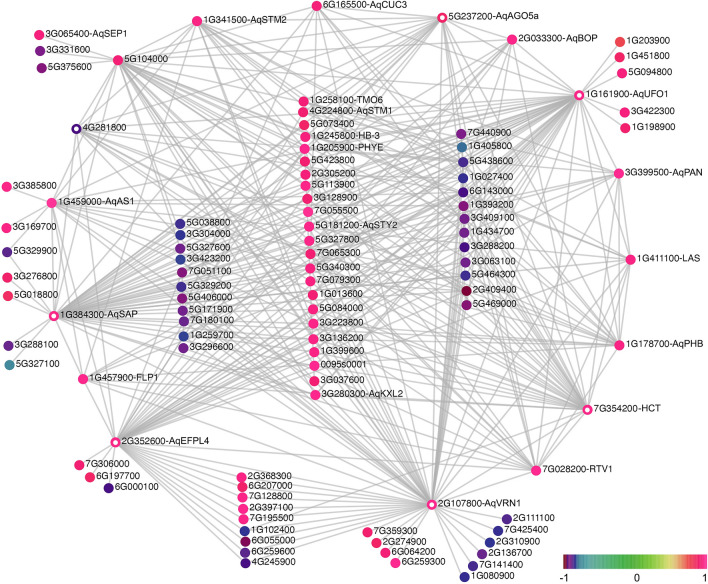
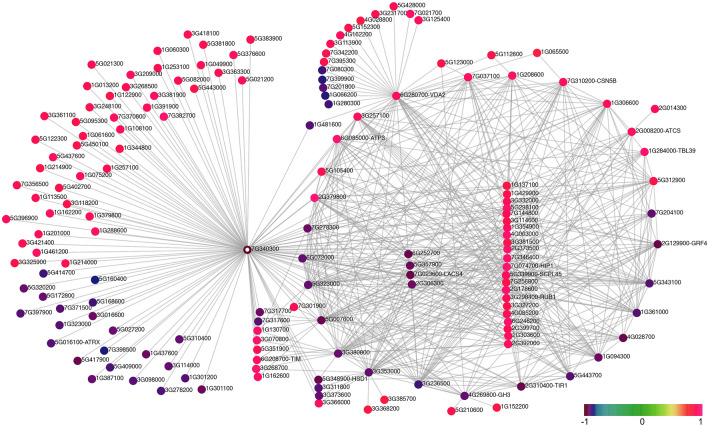
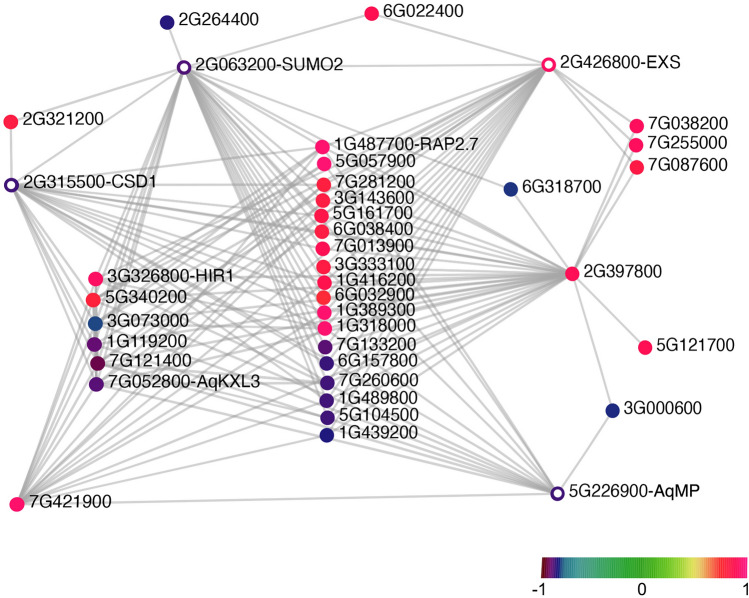
The earliest phases of floral development include a number of crucial processes that lay the foundation for the subsequent morphogenesis of floral organs and success in reproduction. Currently, key transcriptional changes during this developmental window have been characterized in the model species Arabidopsis thaliana, but little is known about how transcriptional dynamics change over the course of these developmental processes in other plant systems. Here, we have conducted the first in-depth transcriptome profiling of early floral development in Aquilegia at four finely dissected developmental stages, with eight biological replicates per stage. Using differential gene expression analysis and weighted gene co-expression network analysis, we identified both crucial genes whose expression changes mark the transitions between developmental stages and hub genes in co-expression modules. Our results support the potential functional conservation of key genes in early floral development that have been identified in other systems, but also reveal a number of previously unknown or overlooked loci that are worthy of further investigation. In addition, our results highlight not only the dynamics of transcriptional regulation during early floral development, but also the potential involvement of the complex, essential networks of small RNA and post-translational regulation to these developmental stages.


Conflict of interest statement

The authors declare no competing interests.

Figures

Figure 1
Figure 1
A. coerulea and the floral developmental stages used for RNA-seq. (a) Side view of a mature A. coerulea flower. (b) Front view of a mature A. coerulea flower. (c) Floral diagram of a typical A. coerulea flower. (d) Developmental stages, the number of biological replicates per stage, and the number of floral buds used for each biological replicate that were used for RNA-seq. Asterisks indicate staminodes and arrowheads indicate petals. Scale bar: a,b = 1 cm; d = 100 µm.
Figure 2
Figure 2
PCA of normalized reads of all samples (a) and bar plot summary of DE genes between developmental stages (b).
Figure 3
Figure 3
GO term and KEGG pathway enrichment analysis of DE genes. (a) Selected enriched GO terms from different DE comparisons. (b) Selected enriched KEGG pathways from different DE comparisons. (c) Enriched plant hormone signal transduction pathways from different DE comparisons. % in a and b were calculated as: number of genes that hit the specific GO term or KEGG pathway/total number of genes in the input DE list*100. Each DE comparison is noted as: earlier stage vs. later stage, up- (U) or down (D)-regulated at the earlier stage.; for instance: S1S2U means genes that are DE between s1 and s2 and are up-regulated at s1.
Figure 4
Figure 4
Expression profiles of type-II MADS-box genes, class-I KNOX genes, and genes involved in FM maintenance and termination pathways. Expression levels of each gene over the developmental stages were scaled as the average expression of all biological replicates per stage subtracted by the average expression of all replicates of all stages, then divided by the standard deviation of the expression of all replicates of all stages. DE genes were indicated with symbols of each DE comparison.
Figure 5
Figure 5
Associating gene co-expression modules with developmental stages. (a) Correlation between module eigengene values and the developmental stages. The first number in each cell represents the correlation value, and the second number in the parenthesis represents the p-value of the correlation. Arrowheads pointed to modules of interest. (b) Hierarchical clustering dendrogram of the eigengenes of modules and the developmental stages. (c) Selected GO term enriched from modules of interest. % was calculated as: number of genes hit the specific GO term/total number of genes in the input list*100.
Figure 6
Figure 6
Gene network of module green-s1. Color scale represents the value of MM for each gene. The “Aqcoe” prefix of a gene identifier was removed to facilitate the visualization. All the genes with the largest number of connections are at the periphery of the network (i.e., genes in the center have fewer connections compared to genes at the periphery). Genes that are presented as colored circles (instead of a solid dot) are genes that were discussed in the main text.
Figure 7
Figure 7
Gene network of module brown-s4. Color scale represents the value of MM for each gene. The “Aqcoe” prefix of a gene identifier was removed to facilitate the visualization. All the genes with the largest number of connections are at the periphery of the network (i.e. genes in the center have fewer connections compared to genes at the periphery). Genes that are presented as colored circles (instead of a solid dot) are genes that were discussed in the main text.
Figure 8
Figure 8
Gene network of module magenta-s4. Color scale represents the value of MM for each gene. The “Aqcoe” prefix of a gene identifier was removed to facilitate the visualization. Genes that are presented as colored circles (instead of a solid dot) are genes that were discussed in the main text.

Similar articles

Cited by

References

    1. Coen ES, Meyerowitz EM. The war of the whorls: genetic interactions controlling flower development. Nature. 1991;353:31–37. doi: 10.1038/353031a0. - DOI - PubMed
    1. Ditta G, Pinyopich A, Robles P, Pelaz S, Yanofsky MF. The SEP4 gene of arabidopsis thaliana functions in floral organ and meristem identity. Curr. Biol. 2004;14:1935–1940. doi: 10.1016/j.cub.2004.10.028. - DOI - PubMed
    1. Schoof H, et al. The stem cell population of Arabidopsis shoot meristems is maintained by a regulatory loop between the CLAVATA and WUSCHEL genes. Cell. 2000;100:635–644. doi: 10.1016/S0092-8674(00)80700-X. - DOI - PubMed
    1. Sun B, Xu Y, Ng K-H, Ito T. A timing mechanism for stem cell maintenance and differentiation in the Arabidopsis floral meristem. Genes Dev. 2009;23:1791–1804. doi: 10.1101/gad.1800409. - DOI - PMC - PubMed
    1. Sun B, et al. Timing mechanism dependent on cell division is invoked by polycomb eviction in plant stem cells. Science. 2014;343:1248559–1248559. doi: 10.1126/science.1248559. - DOI - PubMed

Publication types

MeSH terms