

Effects of nitrogen fertilization and bioenergy crop species on central tendency and spatial heterogeneity of soil glycosidase activities
- PMID: 33184435
- PMCID: PMC7664997
- DOI: 10.1038/s41598-020-76837-1
Effects of nitrogen fertilization and bioenergy crop species on central tendency and spatial heterogeneity of soil glycosidase activities
Abstract
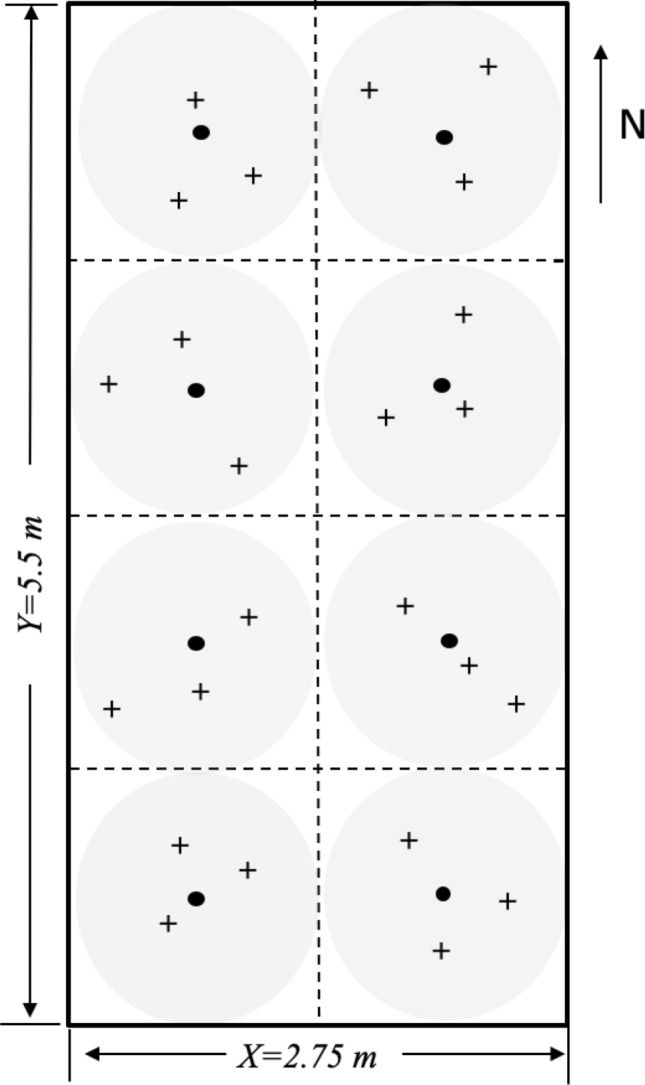
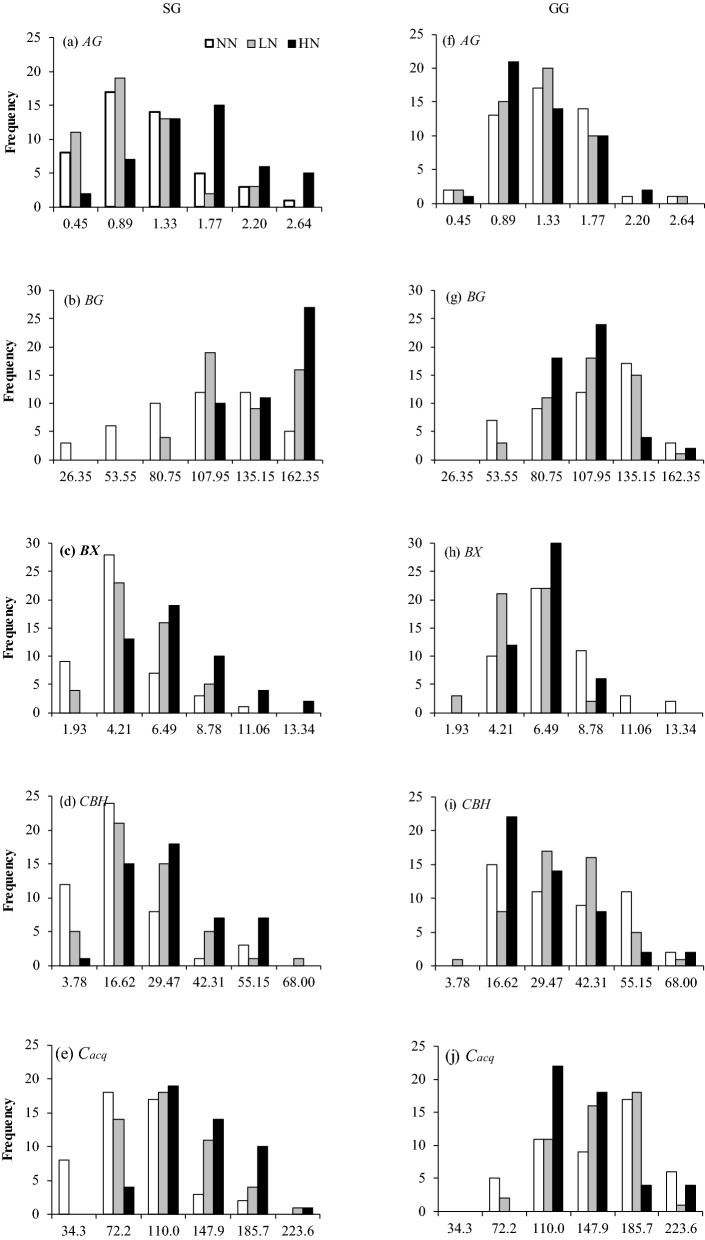
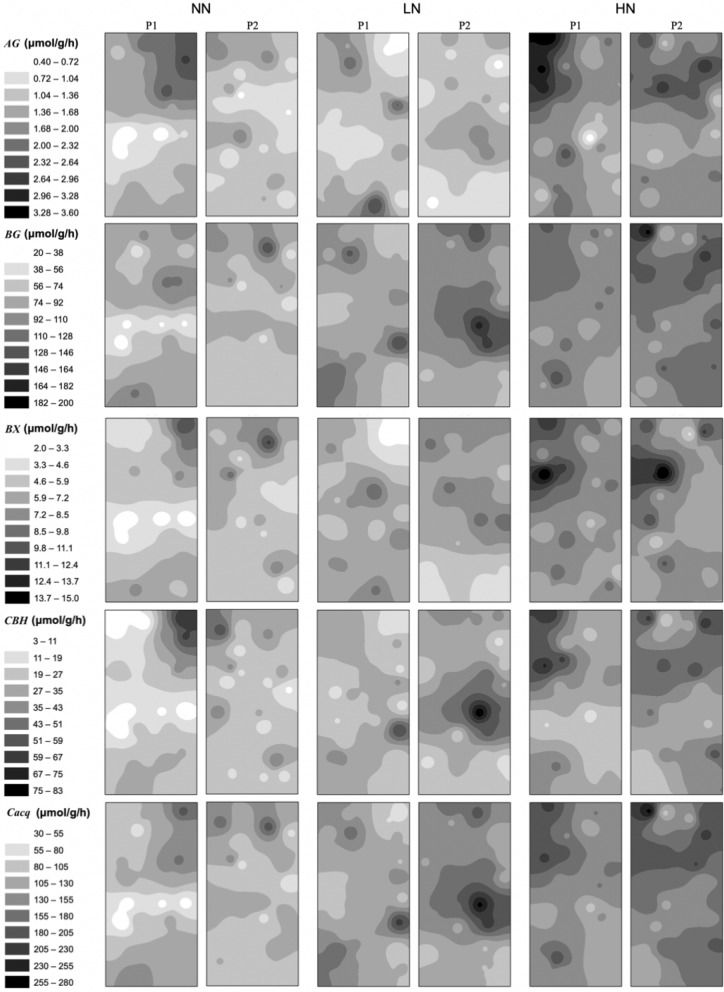
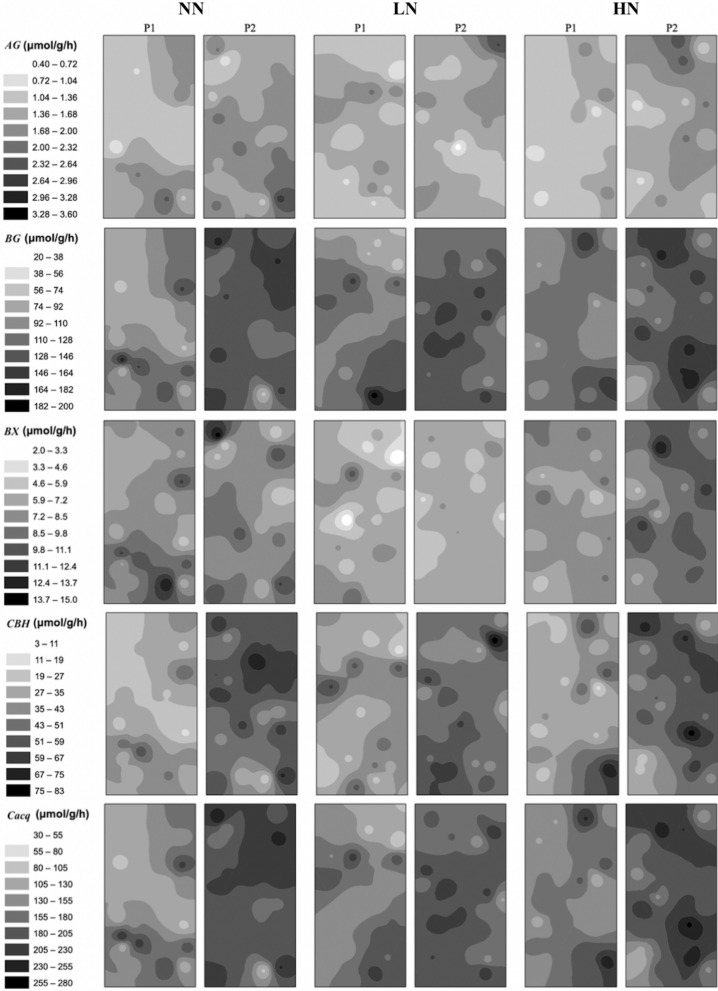
Extracellular glycosidases in soil, produced by microorganisms, act as major agents for decomposing labile soil organic carbon (e.g., cellulose). Soil extracellular glycosidases are significantly affected by nitrogen (N) fertilization but fertilization effects on spatial distributions of soil glycosidases have not been well addressed. Whether the effects of N fertilization vary with bioenergy crop species also remains unclear. Based on a 3-year fertilization experiment in Middle Tennessee, USA, a total of 288 soil samples in topsoil (0-15 cm) were collected from two 15 m2 plots under three fertilization treatments in switchgrass (SG: Panicum virgatum L.) and gamagrass (GG: Tripsacum dactyloides L.) using a spatially explicit design. Four glycosidases, α-glucosidase (AG), β-glucosidase (BG), β-xylosidase (BX), cellobiohydrolase (CBH), and their sum associated with C acquisition (Cacq) were quantified. The three fertilization treatments were no N input (NN), low N input (LN: 84 kg N ha-1 year-1 in urea) and high N input (HN: 168 kg N ha-1 year-1 in urea). The descriptive and geostatistical approaches were used to evaluate their central tendency and spatial heterogeneity. Results showed significant interactive effects of N fertilization and crop type on BX such that LN and HN significantly enhanced BX by 14% and 44% in SG, respectively. The significant effect of crop type was identified and glycosidase activities were 15-39% higher in GG than those in SG except AG. Within-plot variances of glycosidases appeared higher in SG than GG but little differed with N fertilization due to large plot-plot variation. Spatial patterns were generally more evident in LN or HN plots than NN plots for BG in SG and CBH in GG. This study suggested that N fertilization elevated central tendency and spatial heterogeneity of glycosidase activities in surficial soil horizons and these effects however varied with crop and enzyme types. Future studies need to focus on specific enzyme in certain bioenergy cropland soil when N fertilization effect is evaluated.
Conflict of interest statement
The authors declare no competing interests.
Figures


References
-
- Monti A, Barbanti L, Zatta A, Zegada-Lizarazu W. The contribution of switchgrass in reducing GHG emissions. GCB Bioenergy. 2012;4:420–434.
-
- Gelfand I, Sahajpal R, Zhang X, Izaurralde RC, Gross KL, Robertson GP. Sustainable bioenergy production from marginal lands in the US Midwest. Nature. 2013;493:514–517. - PubMed
-
- Kering MK, Butler TJ, Biermacher JT, Mosali J, Guretzky JA. Effect of potassium and nitrogen fertilizer on switchgrass productivity and nutrient removal rates under two harvest systems on a low potassium soil. Bioenergy Res. 2012;6:329–335.
-
- Owens VN, et al. Nitrogen use in switchgrass grown for bioenergy across the USA. Biomass Bioenergy. 2013;58:286–293.
-
- Ramirez KS, Lauber CL, Knight R, Bradford MA, Fierer N. Consistent effects of nitrogen fertilization on soil bacterial communities in contrasting systems. Ecology. 2010;91:3463–3470. - PubMed
Publication types
LinkOut - more resources
Full Text Sources
Research Materials
