. 2020 Nov 12;10(1):19737.
doi: 10.1038/s41598-020-76881-x.

Systematic comparison and assessment of RNA-seq procedures for gene expression quantitative analysis

Affiliations

Systematic comparison and assessment of RNA-seq procedures for gene expression quantitative analysis

Luis A Corchete et al. Sci Rep. .

Abstract

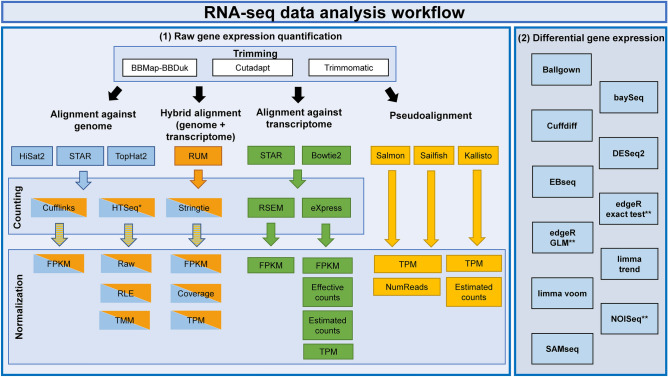
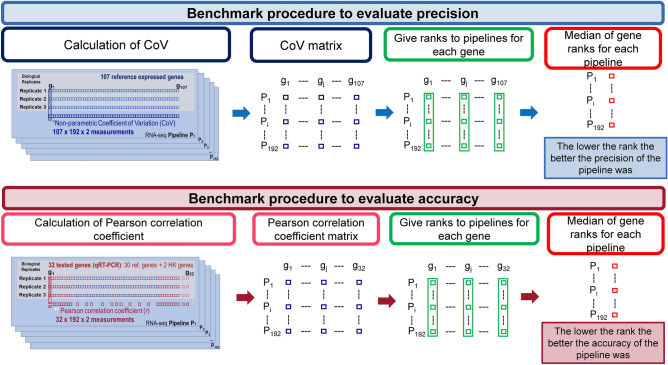
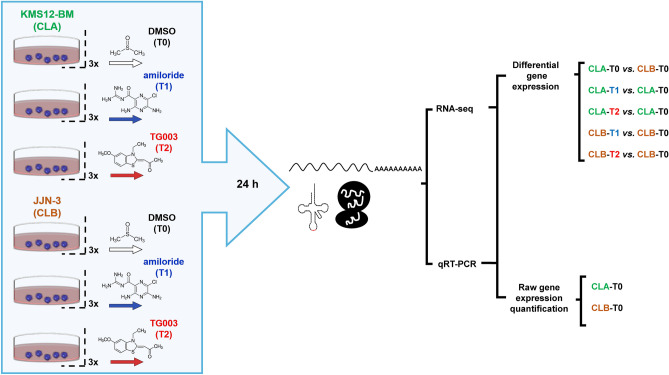
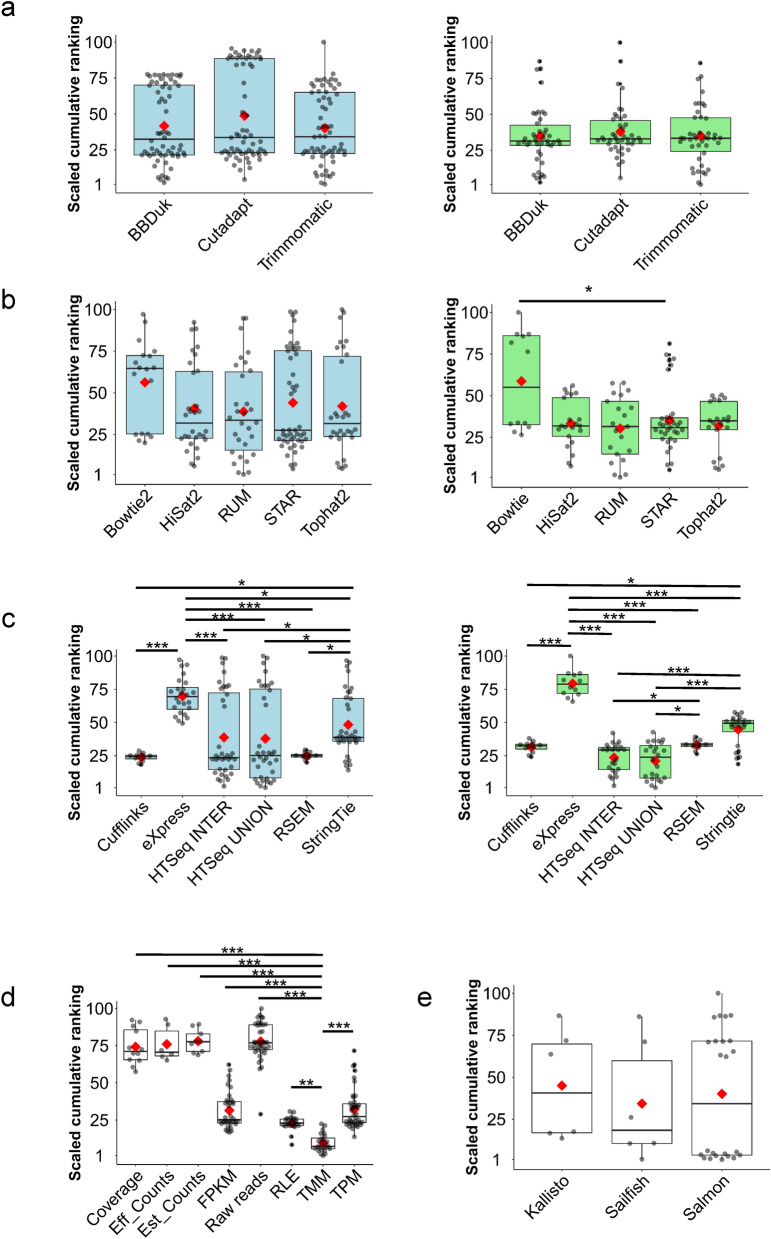
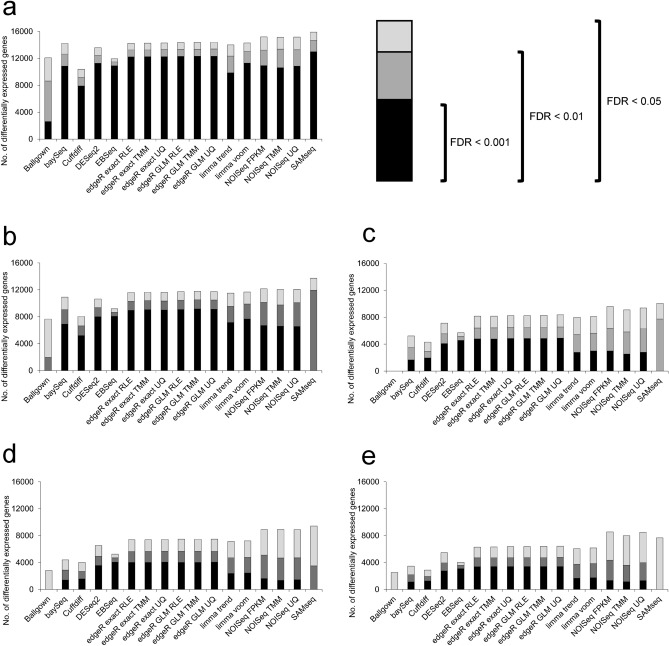
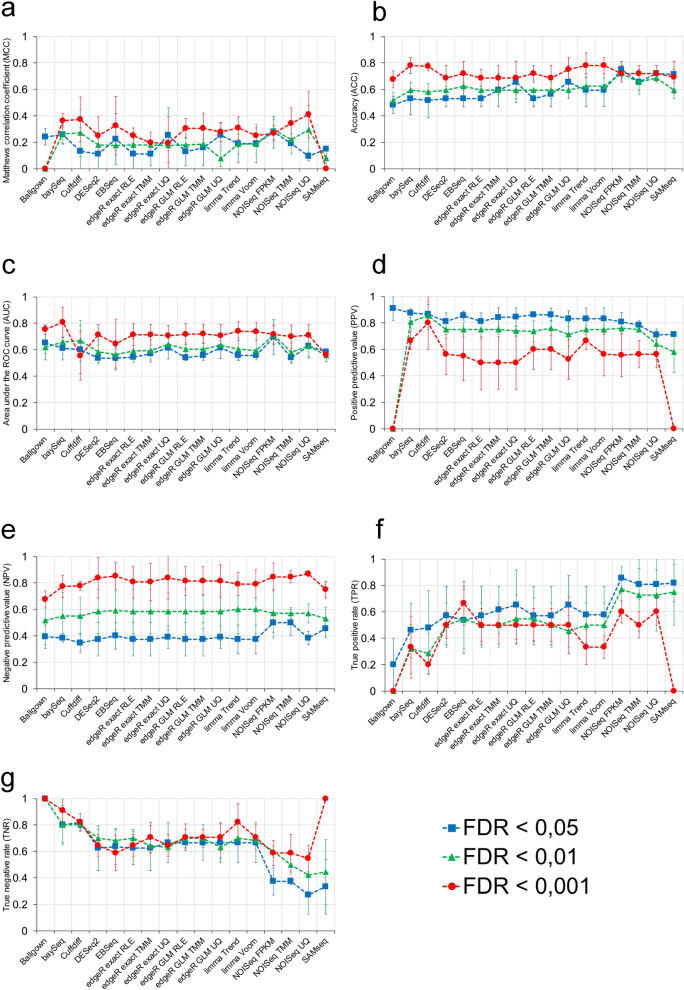
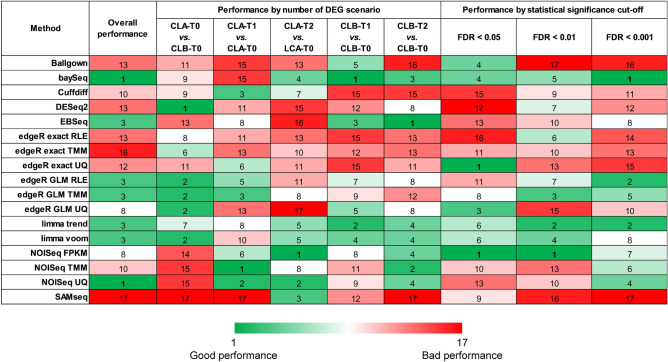
RNA-seq is currently considered the most powerful, robust and adaptable technique for measuring gene expression and transcription activation at genome-wide level. As the analysis of RNA-seq data is complex, it has prompted a large amount of research on algorithms and methods. This has resulted in a substantial increase in the number of options available at each step of the analysis. Consequently, there is no clear consensus about the most appropriate algorithms and pipelines that should be used to analyse RNA-seq data. In the present study, 192 pipelines using alternative methods were applied to 18 samples from two human cell lines and the performance of the results was evaluated. Raw gene expression signal was quantified by non-parametric statistics to measure precision and accuracy. Differential gene expression performance was estimated by testing 17 differential expression methods. The procedures were validated by qRT-PCR in the same samples. This study weighs up the advantages and disadvantages of the tested algorithms and pipelines providing a comprehensive guide to the different methods and procedures applied to the analysis of RNA-seq data, both for the quantification of the raw expression signal and for the differential gene expression.


Conflict of interest statement

N.C.G. Honoraria: Janssen. The other authors declare no competing interests.

Figures

Figure 1
Figure 1
RNA-seq analysis workflow. Left panel (1) represents the raw gene expression quantification workflow. Every box contains the algorithms and methods used for the RNA-seq analysis at trimming, alignment, counting, normalization and pseudoalignment levels. The right panel (2) represents the algorithms used for the differential gene expression quantification. *HTSeq was performed in two modes: union and intersection-strict. **EdgeR exact test, edgeR GLM and NOISeq have internally three normalization techniques that were evaluated separately.
Figure 2
Figure 2
Benchmark procedure to evaluate precision and accuracy. Description of the procedure to evaluate the precision (top) and the accuracy (bottom) in the RNA-seq analysis.
Figure 3
Figure 3
Experimental procedure. Two multiple myeloma cell lines (KMS12-BM [CLA] and JJN-3 [CLB]), two drugs (Amiloride [T1] and TG003 [T2]), and dimethyl-sulfoxide (DMSO) (treatment 0 [T0]) were used to conduct the RNA-seq and the qRT-PCR experiments. Control samples were used to carry out the raw gene expression quantification study, whilst all the 18 samples were used to perform the differential gene expression analysis.
Figure 4
Figure 4
Influence of the algorithms on the RNA-seq raw gene expression quantification. Box-plot analysis of the 192 pipelines grouped by the algorithms used at each step of the procedure: (a) trimming algorithms, (b) alignment algorithms (c) counting methods, (d) normalization methods and (e) pseudoalignment algorithms. Coloured boxplots represent the scaled values (between 1 and 100) of the summation of the precision and accuracy ranking of the 192 pipelines before (blue) and after (green) the removal of pipelines that used raw reads, effective counts, estimated counts and coverage, which produced a bimodal data distribution. The red diamond represents the mean of the ranking reached by the pipelines that use the respective method or algorithm. The asterisks indicate the significance of the post-hoc Dunn’s test: *p < 0.05, **p < 0.01 and ***p < 0.001. Comparisons without asterisk are statistically insignificant (p > 0.05). Asterisks in (d) correspond to the p-values of the most significant method (TMM) against the other methods.
Figure 5
Figure 5
Differential expression detection. Number of differentially expressed genes (DEGs) detected by the 17 methods of differential expression at three FDR cut-offs: 0.05, 0.01 and 0.001. Panels represent different group comparisons in descending order based on the number of DEGs. (a) KMS12-BM (CLA) + DMSO (T0) vs. JJN-3 (CLB) + DMSO (T0) (b) KMS12-BM (CLA) + Amiloride (T1) vs. KMS12-BM (CLA) + DMSO (T0) (c) KMS12-BM (CLA) + TG003 (T2) vs. KMS12-BM (CLA) + DMSO (T0) (d) JJN-3 (CLB) + Amiloride (T1) vs. JJN-3 (CLB) + DMSO (T0) (e) JJN-3 (CLB) + TG003 (T2) vs. JJN-3 (CLB) + DMSO (T0).
Figure 6
Figure 6
Analysis of performance of the 17 differential gene expression methods through the measurement of 7 diagnostic test parameters. (a) Matthews correlation coefficient (MCC), (b) accuracy (ACC), (c) area under the ROC curve (AUC), (d) positive predictive value (PPV), (e) negative predictive value, (f) true positive rate (TPR), and (g) true negative rate (TNR). Performance was measured at three FDR cut-off levels: FDR < 0.05, FDR < 0.01 and FDR < 0.001 for the 17 methods.
Figure 7
Figure 7
Summary of the performance of the RNA-seq gene differential expression analysis methods. This graph includes three experimental approaches for the 17 methods: performance by number of DEG scenario, performance by statistical significance cut-off and overall performance.

References

    1. Garber M, Grabherr MG, Guttman M, Trapnell C. Computational methods for transcriptome annotation and quantification using RNA-seq. Nat. Methods. 2011;8:469–477. doi: 10.1038/nmeth.1613. - DOI - PubMed
    1. Xuan J, Yu Y, Qing T, Guo L, Shi L. Next-generation sequencing in the clinic: promises and challenges. Cancer Lett. 2013;340:284–295. doi: 10.1016/j.canlet.2012.11.025. - DOI - PMC - PubMed
    1. Finotello F, Di Camillo B. Measuring differential gene expression with RNA-seq: challenges and strategies for data analysis. Brief Funct. Genomics. 2015;14:130–142. doi: 10.1093/bfgp/elu035. - DOI - PubMed
    1. Han Y, Gao S, Muegge K, Zhang W, Zhou B. Advanced applications of RNA sequencing and challenges. Bioinform Biol. Insights. 2015;9:29–46. - PMC - PubMed
    1. Perkins JR, et al. A comparison of RNA-seq and exon arrays for whole genome transcription profiling of the L5 spinal nerve transection model of neuropathic pain in the rat. Mol. Pain. 2014;10:7. doi: 10.1186/1744-8069-10-7. - DOI - PMC - PubMed

Publication types

Substances