

doi: 10.1038/s41375-020-01086-0.
Epub 2020 Nov 12.
Dynamic clonal hematopoiesis and functional T-cell immunity in a supercentenarian
Affiliations
- PMID: 33184493
- PMCID: PMC8257492
- DOI: 10.1038/s41375-020-01086-0
Item in Clipboard
Dynamic clonal hematopoiesis and functional T-cell immunity in a supercentenarian
Leukemia.
2021 Jul.
No abstract available
Conflict of interest statement
The authors declare that they have no conflict of interest.
Figures
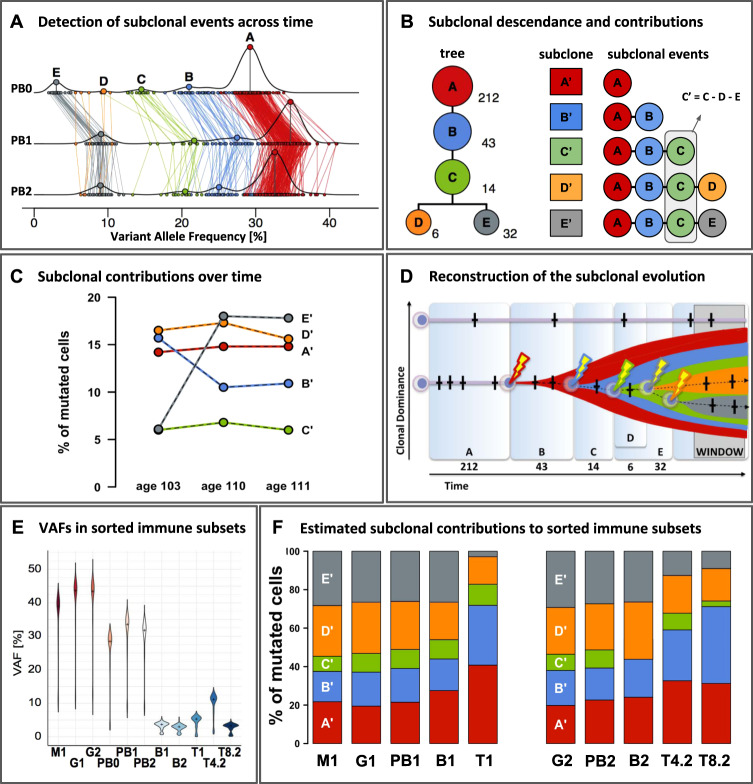
Blood samples from W111 were collected at three time points, age 103 (timepoint 0), 110 (timepoint 1), and 111 (timepoint 2) respectively, and included peripheral blood (PB0, PB1, PB2), as well as its flow sorted subsets: granulocytes (G), monocytes (M), T-cells (T), CD4+ T-cells (T4), CD8+ T-cells (T8) and B-cells (B). Numbers signify time points 0, 1 and 2. A Horizontal lines PB0, PB1, PB2: the density distribution of the variant allele frequency (VAF) of the 307 confirmed somatic mutations at ages 103, 110 and 111. With clone A as the founding clone, the median VAF of variants in clone A represents 0.5x the median contribution of the clone and its subclones to the peripheral blood. Colored lines connect the same mutations measured at the different timepoints. Using SciClone, mutations were assigned to five independent clonal events (A-E) and colored accordingly. See supplement for in-depth methods and results. B Left: Modeling with SCHISM indicated that these five clonal events most likely occurred consecutively within a single clonal lineage that terminates into two independent sister-clones D and E. These were derived from a shared ancestral subclone carrying mutations associated with clonal events (A–C). The number of somatic mutations supporting each subclonal event are listed next to the clones. Right: to estimate the contributions of each subclone to peripheral blood, we corrected for the interdependencies introduced by the shared clonal descendance: all somatic mutations in clone A are present in its clonal descendants (B–E), and all somatic mutations in (B) are present in (C–E), but not (A). C Median VAFs after subtractions of the median VAF of the descendant clonal event indicates that changes in dominance of subclones A-C are largely explained by changes in dominance of subclone E and notably not by subclone D. D Reconstruction of subclonal evolution. Time frames A–E correspond to the periods in which passenger mutations (crosses) were accumulated until a clonal event driving expansion (bolt) was encountered. Widths of the time frames are roughly proportional to the number of mutations detected for each event. The y-axis reflects the relative contribution of an HSC to overall peripheral blood production. ‘WINDOW’ refers to our window of observation ranging from age 103 to 111, a 9-year period characterized by the expansion of clonal event E. E Violin plots of VAFs [%] in peripheral blood and its sorted subsets. The amplicon panel of 307 somatic mutations were used to re-sequence DNA derived from FACS-sorted immune subsets. The median VAFs between different cell subsets collected at age 110 indicated a significant higher clonal contribution to the myeloid branch (87.4% of the granulocytes (G1VAF = 0.437) and 77.8% of the monocytes (M1VAF = 0.389)) compared to the lymphoid lineage (~10.6% of the T-cells (T1VAF = 0.053), and ~7.4% of the B-cells (B1VAF = 0.037)). Re-sequencing within the blood sample collected at age 111 indicated that VAFs were significantly higher in CD4+ T-cells (22.2% of the cells, T4.2VAF = 0.111) compared to CD8+ T-cells (6.4% of the cells, T8.2VAF = 0.032, p < 0.001, Wilcoxon) and B-cells (6.0% of the cells, B2VAF = 0.030, p < 0.001, Wilcoxon). F Fraction of mutated cells per sorted cell subset derived from each subclone. Stacked bar plots per subset add up to 100%.
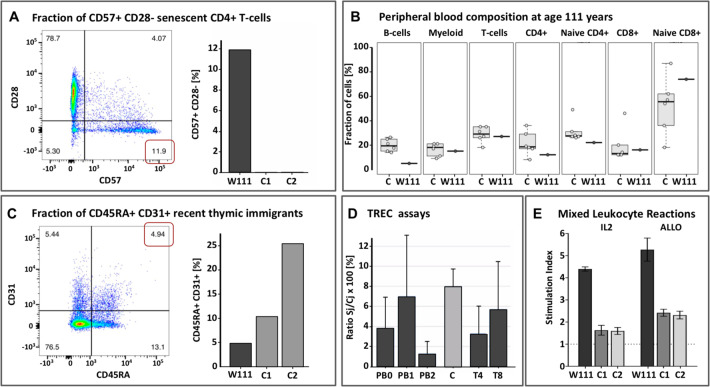
A Left: Flow cytometry Sorting of peripheral blood taken at age 110 showed increased fractions of CD57+ CD28- senescent CD4+ and CD8+ T-cells relative to middle aged controls, as apparent by the expression of CD57; Right: Proportion of senescent cells in W111 compared to middle-aged controls C1 and C2. B Proportions of sorted immune subsets (B-cells, Myeloid, T-cells, CD4+ T-cells, naive CD4+ T-cells, CD8+ T-cells, naive CD8+ T-cells) in peripheral blood of six middle-aged female controls (left) in W111 at age 111 years (right). C. Left: At age 110 years, nearly 5% of the CD4+ T-cells expressed both CD45RA and CD31, indicative of recent thymic emigrants; Right: The level of recent thymic emigrants in W111 was compared to middle-aged controls C1 and C2 [D] The percentage of T-cell receptor excision circles (TRECs) in in W111’s peripheral blood and sorted CD4+ and CD8+ T-cells at age 110 and 111 years was comparable to that of middle-aged healthy female controls C (3–6%). PB: Peripheral Blood cells; T4: CD4+ T-cells; T8: CD8+ T-cells. Numbers signify time points: 0: age 103; 1: age 110; 2: age 111. E In vitro proliferation assays: we computed Stimulation Indices for an IL2/TCR-dependent (IL2) and an allogeneic mixed-lymphocyte assay (ALLO) assay of cultured T-cells of W111 and two middle-aged female controls C1 and C2. In both assays, T-cells collected from W111 outperformed those taken from middle-aged controls on a per cell basis. Furthermore, see Supplement for flow cytometry analyses of cells collected at age 110 and 111, which indicated that both the CD4+ and CD8+ T-cell subsets contained considerable fractions of in vivo activated cells, evidenced by their high CD25 expression and CD69 expression.
References
Publication types
MeSH terms
LinkOut - more resources
Full Text Sources
Other Literature Sources
Medical
