. 2021 Jul;35(7):1976-1989.
doi: 10.1038/s41375-020-01088-y. Epub 2020 Nov 12.

A novel model of alternative NF-κB pathway activation in anaplastic large cell lymphoma

Affiliations

A novel model of alternative NF-κB pathway activation in anaplastic large cell lymphoma

Hongbo Wang et al. Leukemia. 2021 Jul.

Abstract

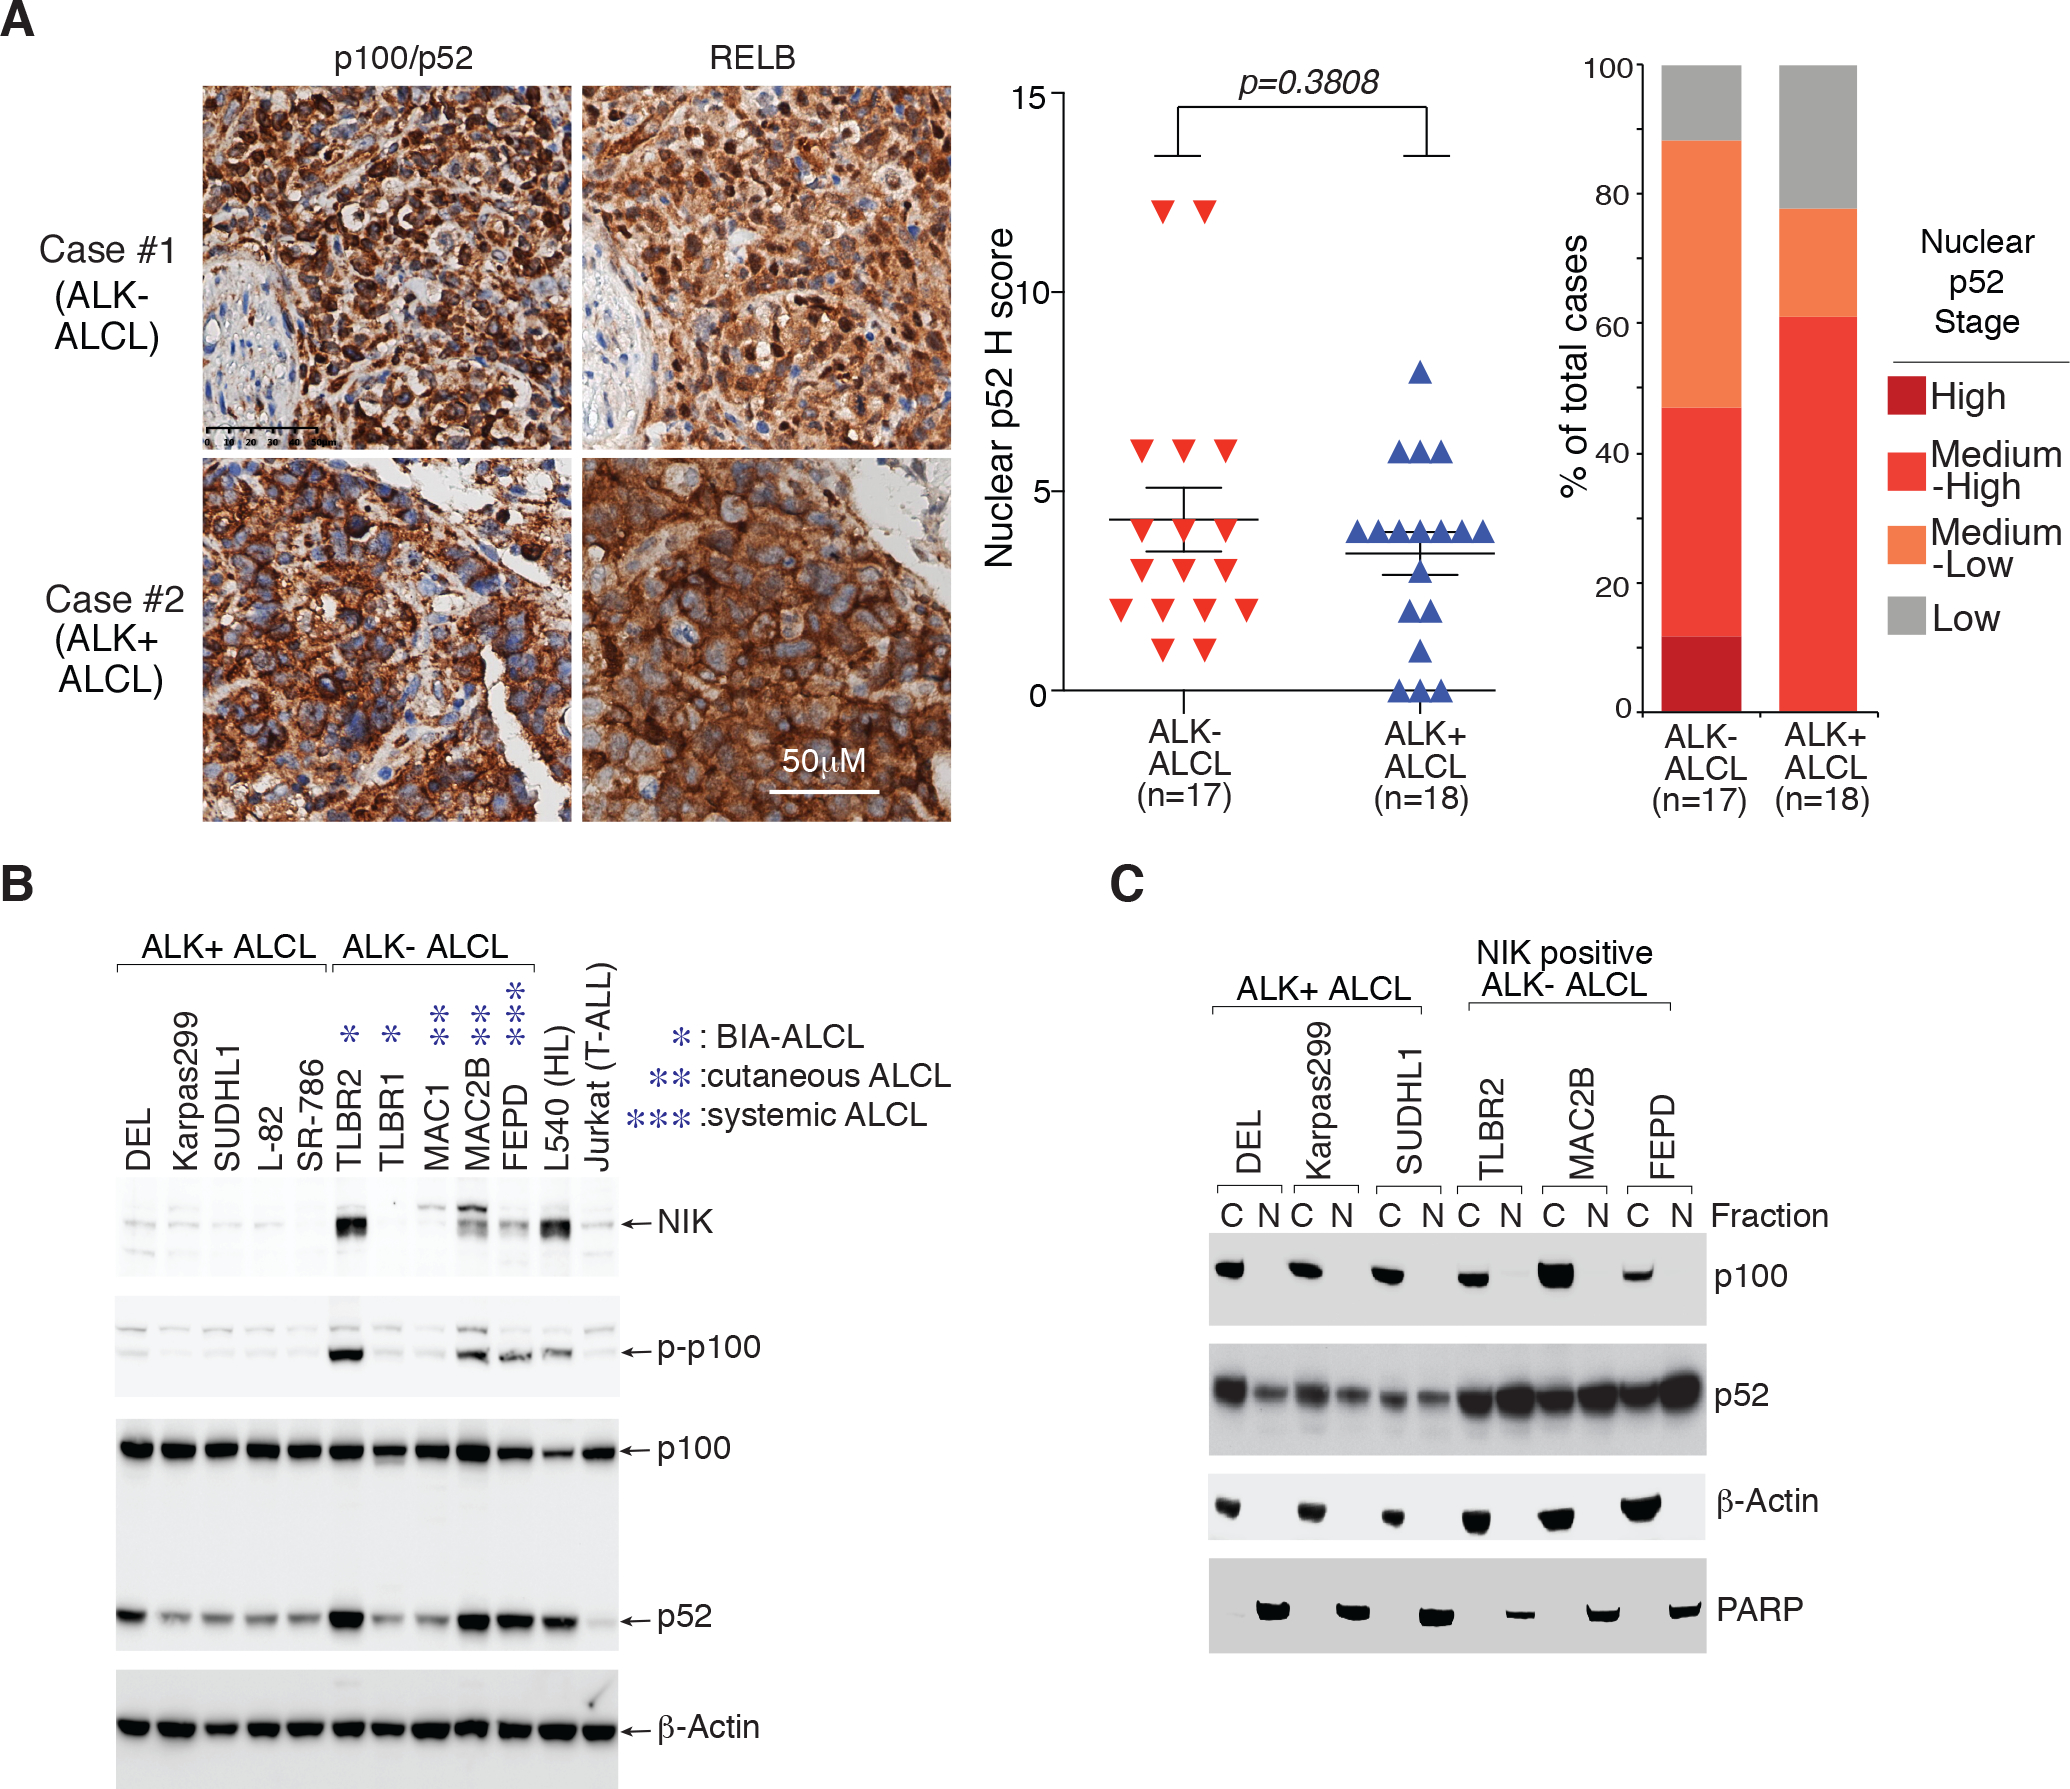
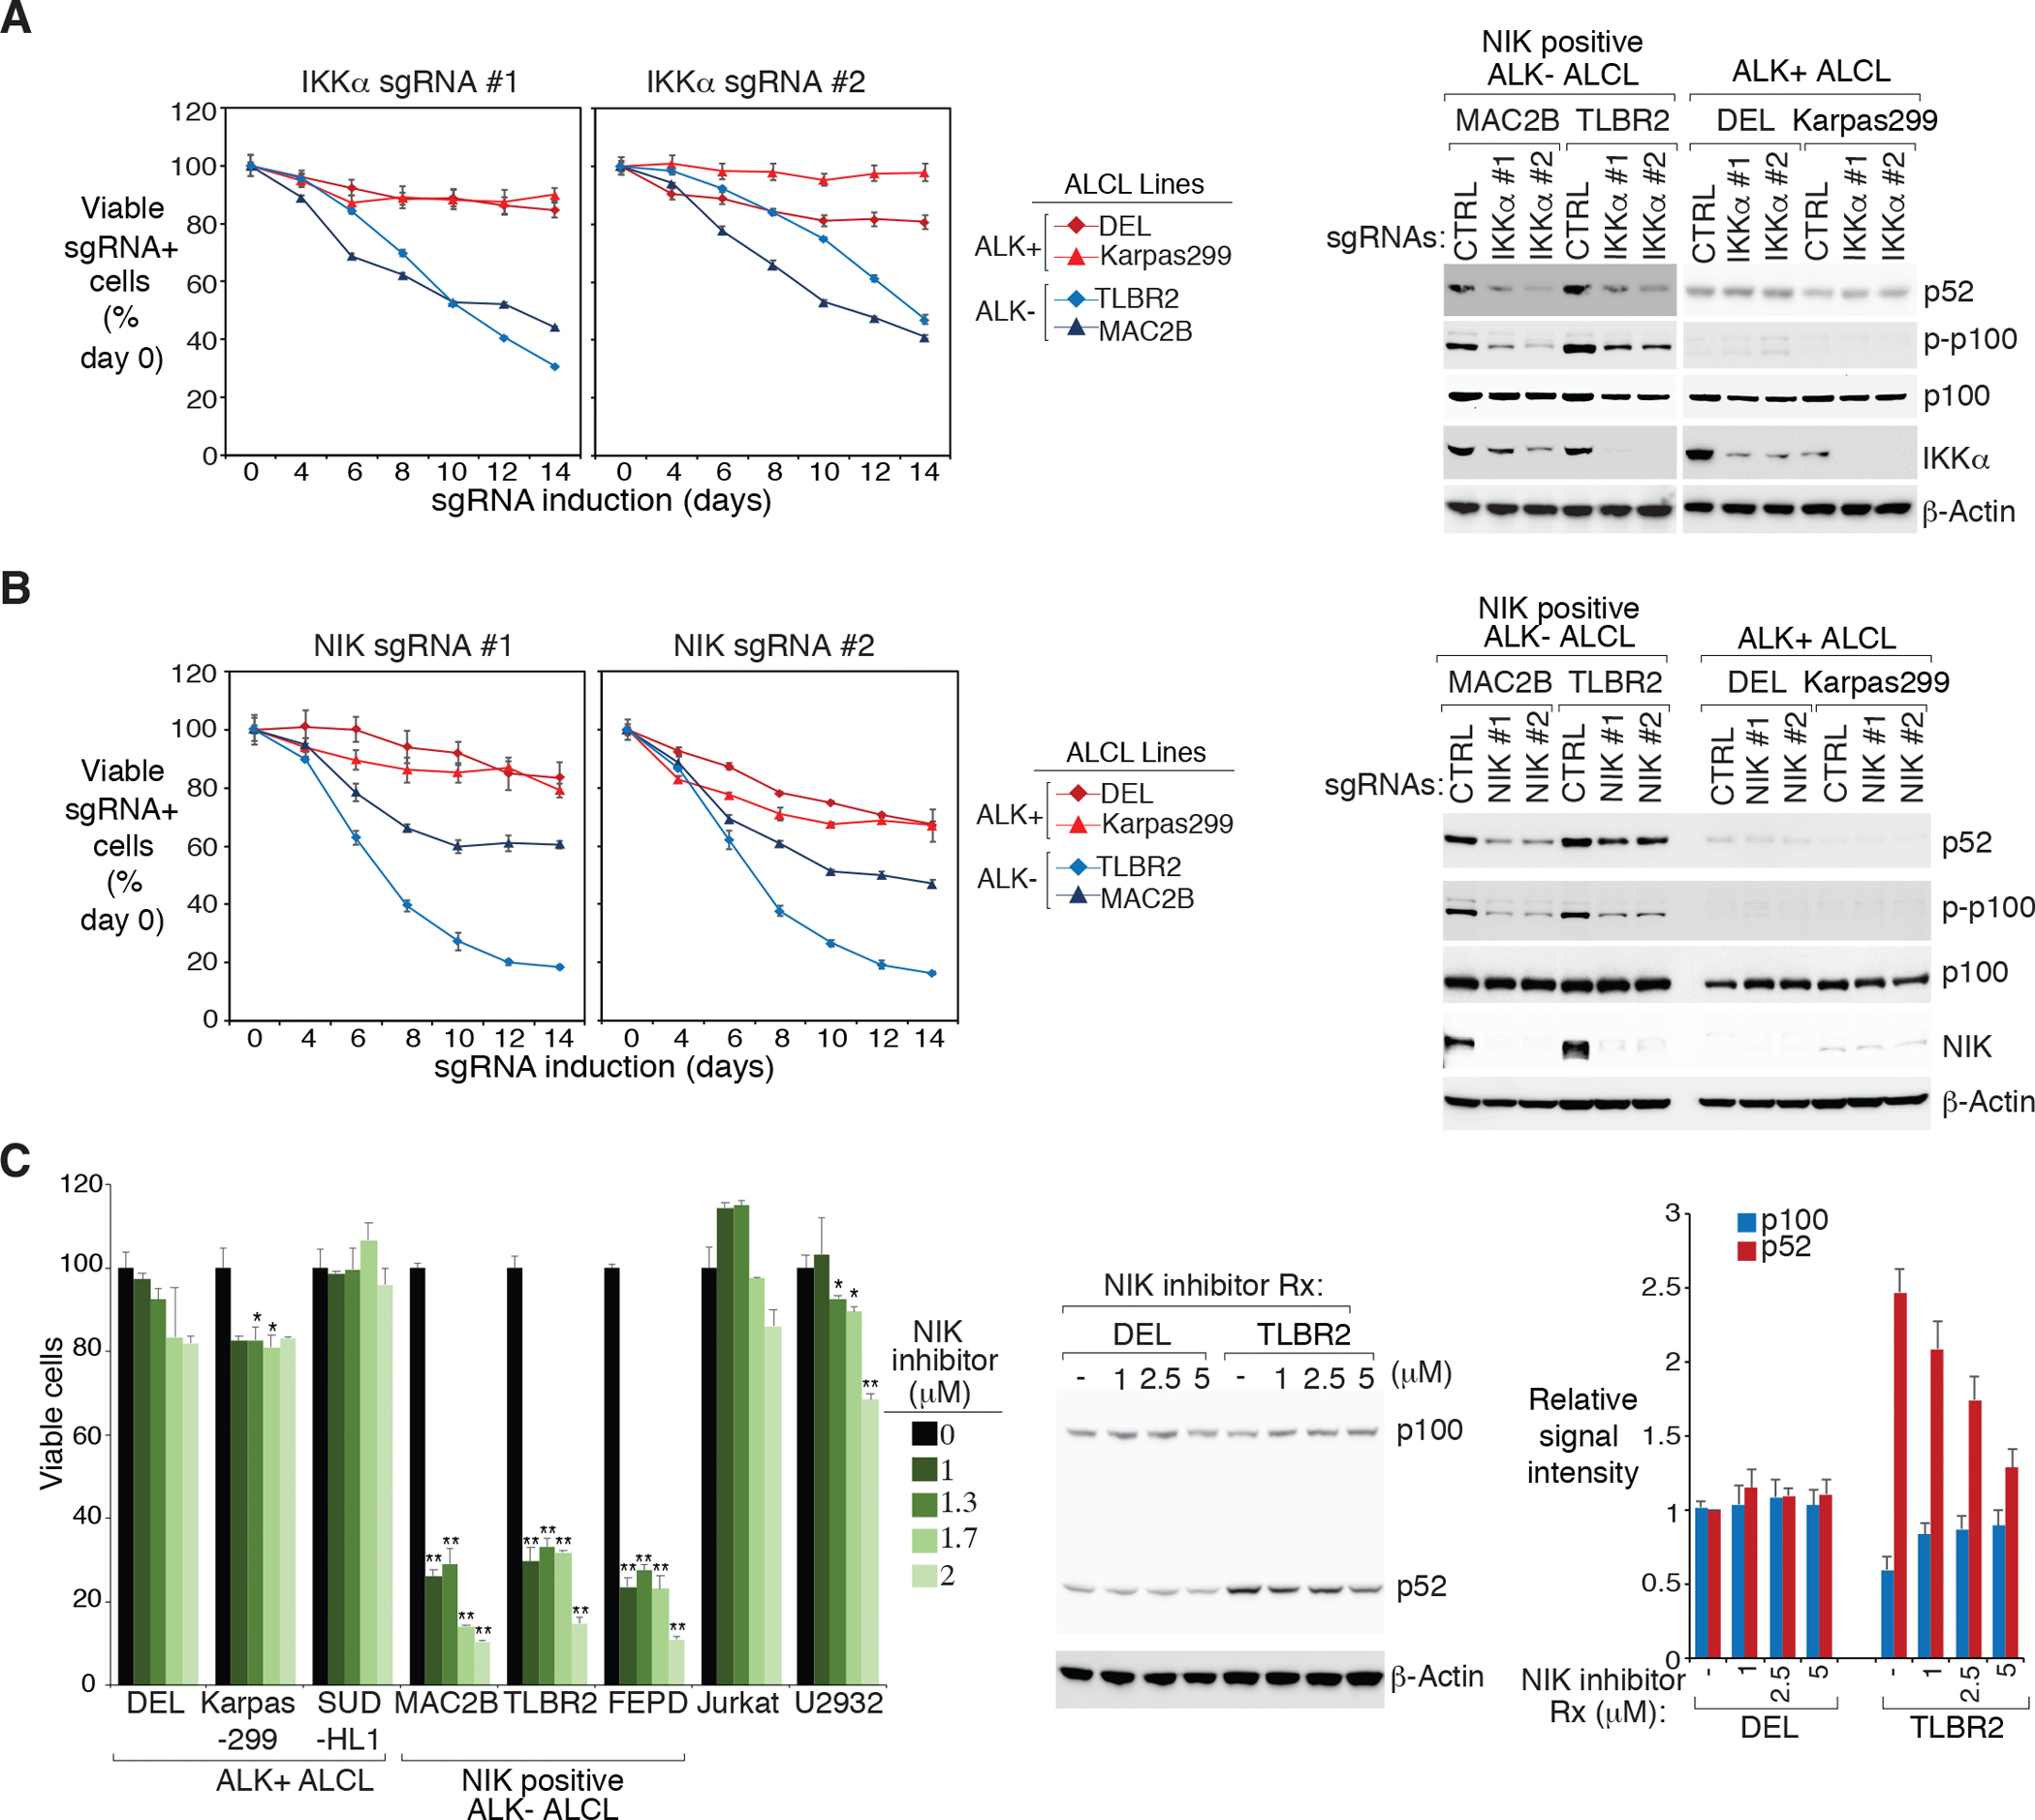
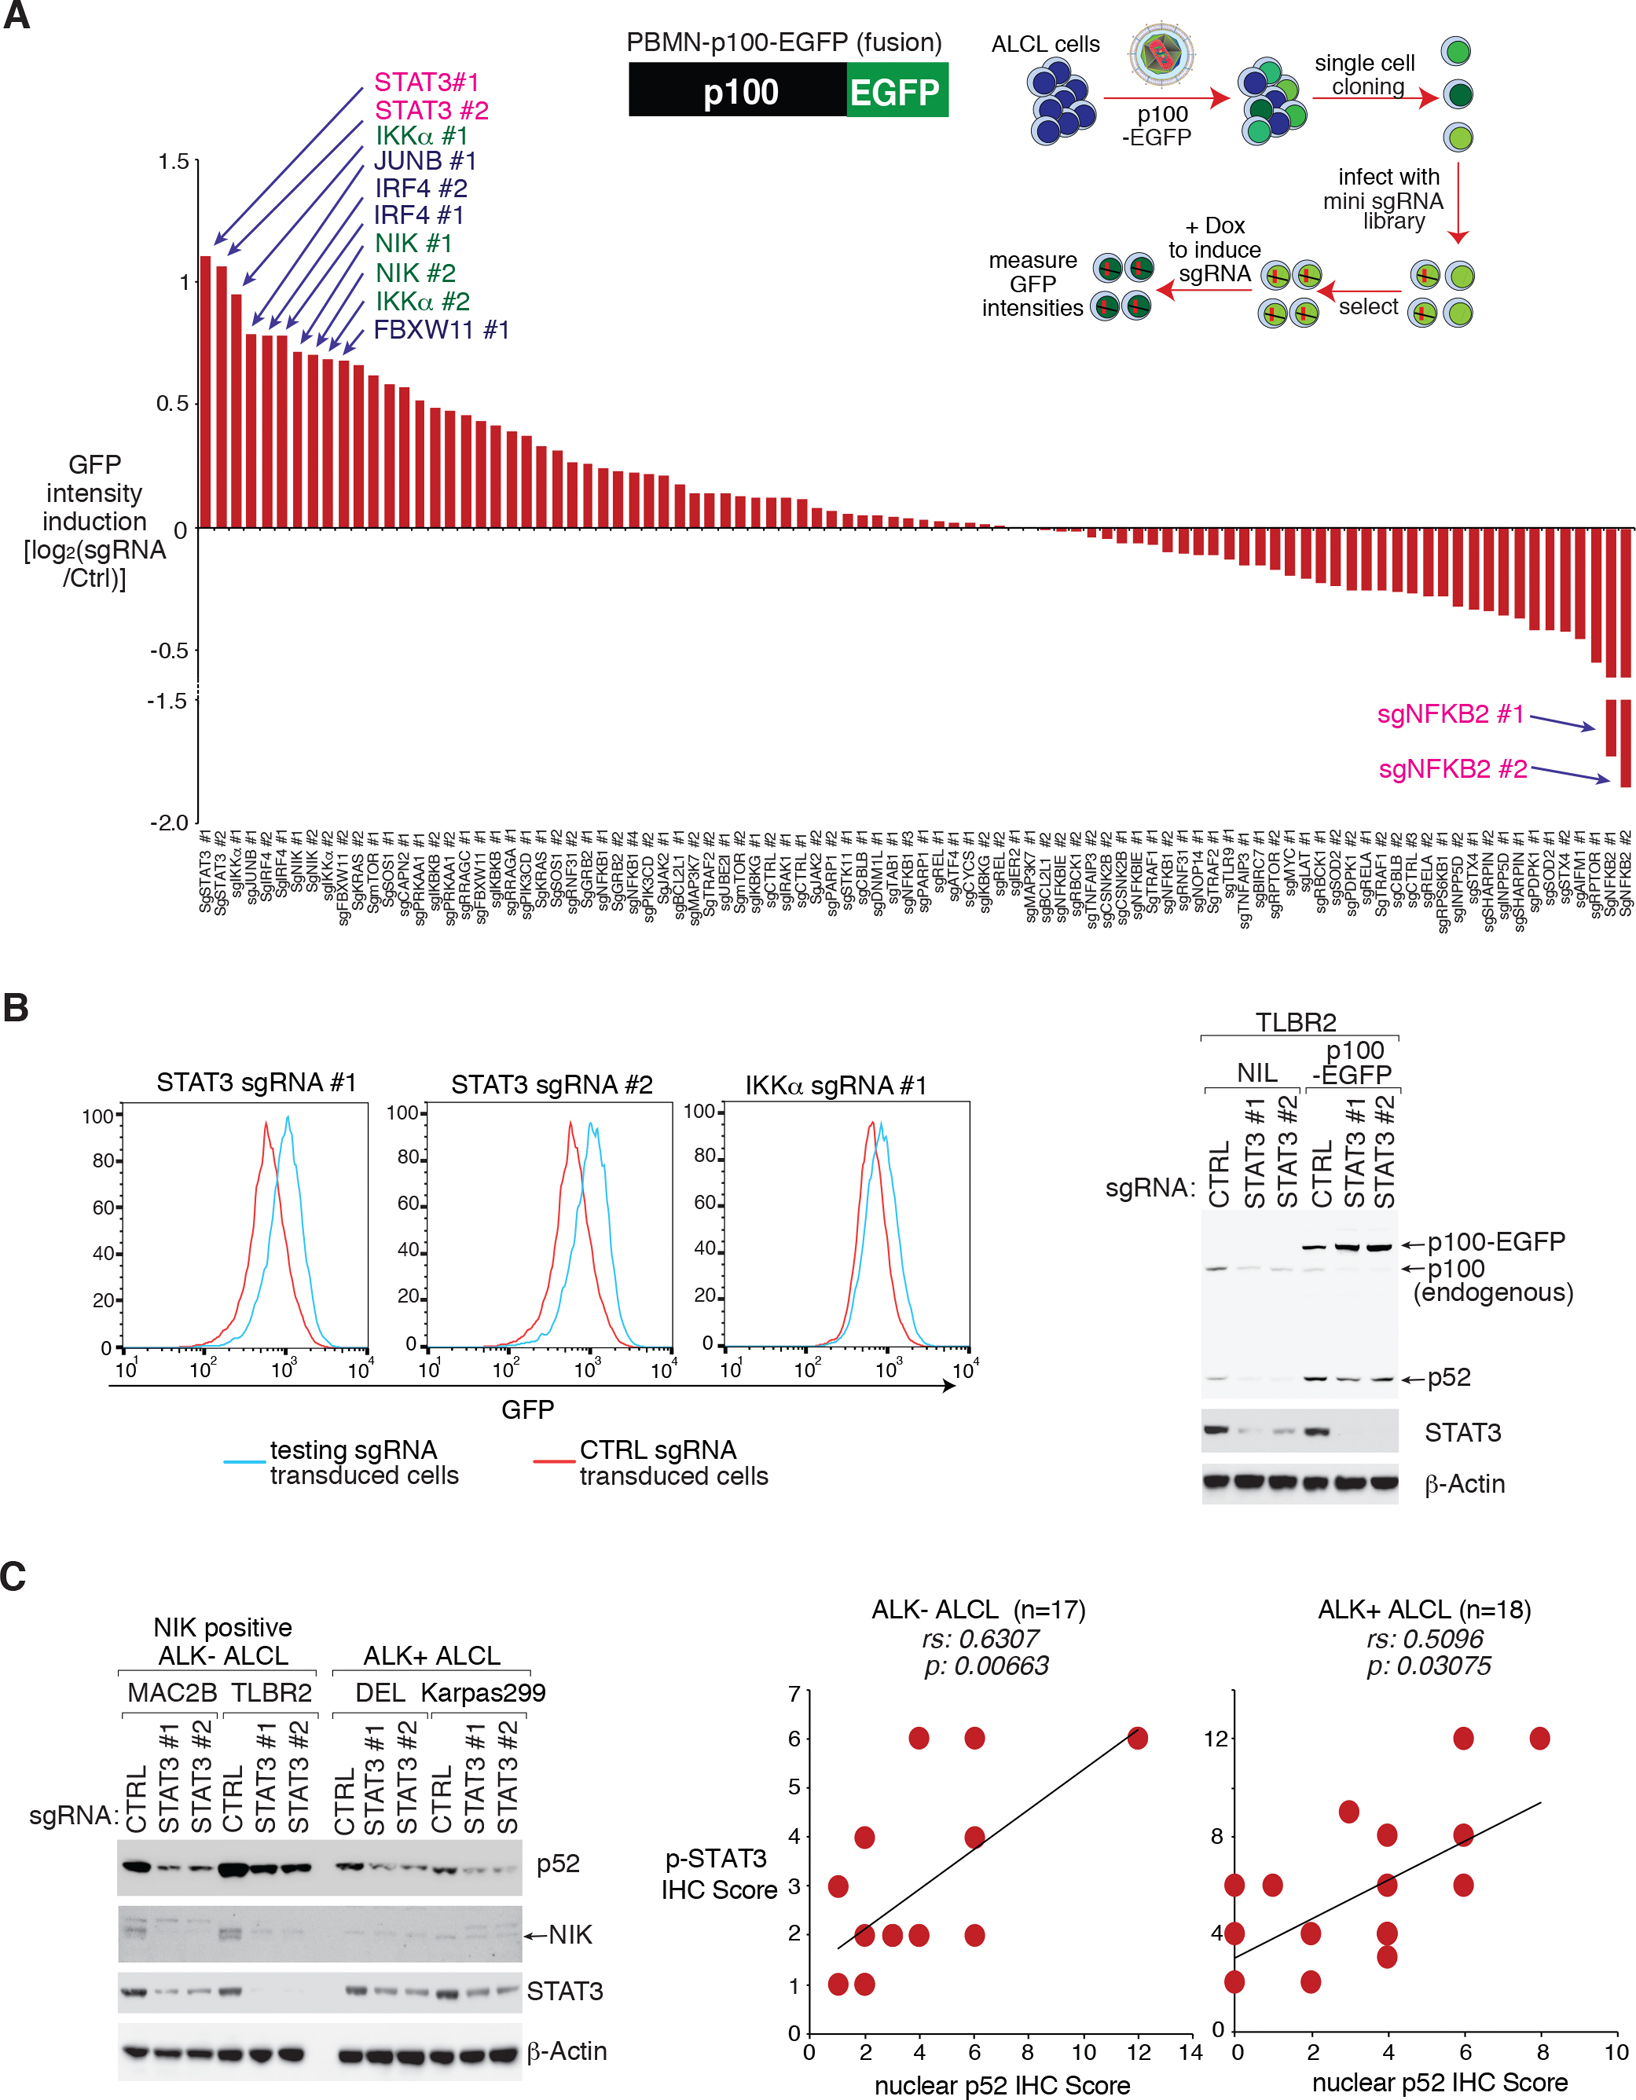
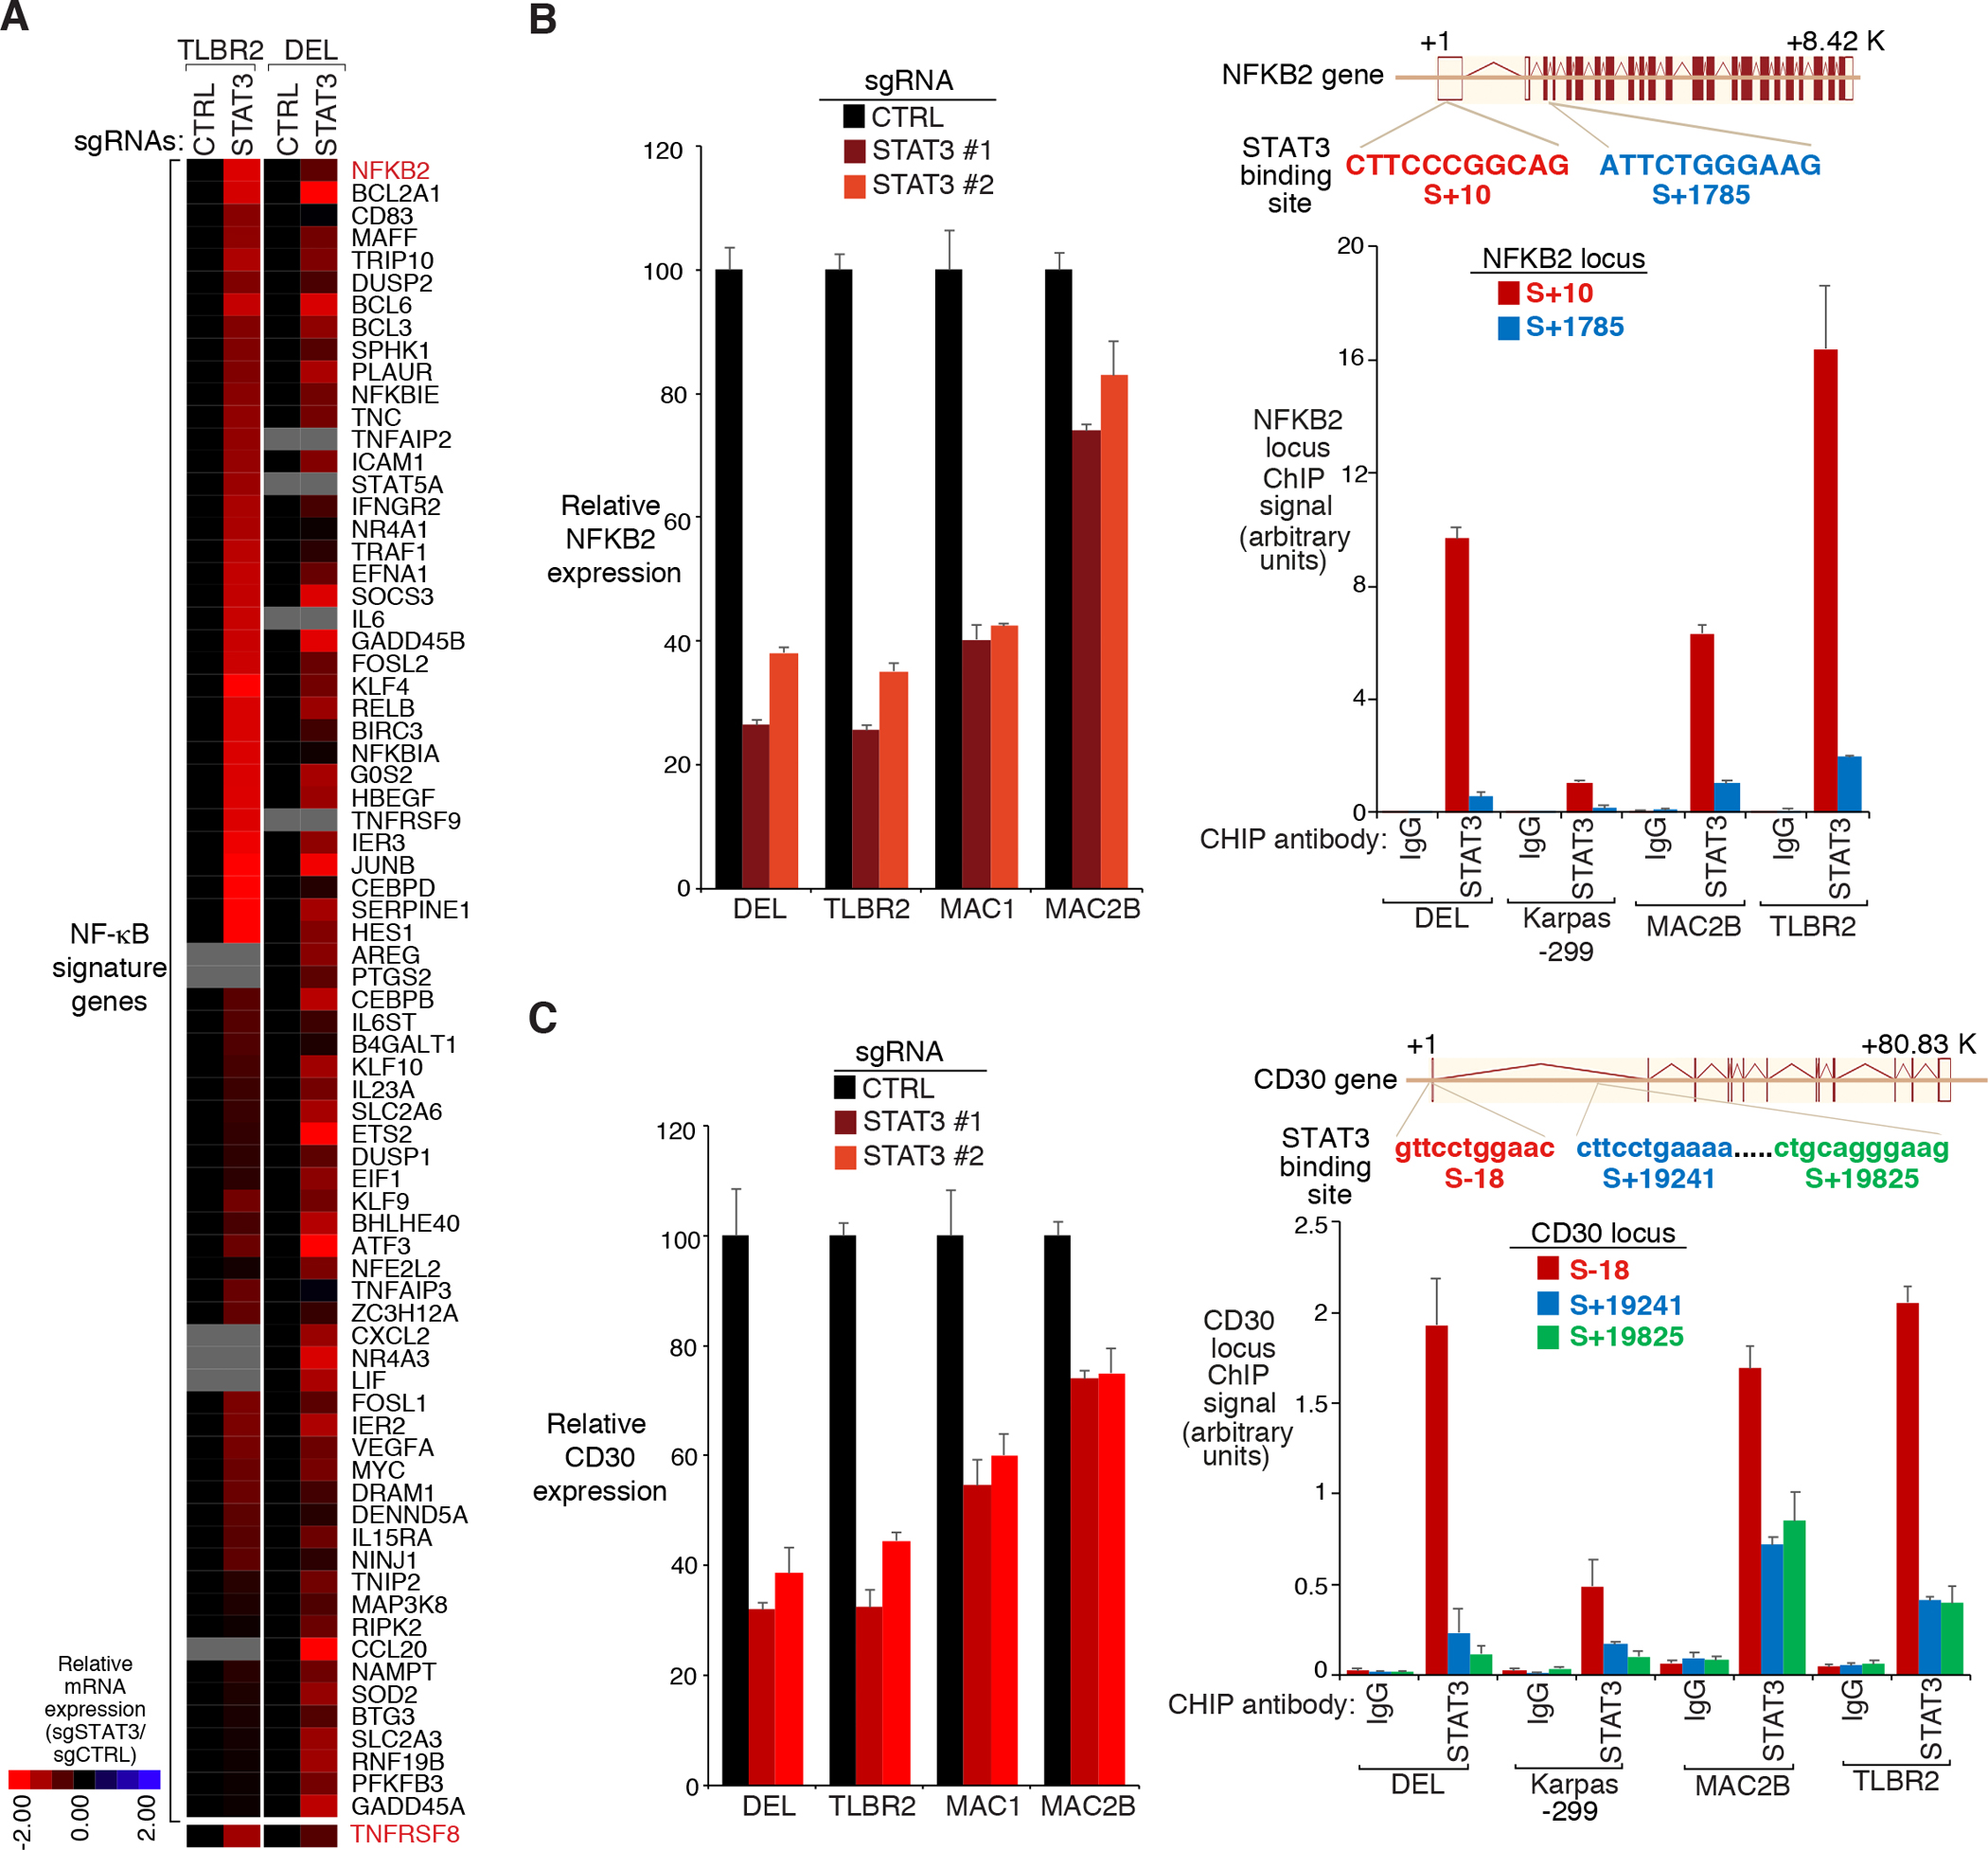
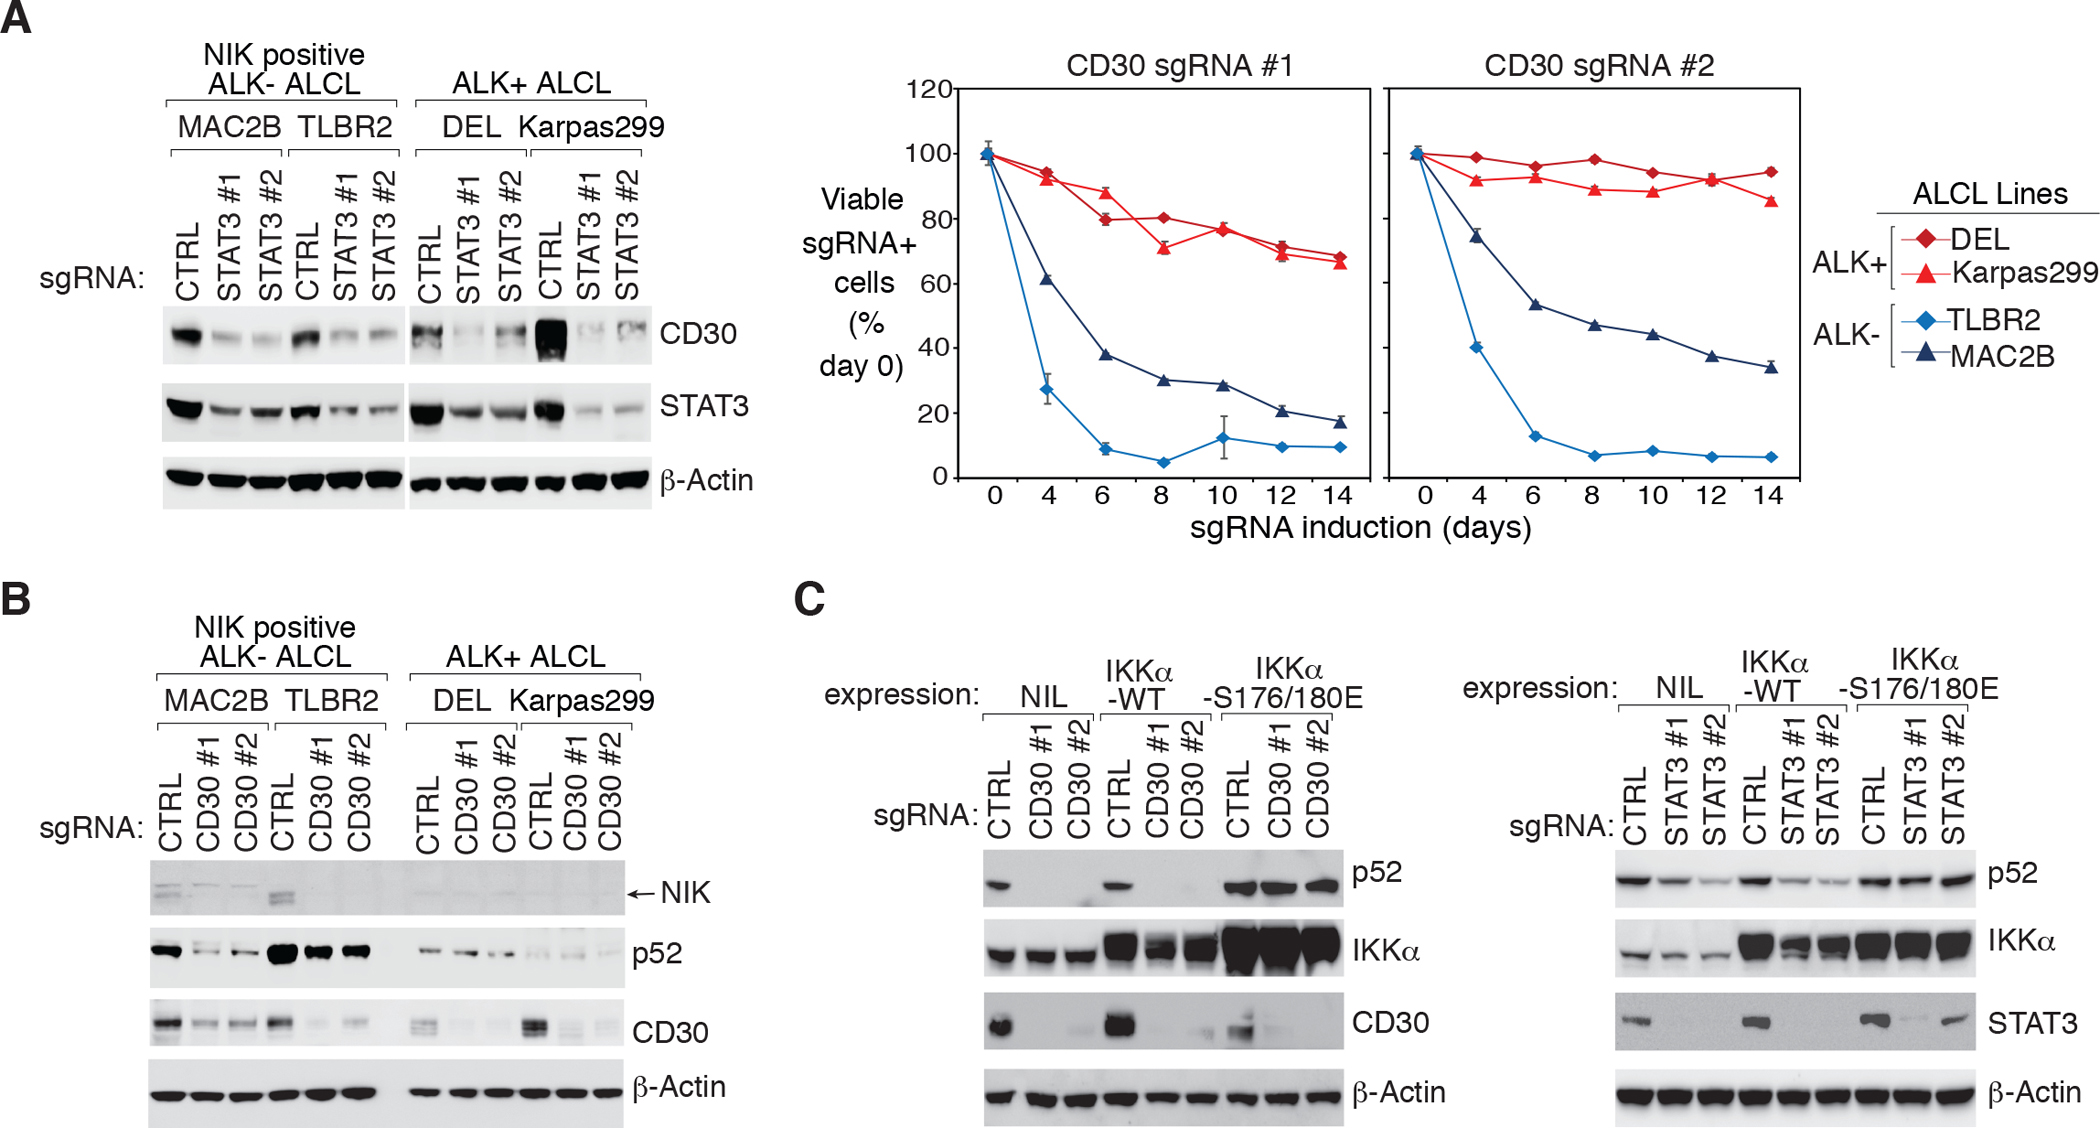
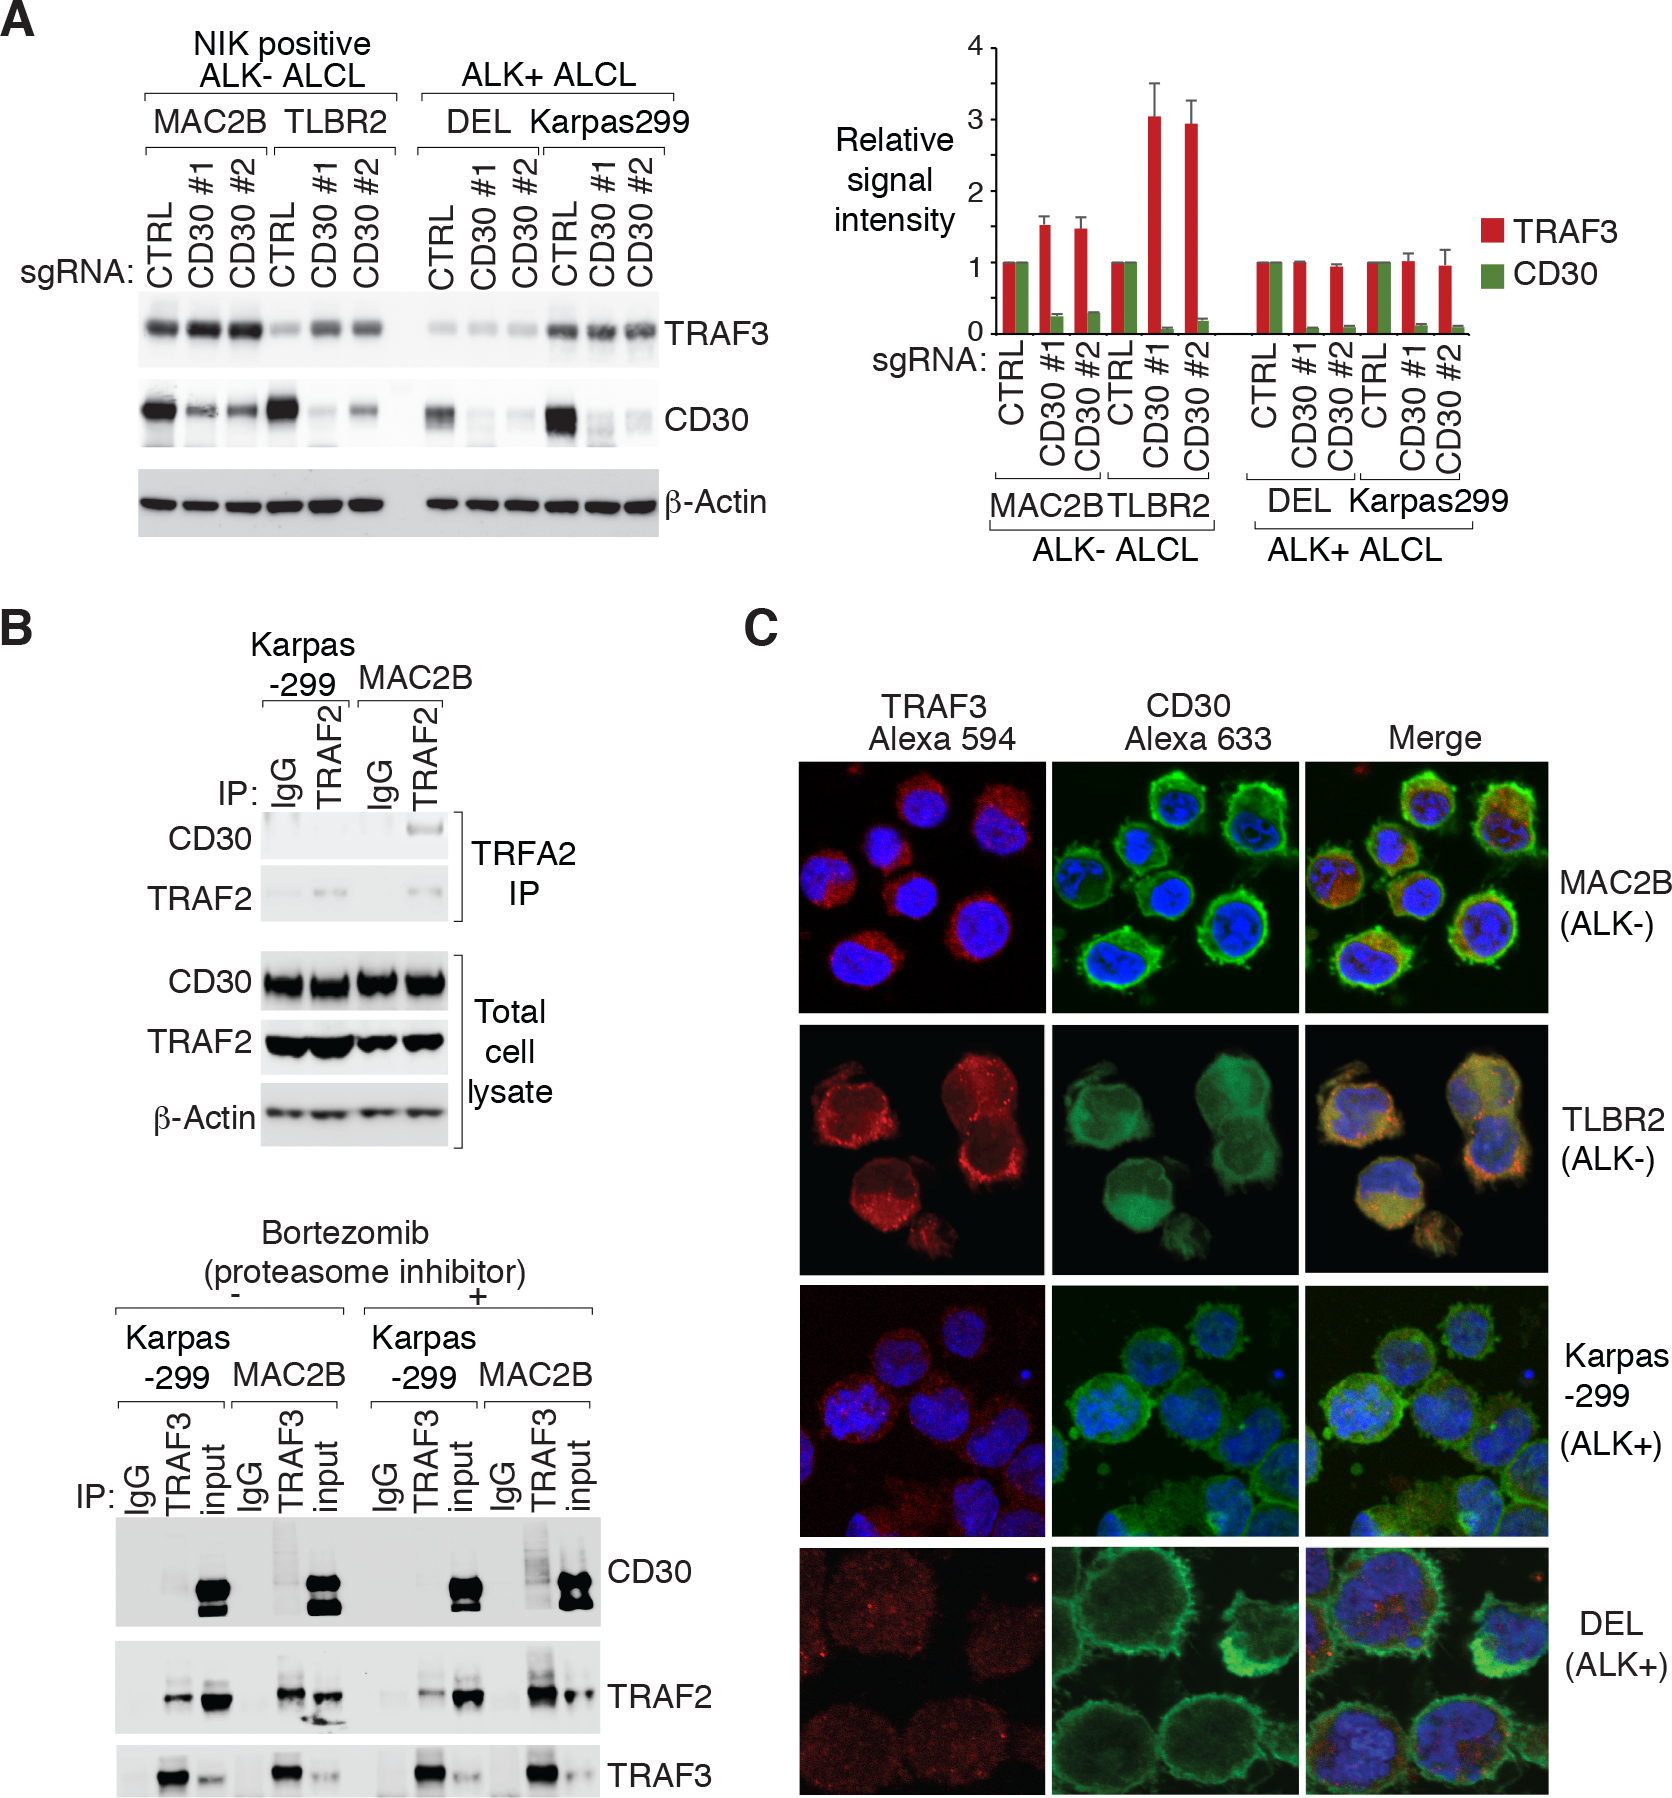
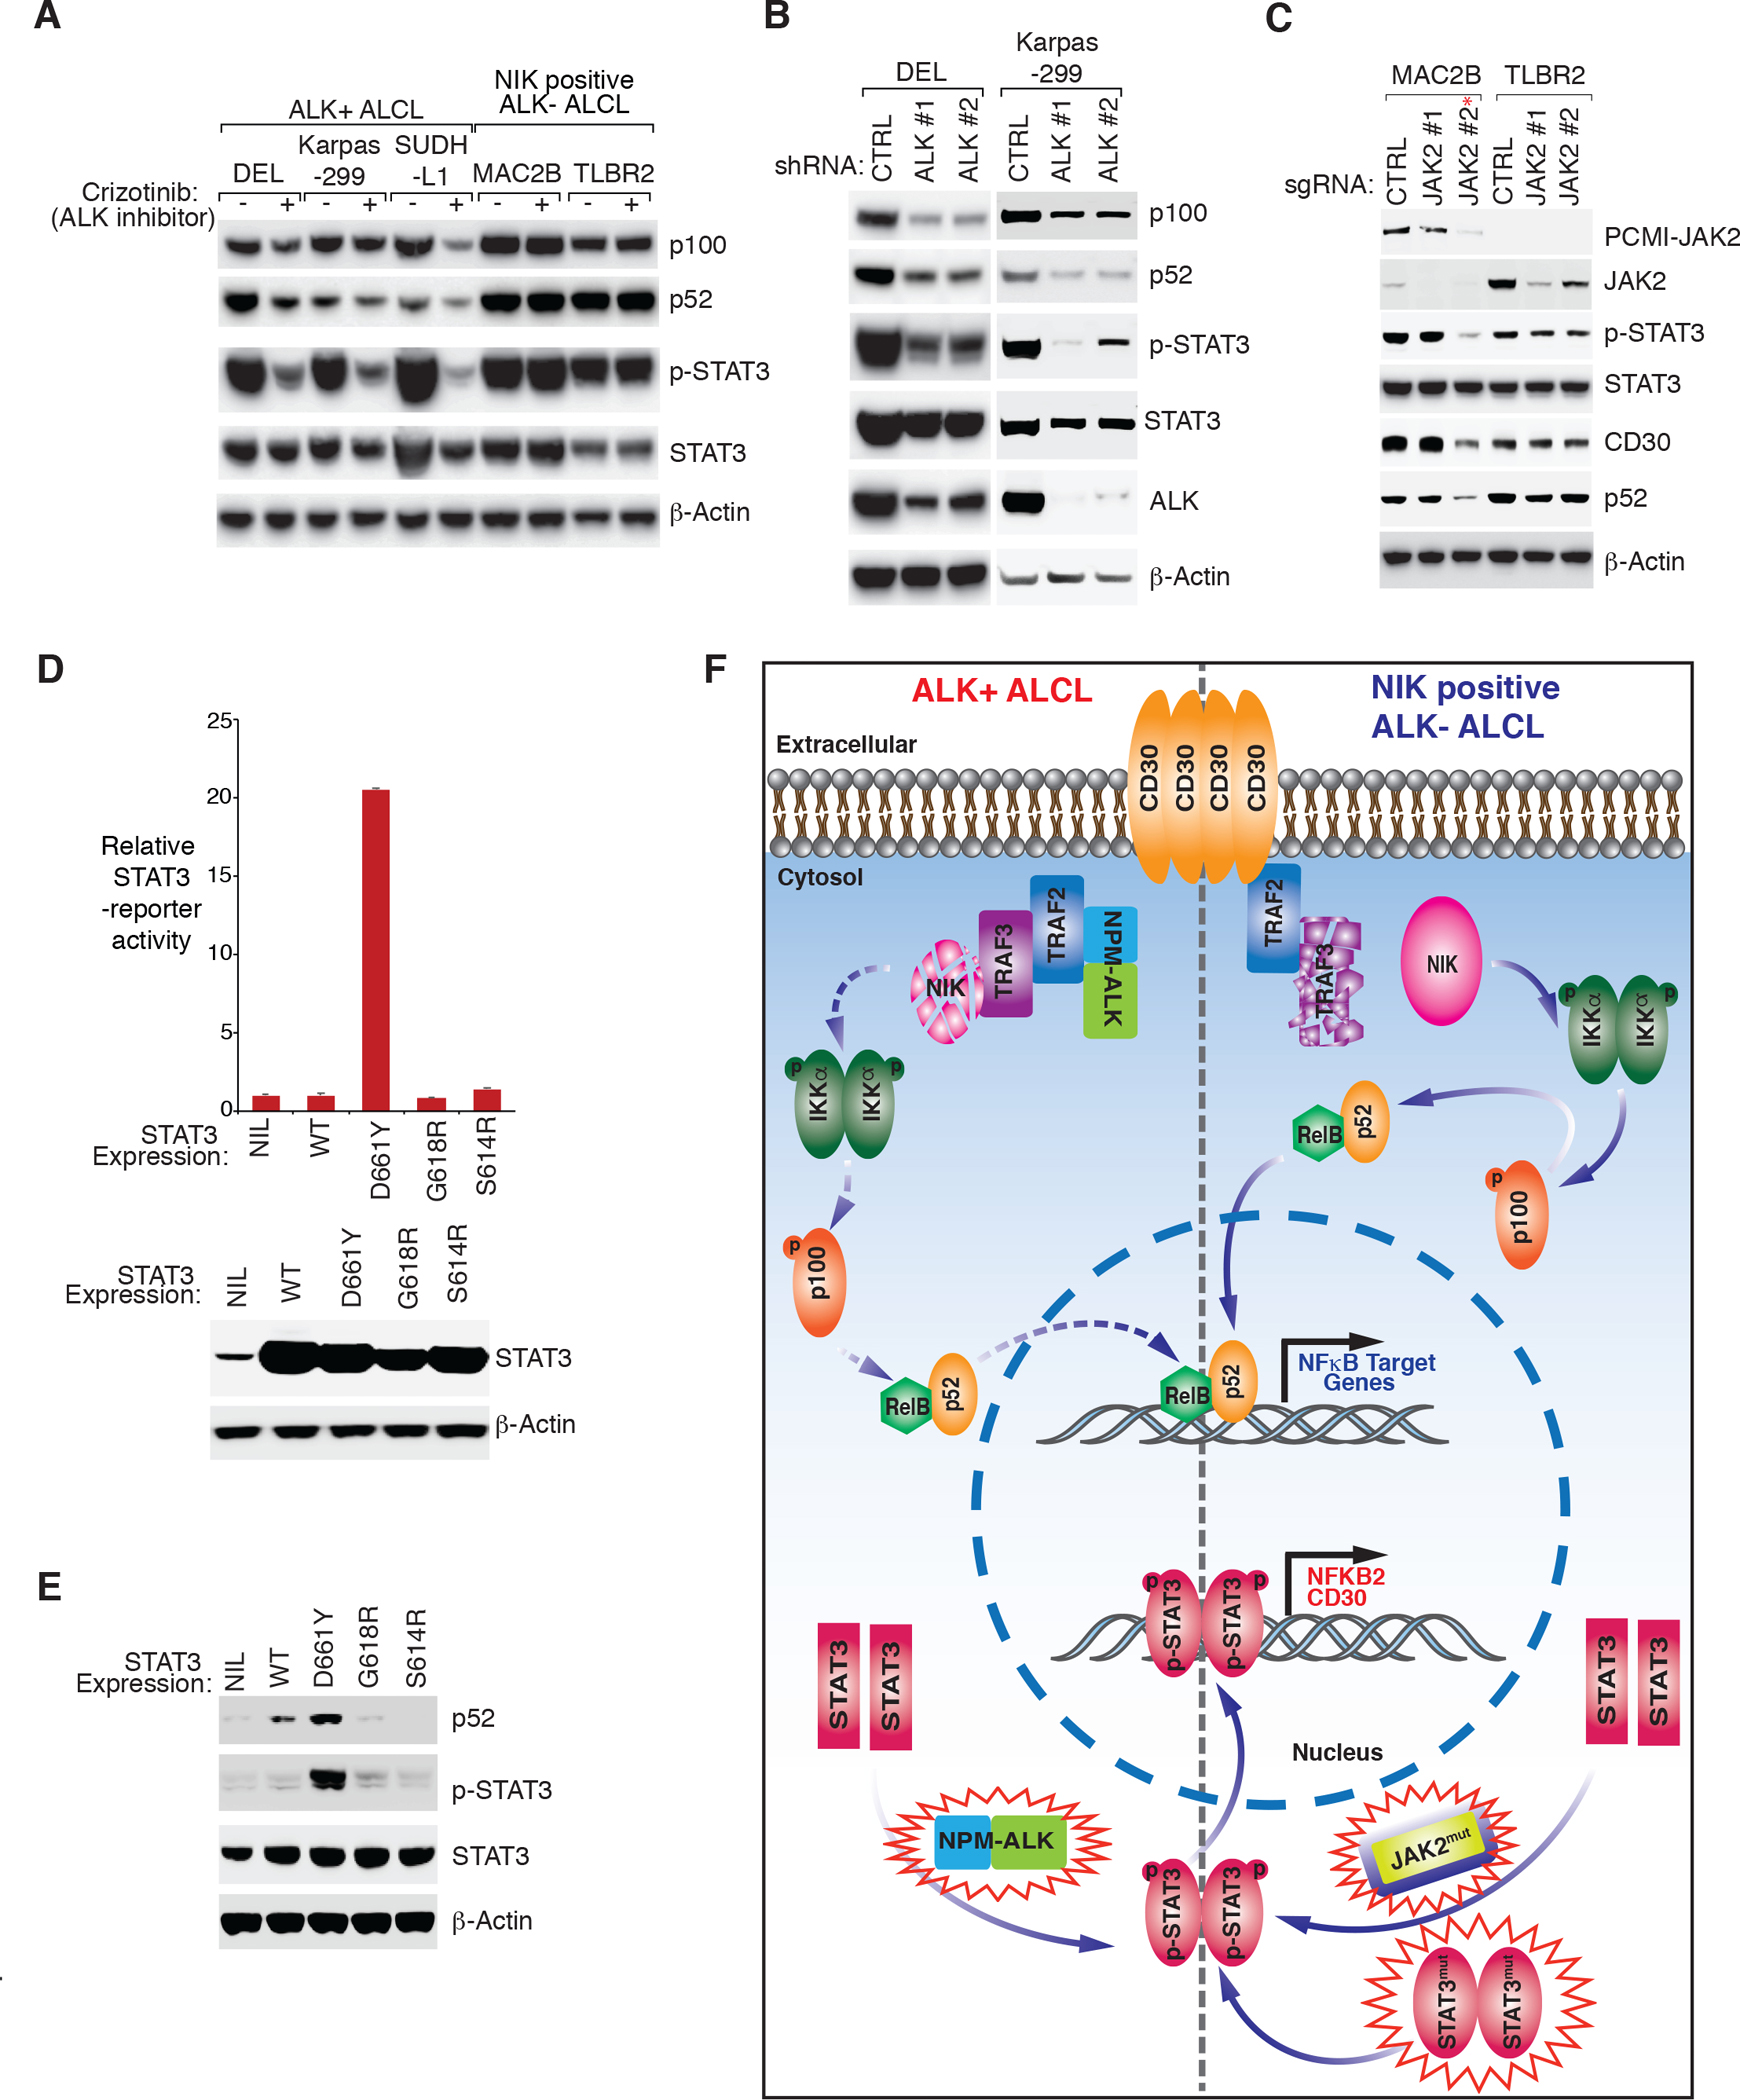
Aberrant activation of NF-κB is the most striking oncogenic mechanism in B-cell lymphoma; however, its role in anaplastic large cell lymphomas (ALCL) has not been fully established and its activation mechanism(s) remain unclear. Using ALCL cell line models, we revealed the supporting roles for NFKB2 and the NIK pathway in some ALCL lines. To investigate the detailed activation mechanisms for this oncogenic pathway, we performed specifically designed alternative NF-κB reporter CRISPR screens followed by the RNA-seq analysis, which led us to identify STAT3 as the major mediator for NIK-dependent NF-κB activation in ALCL. Consistently, p-STAT3 level was correlated with NFKB2 nuclear accumulation in primary clinical samples. Mechanistically, we found that in NIK-positive ALK- ALCL cells, common JAK/STAT3 mutations promote transcriptional activity of STAT3 which directly regulates NFKB2 and CD30 expression. Endogenous expression of CD30 induces constitutive NF-κB activation through binding and degrading of TRAF3. In ALK+ ALCL, the CD30 pathway is blocked by the NPM-ALK oncoprotein, but STAT3 activity and resultant NFKB2 expression can still be induced by NPM-ALK, leading to minimal alternative NF-κB activation. Our data suggest combined NIK and JAK inhibitor therapy could benefit patients with NIK-positive ALK- ALCL carrying JAK/STAT3 somatic mutations.


Conflict of interest statement

Conflicts of Interest.

The authors declare no competing financial interests.

Figures

Figure 1:
Figure 1:. Expression of p100/p52 in ALCL primary samples and cell lines.
A. Expression of p100/p52 and RELB in ALCL primary cases by immunohistochemistry (IHC). left: Immunohistochemical p100/p52 and RELB staining are shown in two cases. Section of lymph nodes were examined microscopically using a 400X magnification. middle: Nuclear p52 IHC score (detailed at Supplementary Table 1) of the 17 ALK− ALCL and 18 ALK+ ALCL cases examined. p value between ALK− and ALK+ groups is indicated. right: Nuclear p52 stages in primary ALCL cases. IHC score (H Score): <2 (low); >=2, <4 (medium-low); >=4, <9 (medium-low); >=9(high). B. Lysates of indicated cell lines were analyzed by immunoblotting for the indicated proteins. C. Nuclear and cytosol fractions of indicated cell lines were analyzed by immunoblotting for the indicated proteins.
Figure 2:
Figure 2:. NIK-positive ALK− ALCL lines are more dependent on activated NIK-IKKα signaling.
A. left: Indicated ALCL lines were transduced with IKKα or Ctrl sgRNAs along with GFP. The fraction of viable sgRNA-expressing cells relative to the total viable cell fraction at indicated times following induction of the indicated sgRNAs, normalized to day 0 values. Error bars denote SD of triplicates. right: Indicated ALCL lines were transduced with IKKα or Ctrl sgRNAs, selected and expression induced. Lysates were analyzed by immunoblotting for the indicated proteins. B. left: Same as (A). Error bars denote SD of triplicates. right: Same as (A). Lysates were analyzed by immunoblotting for the indicated proteins. C. left: Indicated lines were treated with NIK inhibitor at the indicated concentrations for 4 days. Viability was measured by the MTS assay and normalized to DMSO-treated cells. Error bars denote SEM of triplicates. P were calculated comparing DMSO and treated groups; * indicates P < 0.05; ** indicates P < 0.01. right: ALK+ DEL and ALK− TLBR2 lines were treated with NIK inhibitor at the indicated concentrations overnight. Lysates were analyzed by immunoblotting for the indicated proteins. The relative p100 and p52 signal intensity (compared to β-actin) were determined by densitometric analysis, and normalized to untreated conditions in DEL line (right). Error bars denote SEM of three independent experiments.
Figure 3:
Figure 3:. STAT3 supports the alternative NF-κB pathway in ALCL.
A. Mini CRISPR library screen using the p100-EGFP reporter. The TLBR2 p100-EGFP reporter line was transduced with each individual sgRNAs in the mini CRISPR library, and induced to express for 4 days. The relative GFP intensity in each sgRNA transduced sample was measured by FACS and normalized to Ctrl sgRNA transduced samples. The log2 fold changes of GFP intensity in each sgRNA transduced sample vs Ctrl sgRNA were calculated and plotted. B. Confirmational EXP for (A). left: The TLBR2 p100-EGFP reporter line was transduced with indicated sgRNAs, the relative GFP intensity in each sgRNA transduced sample was measured by FACS. right: The TLBR2 p100-EGFP reporter line or the parental controls were transduced with indicated sgRNAs, selected and expression induced. Lysates were analyzed by immunoblotting for the indicated proteins. C. left: Indicated ALCL lines were transduced with STAT3 or Ctrl sgRNAs, selected and expression induced. Lysates were analyzed by immunoblotting for the indicated proteins. right: Correlation between p-STAT3 IHC scores with nuclear p52 IHC scores, was calculated by Spearman’s rank correlation methods, in 17 ALK− ALCL cases and in 18 ALK+ ALCL cases.
Figure 4:
Figure 4:. STAT3 regulates NFKB2 and CD30 expression in ALCL.
A. Heatmap of mRNA induction of NF-κB signature genes in the STAT3 sgRNA transduced cells relative to the Ctrl sgRNA transduced cells, in TLBR2 and DEL lines. B. left: Indicated ALCL lines were transduced with STAT3 or Ctrl sgRNAs, selected and expression induced, NFKB2 gene expression was measured by real-time PCR. Error bars denote SEM of triplicates. right: Diagrammatic representation of the STAT3 binding sites in NFKB2 locus (top). Chromatin IPs from indicated antibodies were subjected to real-time PCR analysis for candidate STAT3-binding regions in the NFKB2 locus in the indicated ALCL lines (bottom). Error bars denote SEM of triplicates. C. left: Same as (C), CD30 gene expression was measured by real-time PCR. right: Diagrammatic representation of the STAT3 binding sites in CD30 locus (top). Chromatin IPs from indicated antibodies were subjected to real-time PCR analysis for candidate STAT3-binding regions in the CD30 locus in the indicated ALCL lines (bottom). Error bars denote SEM of triplicates.
Figure 5:
Figure 5:. STAT3 promotes alternative NF-κB signaling in NIK positive ALK− ALCL through CD30.
A. left: Indicated ALCL lines were transduced with STAT3 or Ctrl sgRNAs, selected and expression induced. Lysates were analyzed by immunoblotting for the indicated proteins. right: ALCL lines were transduced with CD30 or Ctrl sgRNAs along with GFP. The fraction of viable sgRNA-expressing cells relative to the total viable cell fraction at indicated times following induction of the indicated sgRNAs, normalized to day 0 values. Error bars denote SD of triplicates. B. Indicated ALCL lines were transduced with CD30 or Ctrl sgRNAs, selected and expression induced. Lysates were analyzed by immunoblotting for the indicated proteins. C. ALL- ALCL line TLBR2 was stable engineered with IKKα WT, IKKα S176/180E or empty control, then transduced with CD30 (left), STAT3 (right), or Ctrl sgRNAs, selected and expression induced. Lysates were analyzed by immunoblotting for the indicated proteins.
Figure 6:
Figure 6:. CD30 signalosome complex formation in ALK− ALCL.
A. Indicated ALCL lines were transduced with CD30 or Ctrl sgRNAs, selected and expression induced. Lysates were analyzed by immunoblotting for the indicated proteins. The relative TRAF3 and CD30 signal intensity (compared to β-actin) were determined by densitometric analysis, and normalized to the Ctrl sgRNA conditions in each cell lines (right). Error bars denote SEM of three independent experiments. D. top: TRAF2 IPs or total lysates from Karpas299 and MAC2B cells were immunoblotted for the indicated proteins. bottom: TRAF3 IPs or total lysates from Karpas299 and MAC2B cells treated with proteasome inhibitor bortezomib (5 nM) or DMSO for overnight were immunoblotted for the indicated proteins. C. Immunofluorescence confocal microscopy analysis of the distribution of endogenous TRAF3 and CD30 in the indicated lines, pretreated with proteasome inhibitor bortezomib (5 nM) overnight. Antibodies used are indicated on the top.
Figure 7:
Figure 7:. Genetic alternations in ALCL are required for alternative NF-κB activation.
A. Indicated ALCL lines were treated with ALK inhibitor crizotinib (300 nM) or DMSO for 16 hours. Lysates were analyzed by immunoblotting for the indicated proteins. B. ALK+ ALCL line DEL and Karpas299 were transduced with ALK or Ctrl shRNAs, selected and expression induced. Lysates were analyzed by immunoblotting for the indicated proteins. C. ALK− ALCL lines MAC2B and TLBR2 were transduced with two JAK2 or Ctrl sgRNAs, selected and expression induced. Lysates were analyzed by immunoblotting for the indicated proteins. *indicates that this sgRNA targets both JAK2 WT and PCMI-JAK2 fusion. D. HEK293 cells were co-transfected of a STAT3 reporter and a Renilla luciferase control, together with an empty vector, STAT3 WT or indicated STAT3 mutant plasmids for 24 hours. The relative STAT3 reporter activity was measured and normalized to empty vector controls. The expression of STAT3 WT and mutants were analyzed by immunoblotting for the indicated proteins (lower). E. Lymphoma cell line MedB1 was transduced with a control vector, WT STAT3 or indicated STAT3 mutants, selected and expression induced. Lysates were analyzed by immunoblotting for the indicated proteins. F. Model of the alternative NF-κB activation in ALCL. The cartoon depicts a working model of how recurrent genetic alternations in ALK− and ALK+ ALCL regulate STAT3 activity, thereby amplifying NFKB2 and CD30 expression. NFKB2 induction promotes alternative NF-κB activation in both ALK+ and ALK− ALCL, while CD30 expression triggers alternative NF-κB through TRAF3-NIK-IKKα signaling cassette only in ALK− ALCL.

Similar articles

Cited by

References

    1. Swerdlow SH, Campo E, Pileri SA, Harris NL, Stein H, Siebert R, et al. The 2016 revision of the World Health Organization classification of lymphoid neoplasms. Blood 2016. May 19; 127(20): 2375–2390. - PMC - PubMed
    1. Morris SW, Kirstein MN, Valentine MB, Dittmer KG, Shapiro DN, Saltman DL, et al. Fusion of a kinase gene, ALK, to a nucleolar protein gene, NPM, in non-Hodgkin’s lymphoma. Science 1994. Mar 4; 263(5151): 1281–1284. - PubMed
    1. Shiota M, Fujimoto J, Semba T, Satoh H, Yamamoto T, Mori S. Hyperphosphorylation of a novel 80 kDa protein-tyrosine kinase similar to Ltk in a human Ki-1 lymphoma cell line, AMS3. Oncogene 1994. Jun; 9(6): 1567–1574. - PubMed
    1. Kempf W CD30+ lymphoproliferative disorders: histopathology, differential diagnosis, new variants, and simulators. J Cutan Pathol 2006. Feb; 33 Suppl 1: 58–70. - PubMed
    1. Falini B, Martelli MP. Anaplastic large cell lymphoma: changes in the World Health Organization classification and perspectives for targeted therapy. Haematologica 2009. Jul; 94(7): 897–900. - PMC - PubMed

Publication types

MeSH terms