

Performance of Four Consumer-grade Air Pollution Measurement Devices in Different Residences
- PMID: 33184562
- PMCID: PMC7654960
- DOI: 10.4209/aaqr.2019.01.0045
Performance of Four Consumer-grade Air Pollution Measurement Devices in Different Residences
Abstract
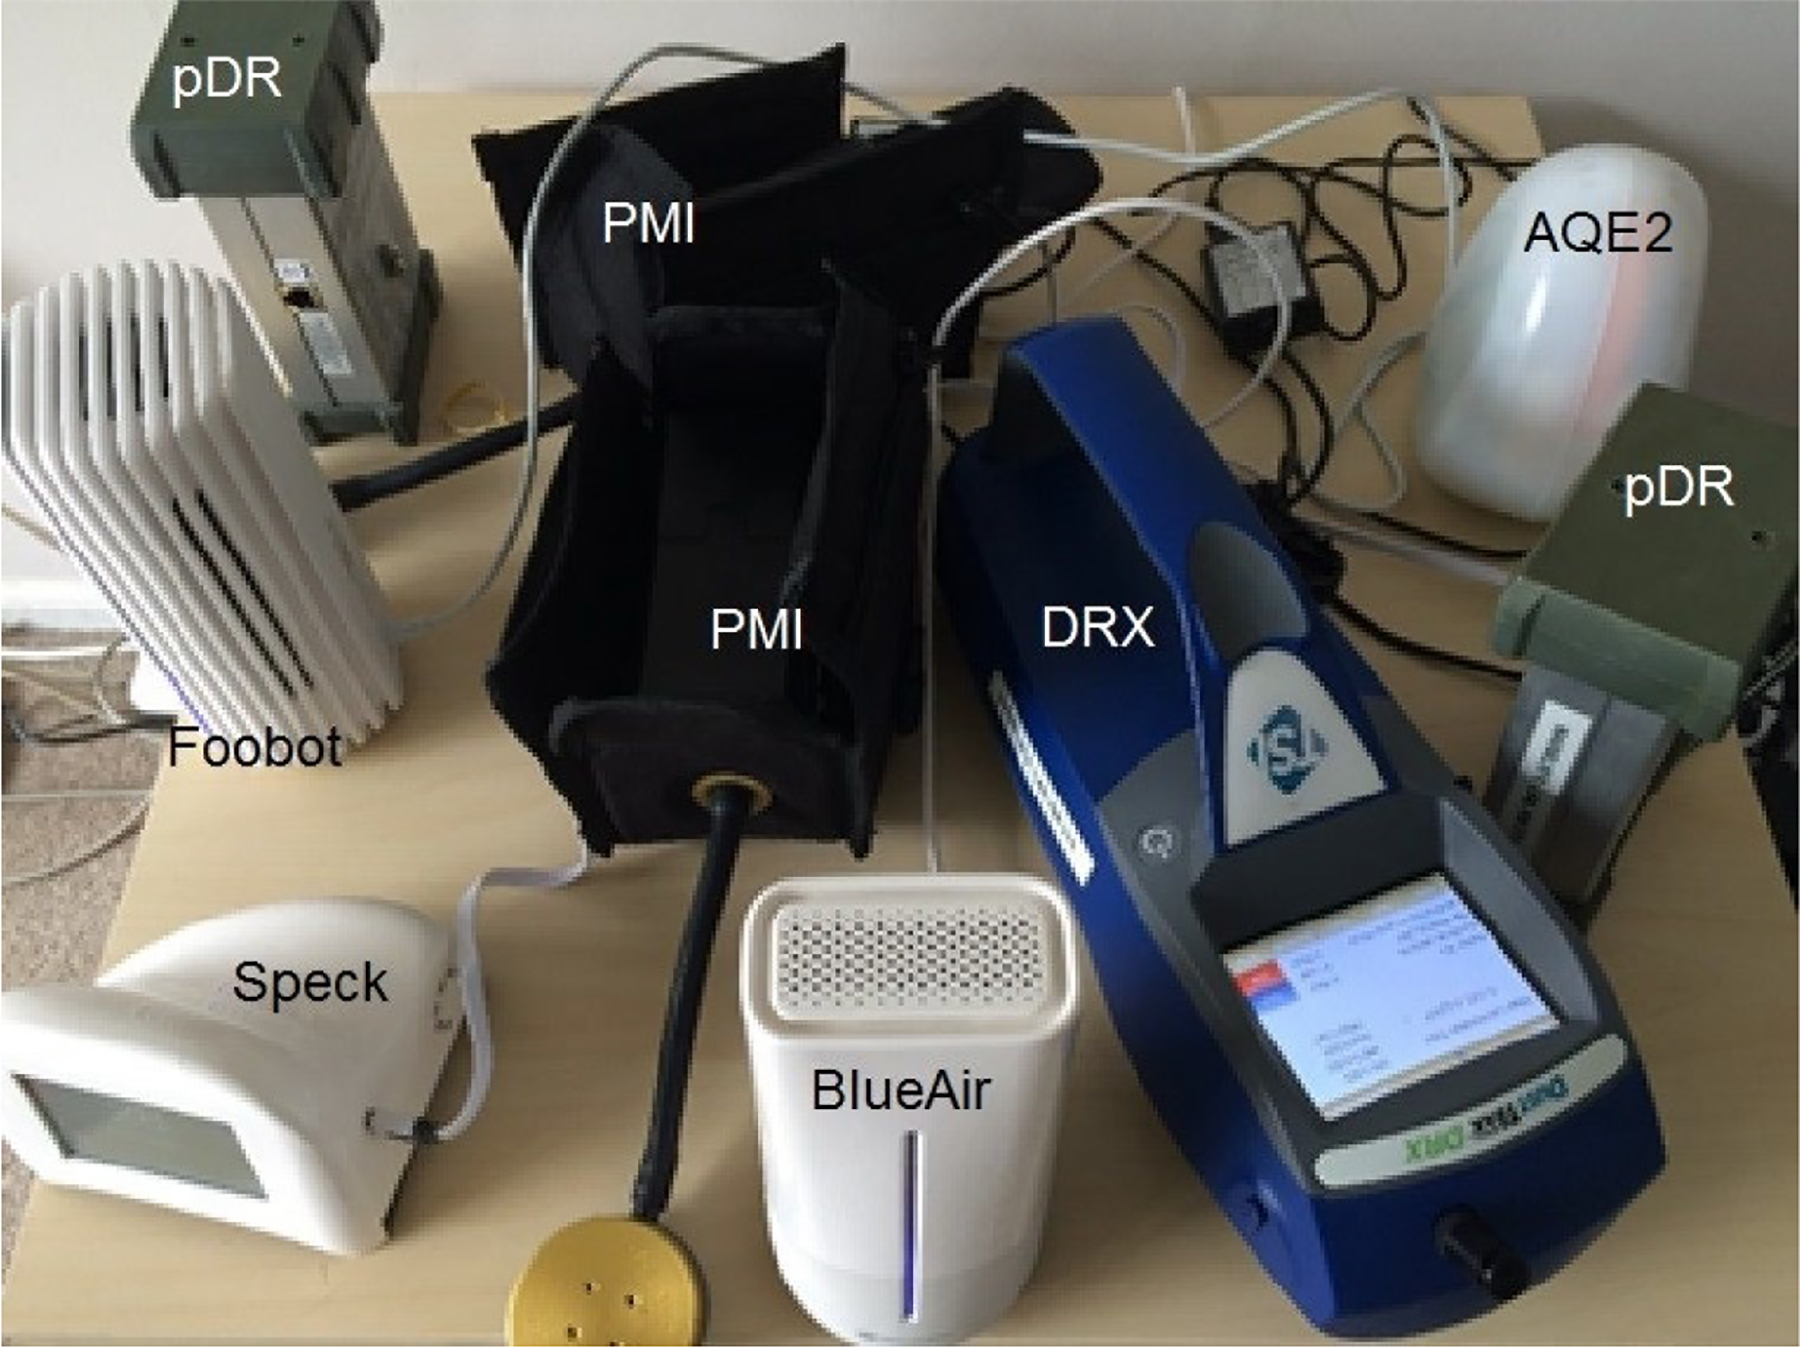
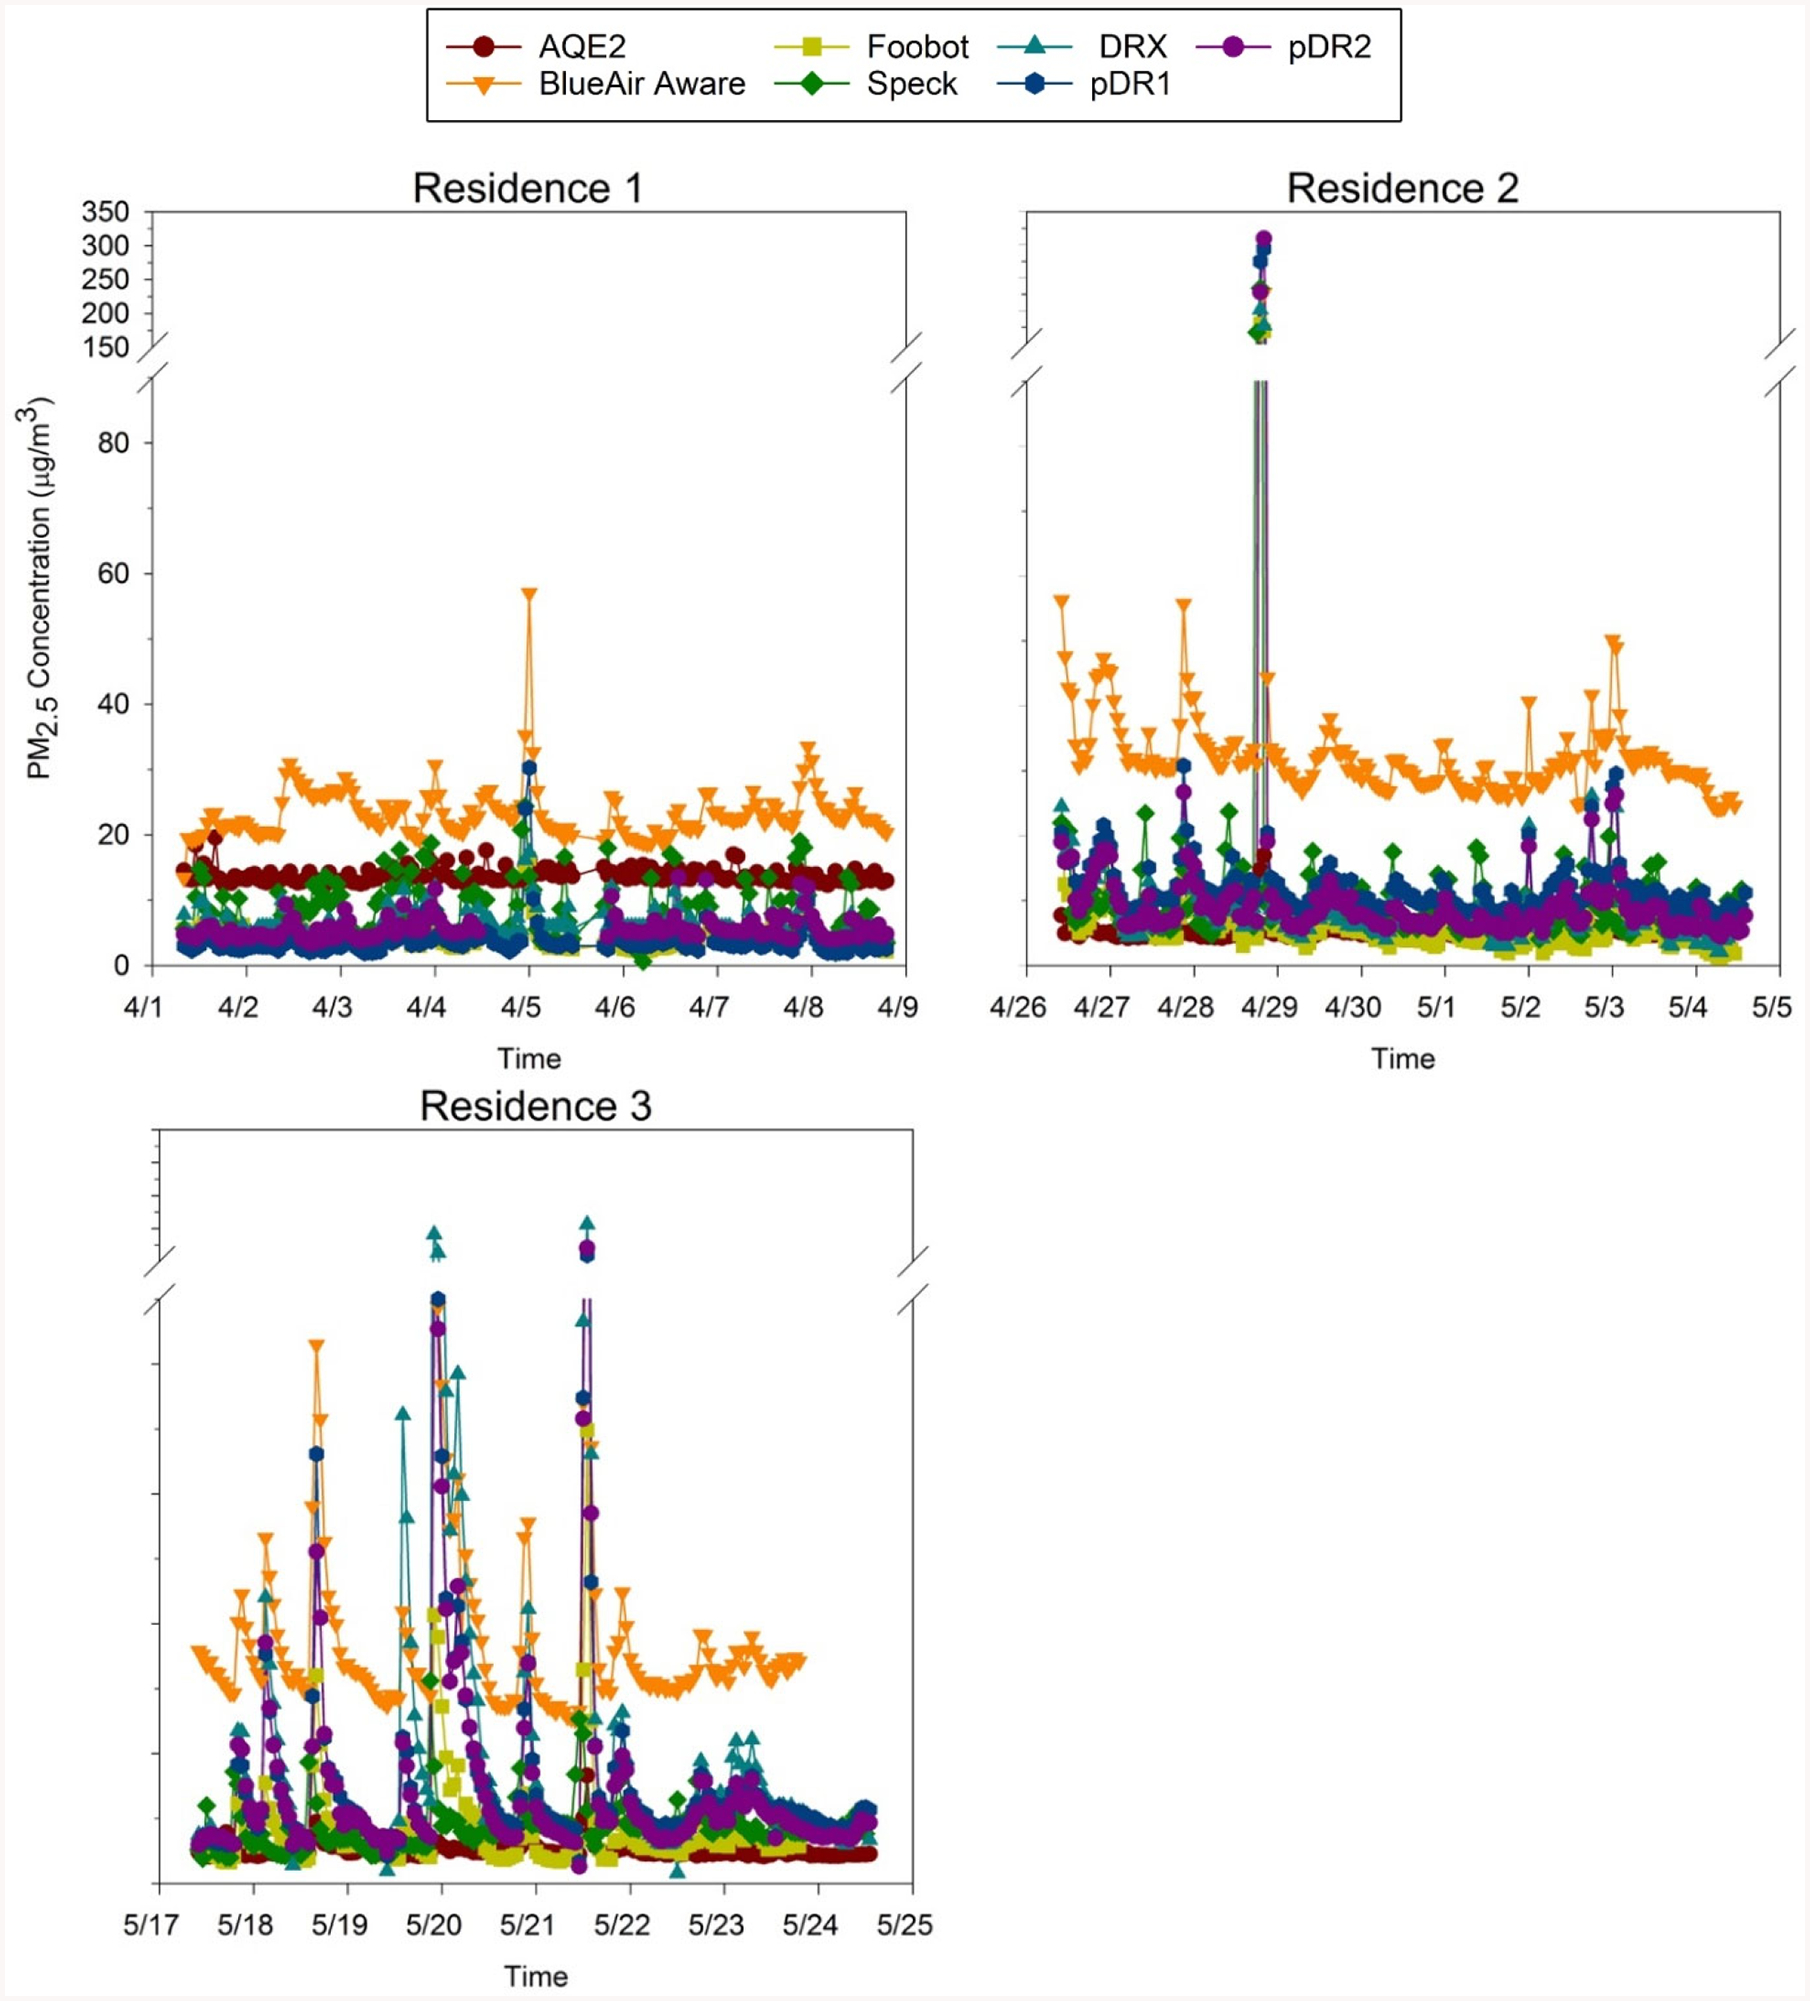
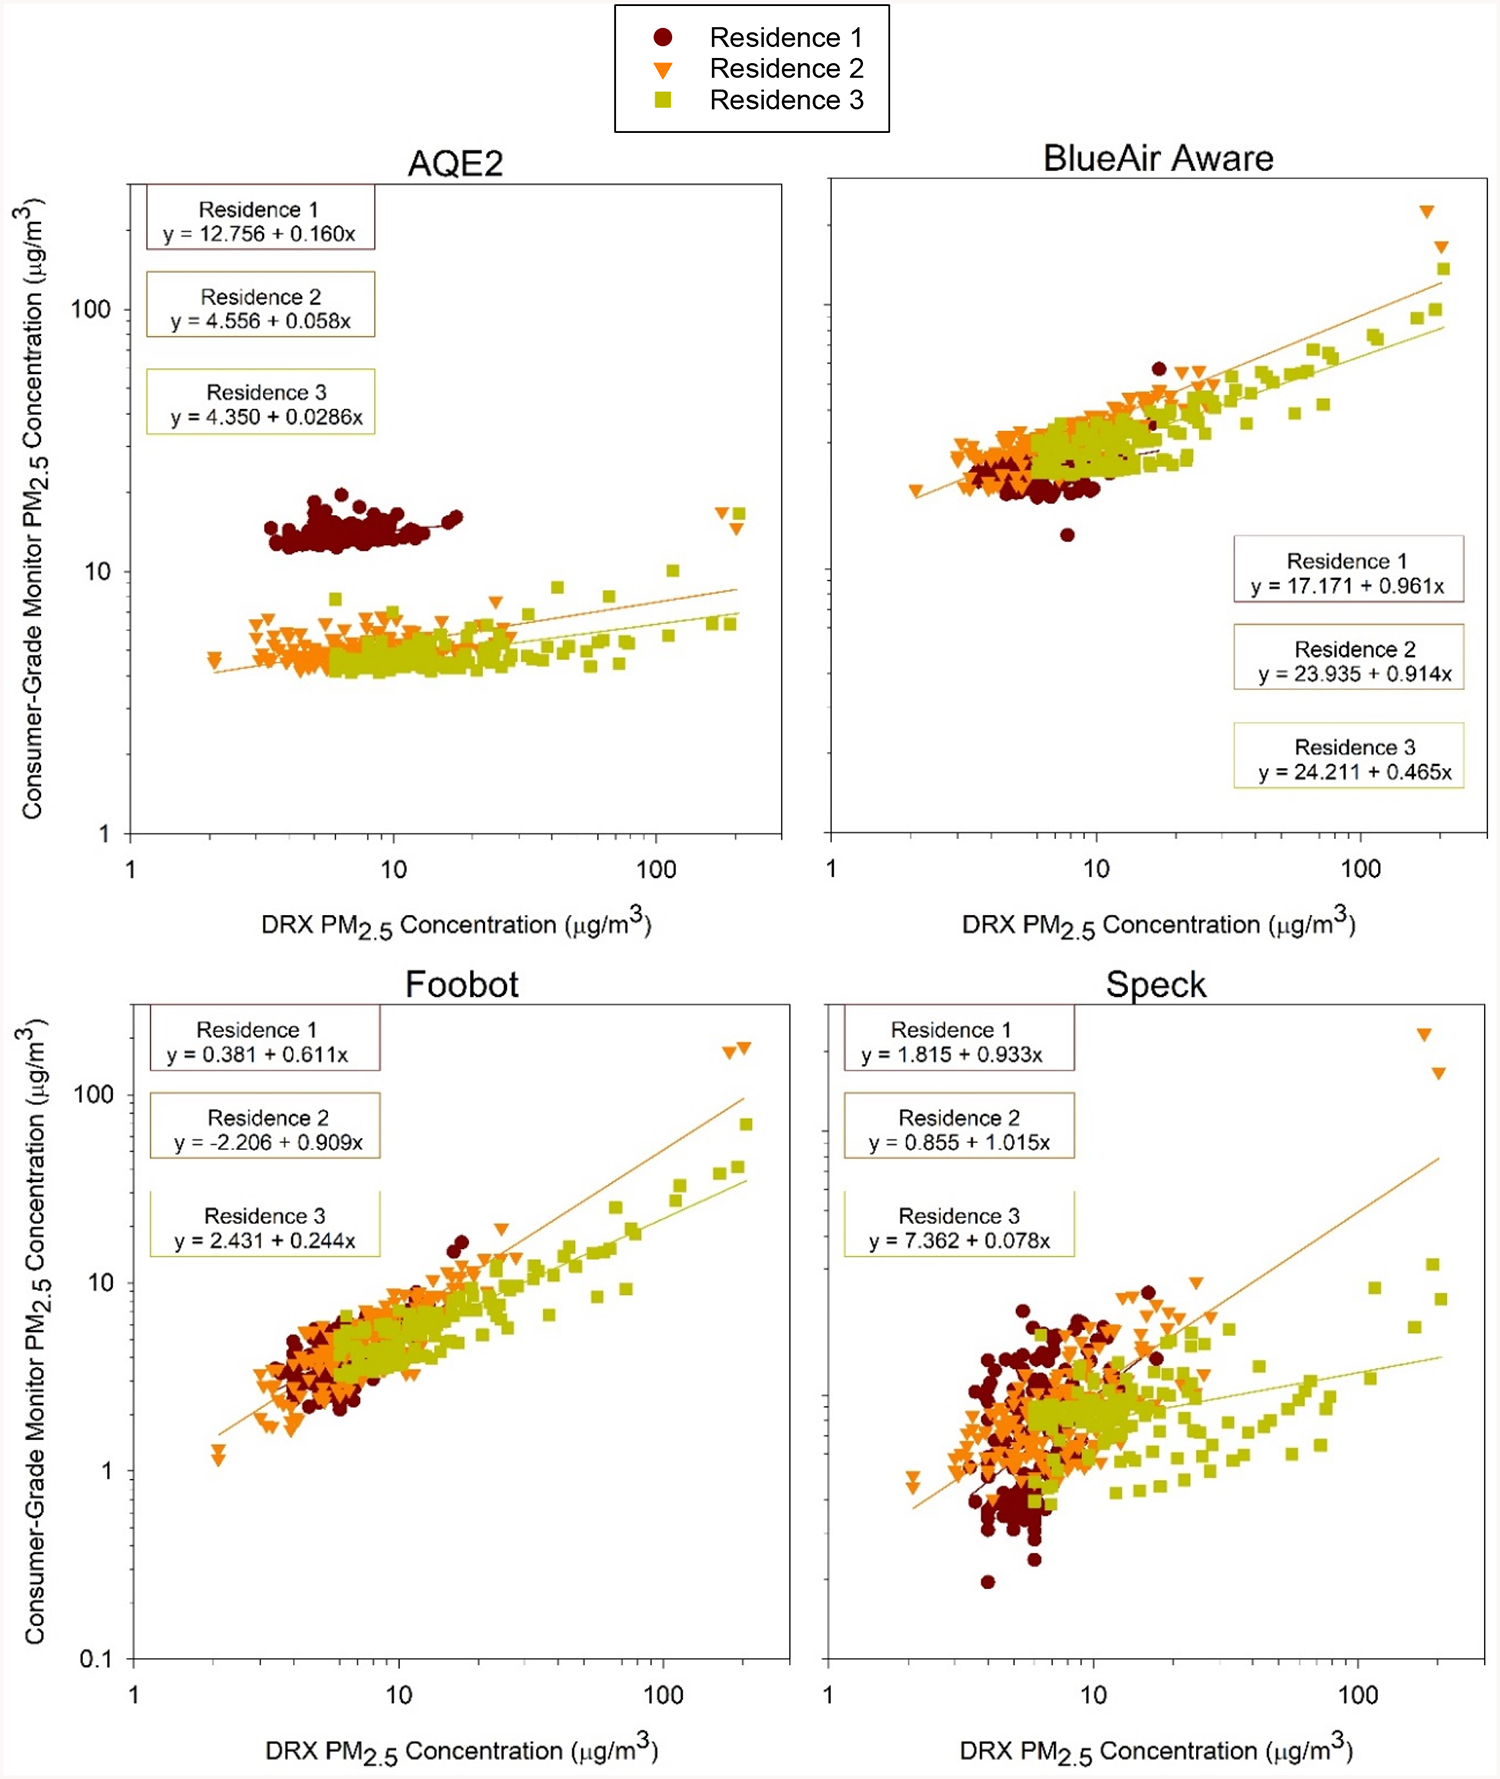
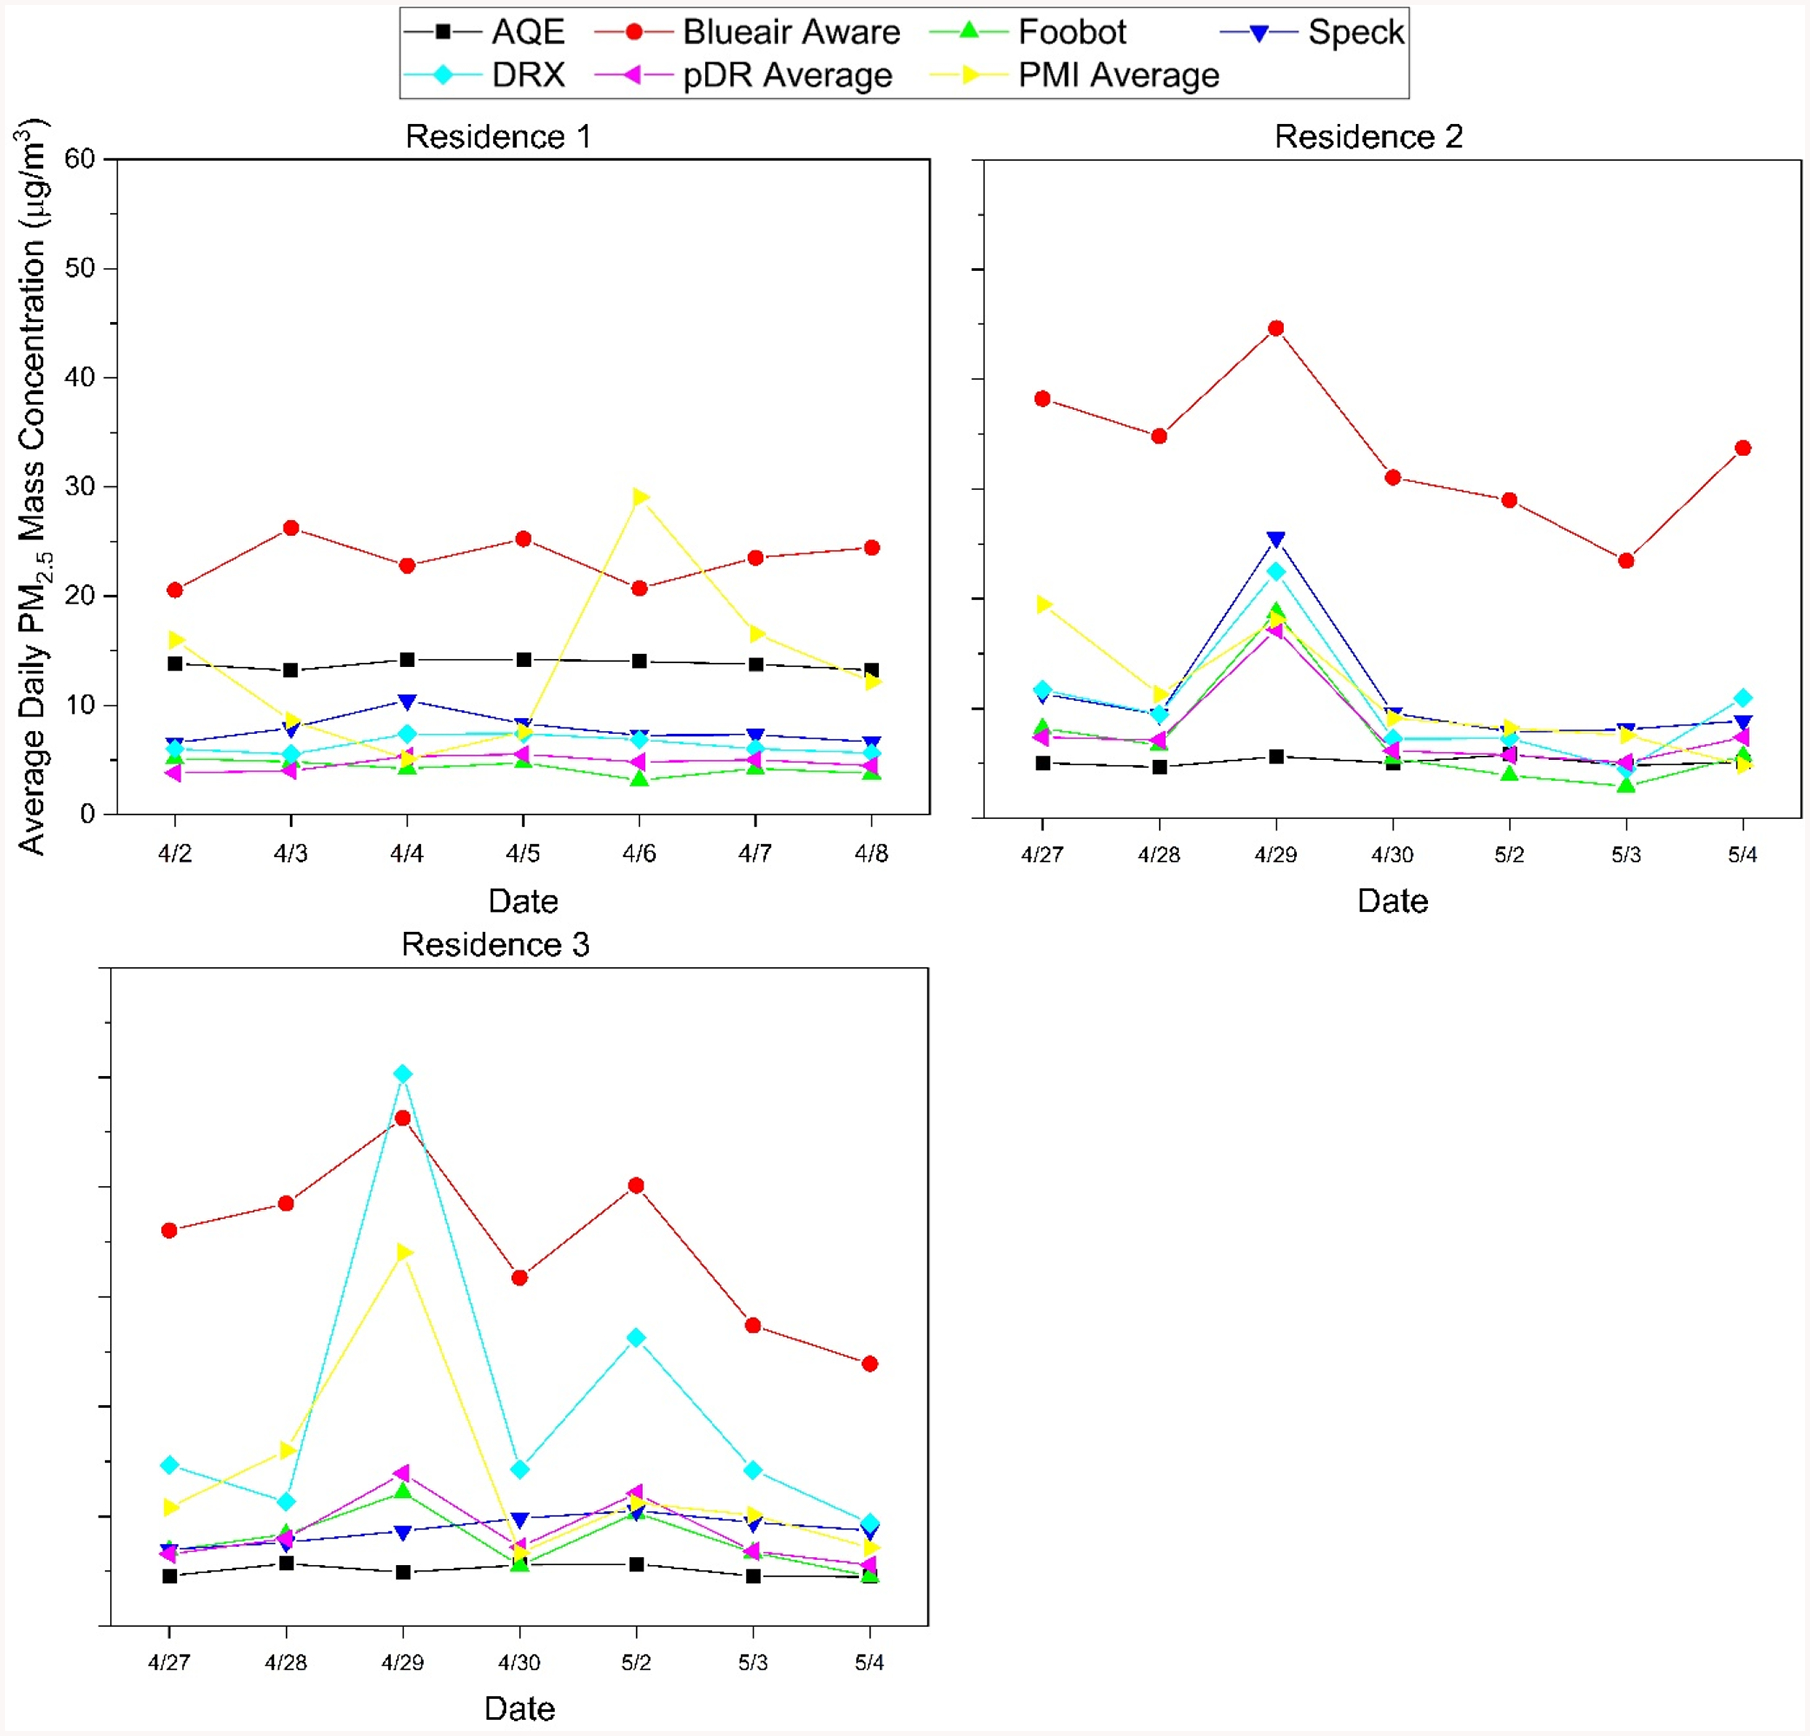
There has been a proliferation of inexpensive consumer-grade devices for monitoring air pollutants, including PM2.5 and certain gasses. This study compared the performance of four consumer-grade devices-the Air Quality Egg 2 (AQE2), BlueAir Aware, Foobot, and Speck-that utilize optical sensors to measure the PM2.5 concentration. The devices were collocated and operated for 7 days in each of three residences, and the PM2.5 mass concentrations were compared with those measured by established optical sensing devices, viz., the personal DataRAM and DustTrak DRX, as well as the filter-based Personal Modular Impactor (PMI). Overall, the Foobot and BlueAir displayed the strongest correlations with the direct-reading reference instruments for both the hourly and daily PM2.5 mass concentrations. Comparing the 1-hour averages obtained with the DustTrak DRX for all of the residences with those obtained with the Foobot, BlueAir, AQE2, and Speck, the Pearson's correlation coefficients (R's) were 0.80, 0.88, -0.028, and 0.60, respectively. Overall, the strength of the correlation depended on the specific residence, likely due to the differences in aerosol composition. The correlations with the PMI measurements were moderate, with R values of 0.44 and 0.56 for the BlueAir and Foobot, respectively. The correlation coefficients for the daily values obtained with the AQE2 and Speck were -0.59 and 0.70 compared to the PMI. According to a paired t-test, the average 24-h PM2.5 concentration data obtained using the consumer-grade monitors were statistically different (p > 0.05) from the mass values measured by the gravimetric filters. Overall, this study demonstrates the ability of consumer grade air pollution monitors to report PM2.5 trends accurately; however, for accurate mass concentration measurements, these monitors must be calibrated for a particular location and application. Further testing is needed to determine their suitability for long-term indoor field studies.
Keywords: Indoor air; Low-cost monitors; PM2.5.
Conflict of interest statement
CONFLICT OF INTEREST The authors declare that they have no conflict of interest.
Figures
Similar articles
-
Comparison of real-time instruments and gravimetric method when measuring particulate matter in a residential building.J Air Waste Manag Assoc. 2016 Nov;66(11):1109-1120. doi: 10.1080/10962247.2016.1201022. J Air Waste Manag Assoc. 2016. PMID: 27333205 Free PMC article.
-
Evaluation of consumer monitors to measure particulate matter.J Aerosol Sci. 2017 May;107:123-133. doi: 10.1016/j.jaerosci.2017.02.013. Epub 2017 Feb 21. J Aerosol Sci. 2017. PMID: 28871212 Free PMC article.
-
Response of consumer and research grade indoor air quality monitors to residential sources of fine particles.Indoor Air. 2018 Jul;28(4):624-639. doi: 10.1111/ina.12463. Epub 2018 May 14. Indoor Air. 2018. PMID: 29683219
-
One Year Evaluation of Three Low-Cost PM2.5 Monitors.Atmos Environ (1994). 2020 Aug 15;235:117615. doi: 10.1016/j.atmosenv.2020.117615. Epub 2020 May 31. Atmos Environ (1994). 2020. PMID: 32647492 Free PMC article.
-
Bias in PM2.5 measurements using collocated reference-grade and optical instruments.Environ Monit Assess. 2022 Jul 25;194(9):610. doi: 10.1007/s10661-022-10293-4. Environ Monit Assess. 2022. PMID: 35876898
Cited by
-
Towards Personalization of Indoor Air Quality: Review of Sensing Requirements and Field Deployments.Sensors (Basel). 2022 Apr 30;22(9):3444. doi: 10.3390/s22093444. Sensors (Basel). 2022. PMID: 35591133 Free PMC article.
-
Indoor Air Quality in Domestic Environments during Periods Close to Italian COVID-19 Lockdown.Int J Environ Res Public Health. 2021 Apr 12;18(8):4060. doi: 10.3390/ijerph18084060. Int J Environ Res Public Health. 2021. PMID: 33921463 Free PMC article.
-
Field Evaluation and Calibration of Low-Cost Air Pollution Sensors for Environmental Exposure Research.Sensors (Basel). 2022 Mar 19;22(6):2381. doi: 10.3390/s22062381. Sensors (Basel). 2022. PMID: 35336552 Free PMC article.
-
Wildfire and prescribed burning impacts on air quality in the United States.J Air Waste Manag Assoc. 2020 Jun;70(6):583-615. doi: 10.1080/10962247.2020.1749731. J Air Waste Manag Assoc. 2020. PMID: 32240055 Free PMC article. Review.
References
-
- Adgully (2016). Blueair stages global launch of world’s first fully integrated IoT air purification. Adgully Bureau, https://www.adgully.com/blueair-stages-global-launch-of-world-s-first-fu...
-
- AirViz Inc. (2019). Speck public data, https://www.specksensor.com/public-data#loc=, Last Access: 01/25/2019.
-
- Amaral S, De Carvalho J, Costa M and Pinheiro C (2015). An overview of particulate matter measurement instruments. Atmosphere 6: 1327–1345.
-
- Austen K (2015). Pollution patrol. Nature 517: 136–138. - PubMed
-
- Benton-Vitz K and Volckens J (2008). Evaluation of the pDR-1200 real-time aerosol monitor. J. Occup. Environ. Hyg 5: 353–359. - PubMed
Grants and funding
LinkOut - more resources
Full Text Sources