. 2020 Jun 24;13(5):487-505.
doi: 10.1007/s12195-020-00633-0. eCollection 2020 Oct.

Cholinergic Activation of Primary Human Derived Intestinal Epithelium Does Not Ameliorate TNF-α Induced Injury

Affiliations

Cholinergic Activation of Primary Human Derived Intestinal Epithelium Does Not Ameliorate TNF-α Induced Injury

Sanjin Hosic et al. Cell Mol Bioeng. .

Abstract

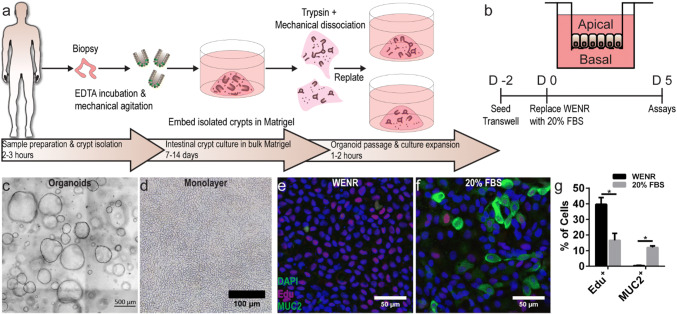
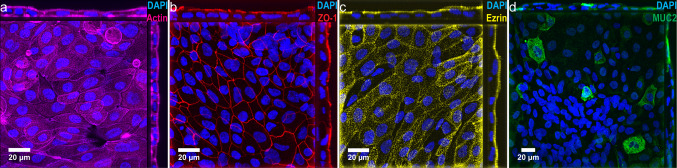
Introduction: The intestinal epithelium contains specialized cells including enterocytes, goblet, Paneth, enteroendocrine, and stem cells. Impaired barrier integrity in Inflammatory Bowel Disease is characterized by elevated levels of pro-inflammatory cytokines, including tumor necrosis factor-alpha (TNF-α). Prior studies in immortalized lines such as Caco-2, without native epithelial heterogeneity, demonstrate the amelioration of TNF-α compromised barrier integrity via nicotinic (nAChR) or muscarinic (mAChR) acetylcholine receptor activation.

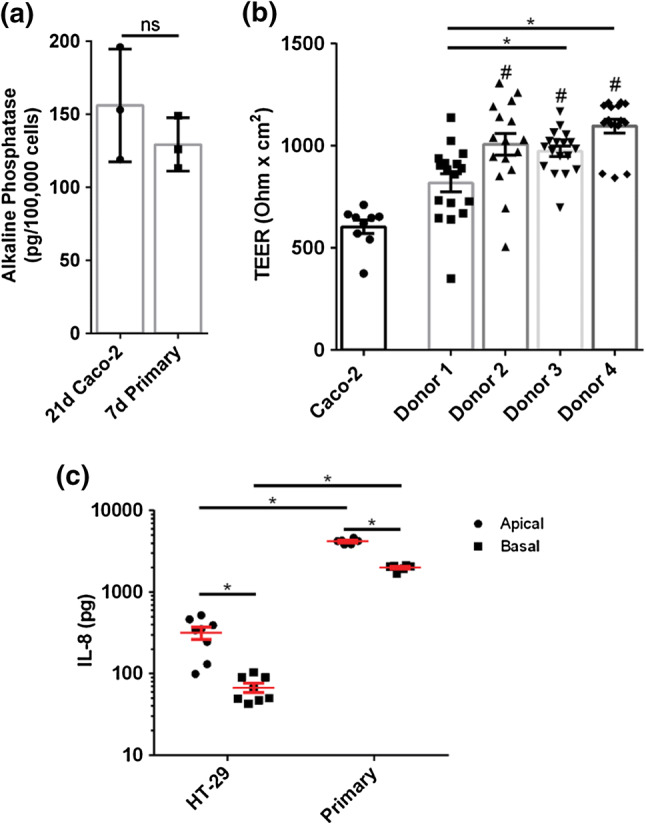
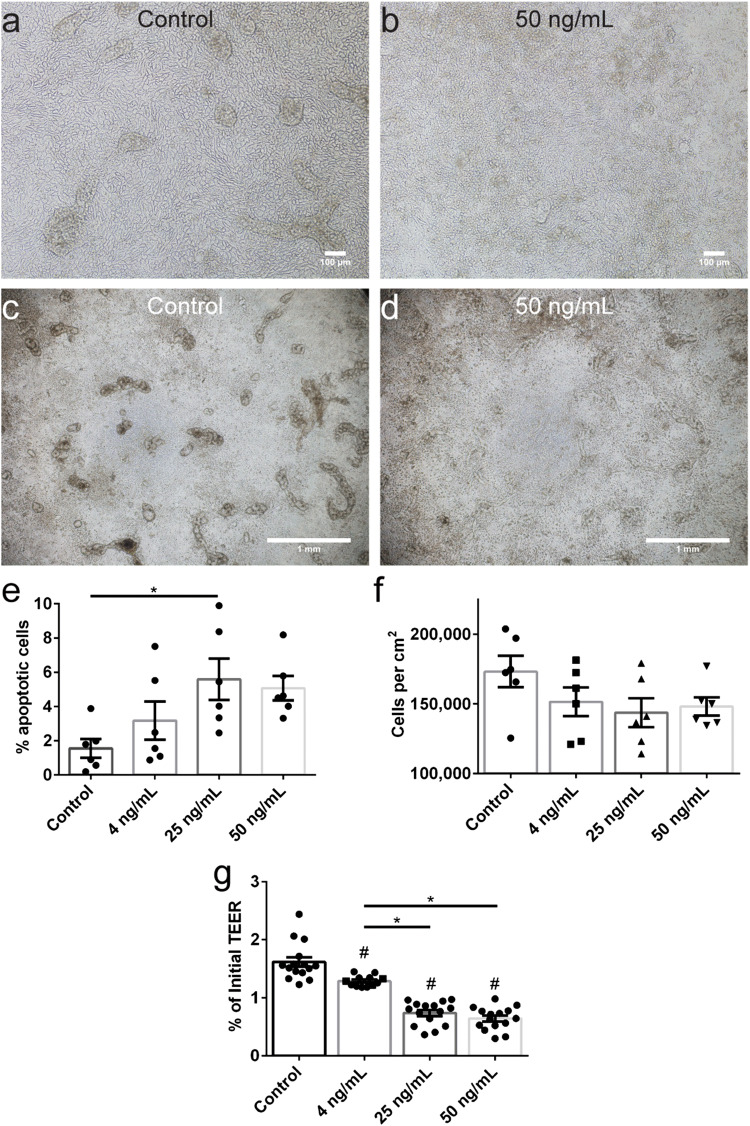
Methods: A tissue-engineered model of primary human small intestinal epithelium was derived from dissociated organoids cultured on collagen-coated Transwells. Differentiation was accomplished with serum-containing media and compared to Caco-2 and HT-29 regarding alkaline phosphatase expression, transepithelial electrical resistance (TEER), and IL-8 secretion. Inflammation was modeled via basal stimulation with TNF-α (25 ng/mL) with or without nicotine (nAChR agonist) or bethanechol (mAChR agonist). Apoptosis, density (cells/cm2), TEER, lucifer yellow permeability, 70 kDa dextran transport, cell morphology, and IL-8 secretion were characterized.

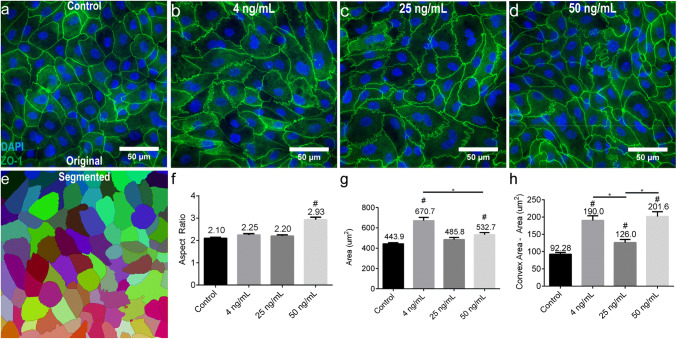
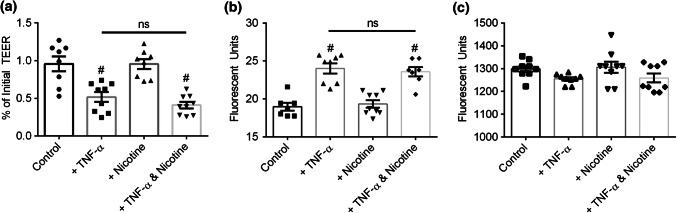
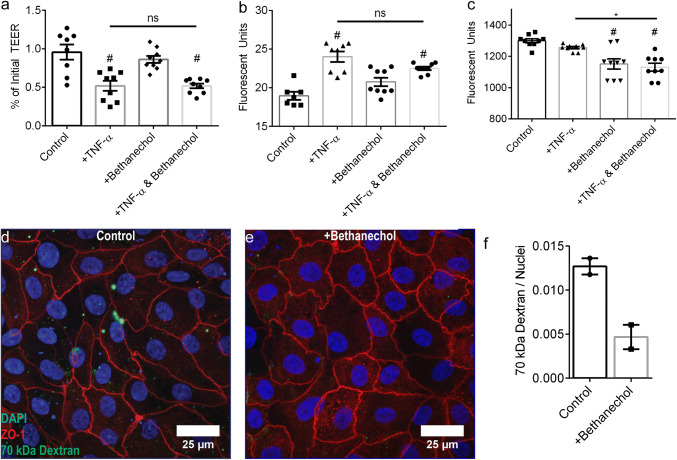
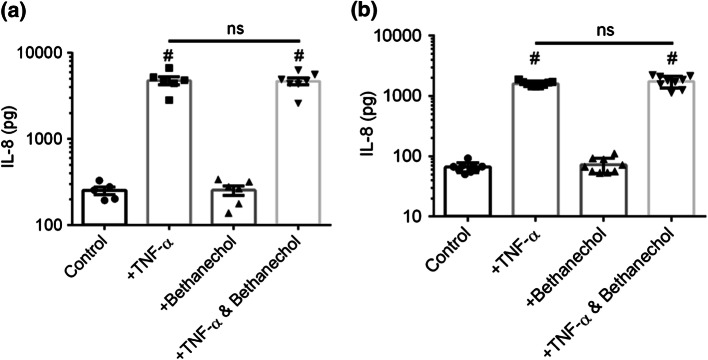
Results: Primary intestinal epithelium demonstrates significant functional differences compared to immortalized cells, including increased barrier integrity, IL-8 expression, mucus production, and the presence of absorptive and secretory cells. Exposure to TNF-α impaired barrier integrity, increased apoptosis, altered morphology, and increased secretion of IL-8. Stimulation of nAChR with nicotine did not ameliorate TNF-α induced permeability nor alter 70 kDa dextran transport. However, stimulation of mAChR with bethanechol decreased transport of 70 kDa dextran but did not ameliorate TNF-α induced paracellular permeability.

Conclusions: A primary model of intestinal inflammation was evaluated, demonstrating nAChR or mAChR activation does not have the same protective effects compared to immortalized epithelium. Inclusion of other native stromal support cells are underway.

Keywords: Inflammation; Muscarinic; Nicotinic; Organoid; Tumor necrosis factor; mAChR; nAChR.


Figures

Figure 1
Figure 1
Dissociated human intestinal organoids form differentiated intestinal epithelial monolayers. (a) Schematic representation of the protocol to generate biopsy derived human small intestinal organoids. (b) Schematic representation of a monolayer formed on a permeable insert by seeding organoid derived intestinal cells for 2 days in WENR medium and differentiation media for 5 days. (c) Biopsy derived human small intestinal organoids were expanded in WENR medium and dissociated to establish monolayers (d) on permeable inserts. Scale bars denote 500 and 100 µm, respectively. (e) Representative images of monolayers grown in WENR media or 20% FBS differentiation media (f) for 7 days showed increased proliferation marker Edu+ cells (red) or goblet cell marker MUC2+ cells (green), respectively. Scale bars denote 50 µm. (g) Edu+ cells significantly decreased in 20% FBS cultured monolayers from 39.6 to 16.6% while MUC+ cells significantly increased in 20% FBS from to 0.4 to 12% (*p < 0.05 by student’s t test). Data are presented as mean ± SEM from 3 independent experiments using monolayers generated from one donor.
Figure 2
Figure 2
Confocal morphological imaging and lineage analysis of primary organoid derived small intestinal epithelium cultured with 20% FBS medium. (a) Orthogonal xy projection and cross-sectional views of confocal microscopic images showing intestinal epithelium immunostained for F-actin (magenta) and DAPI (blue). (b) Orthogonal x-y projection and cross-sectional views of confocal microscopic images showing intestinal epithelium immunostained for ZO-1 (red) and DAPI (blue). (c) Orthogonal xy projection and cross-sectional views of confocal microscopic images showing intestinal epithelium immunostained for phospho-ezrin (yellow) and DAPI (blue). (d) Orthogonal xy projection and cross-sectional views of confocal microscopic images showing intestinal epithelium immunostained for MUC2 (green) and DAPI (blue). Scale bars denote 20 µm.
Figure 3
Figure 3
Functional comparison of organoid derived primary human intestinal monolayers (cultured in 20% FBS) and immortalized Caco-2 and HT-29 cell derived human intestinal monolayers. (a) Primary human monolayers cultured for 5 days in 20% FBS comparably expressed alkaline phosphatase as Caco-2 monolayers cultured for 21 days (p > 0.05 by student’s t test). (b) Primary human monolayers cultured for 5 days in 20% FBS showed comparable or greater TEER as Caco-2 monolayers cultured for 5 days (* and # p < 0.05 by ANOVA followed by Tukey’s HSD test, # denotes comparison to Caco-2 monolayers). (c) HT-29 monolayers and primary human monolayers cultured for 7 days both showed significantly increased apical IL-8 secretion compared to basal secretion. Primary human monolayers showed significantly increased apical and basal IL-8 secretion compared to HT-29 monolayers (*p < 0.05 by two-way ANOVA with Sidak’s multiple comparisons test). Seeding densities were: Caco-2: 2.5E5 cells/cm2, HT-29 cells: 2.6E5 cells/cm2, and smaller primary cells: 9.09E5 cells/cm2. All data are presented as mean ± SEM from at least 3 independent experiments from one donor unless specified as in panel b.
Figure 4
Figure 4
The effect of cytokine TNF-α on organoid derived primary human intestinal monolayers. (a) Representative phase contrast image of a monolayer cultured for 5 days in 20% FBS. (b) Monolayer exposure to 50 ng mL−1 TNF-α in the basal compartment for 48 h increased cell death and decreased visibility of cell-cell junctions. Panels a and b: scale bars denote 100 µm. (c) Representative phase contrast image of a monolayers with multicellular morphology. (d) Monolayer exposure to 50 ng mL−1 TNF-α in the basal compartment for 48 h eliminated multicellular morphology. Panels c and d: scale bars denote 1 mm. (e) Monolayer exposure to varying doses of TNF-α in the basal compartment for 48 h increased the number of apoptotic cells. (f) Monolayers exposure to varying doses of TNF-α in the basal compartment for 48 h decreased monolayer density. (g) TEER decreased upon exposure to varying doses of TNF-α in the basal compartment for 48 h. All panels: * and # p < 0.05 by ANOVA followed by Tukey’s HSD test, # denotes comparison to control. All data are presented as mean ± SEM from at least 3 independent experiments from one donor.
Figure 5
Figure 5
Quantitative morphological analysis of primary human intestinal monolayers exposed to cytokine TNF-α. (a) The morphology of monolayers cultured for 5 days in 20% FBS was visualized by immunostaining and fluorescent microscopy of tight junctions (ZO-1, green) and cell nuclei (blue). Scale bar denotes 50 µm. (b–d) Representative images of monolayers exposed to varying doses of TNF-α in the basal compartment for 48 h demonstrated morphological changes such as elongation and rippled or kinked tight junctions. Scale bars denote 50 µm. (e) Schematic representation of monolayer segmentation of the image in panel a, using tight junction protein ZO-1 for cell border detection. (f) The aspect ratio of cells significantly increased following exposure to 50 ng mL−1 TNF-α in the basal compartment for 48 h. (g) Cell size significantly increased following exposure to 4 and 50 ng mL−1 TNF-α in the basal compartment for 48 h. (h) The difference between the convex area and the cell area significantly increased following exposure to 4, 25, and 50 ng mL−1 TNF-α in the basal compartment for 48 h. All panels: * and # p < 0.05 by ANOVA followed by Tukey’s HSD test, # denotes comparison to control. All data are presented as mean ± SEM from at least 3 independent experiments from one donor.
Figure 6
Figure 6
Primary human intestinal epithelial barrier integrity after exposure to nicotine and/or TNF-α. (a) TEER significantly decreased following exposure to 25 ng mL−1 TNF-α in the basal compartment for 4 h. TEER did not change following exposure to 50 µM nicotine in the basal compartment for 4 h. Pre-incubation with 50 µM nicotine in the basal compartment for 30 min prior to TNF-α did not eliminate TNF-α induced TEER decrease. (b) Lucifer yellow flux significantly increased following exposure to 25 ng mL−1 TNF-α in the basal compartment for 4 h. Lucifer yellow flux did not change following exposure to 50 µM nicotine in the basal compartment for 4 h. Pre-incubation with 50 µM nicotine in the basal compartment for 30 min prior to TNF-α did not eliminate TNF-α increased lucifer yellow permeability. (c) 70 kDa dextran flux did not change following exposure to 25 ng mL−1 TNF-α or 50 µM nicotine in the basal compartment for 4 h. All panels: * and # p < 0.05 by ANOVA followed by Tukey’s HSD test, # denotes comparison to control. All data are presented as mean ± SEM from at least 3 independent experiments from one donor.
Figure 7
Figure 7
Primary human intestinal epithelial barrier integrity after exposure to bethanechol and/or TNF-α. (a) TEER significantly decreased following exposure to 25 ng mL−1 TNF-α in the basal compartment for 4 h. TEER did not change following exposure to 50 µM bethanechol in the basal compartment for 4 h. Pre-incubation with 50 µM bethanechol in the basal compartment for 30 min prior to TNF-α did not eliminate TNF-α induced TEER decrease. (b) Lucifer yellow flux significantly increased following exposure to 25 ng mL−1 TNF-α in the basal compartment for 4 h. Lucifer yellow flux did not change following exposure to 50 µM bethanechol in the basal compartment for 4 h. Pre-incubation with 50 µM bethanechol in the basal compartment for 30 min prior to TNF-α did not eliminate TNF-α increased lucifer yellow permeability. (c) 70 kDa dextran flux did not change following exposure to 25 ng mL−1 TNF-α in the basal compartment for 4 h. 70 kDa dextran flux significantly decreased following exposure to 50 µM bethanechol with or without TNF-α co-incubation in the basal compartment for 4 h. Panels a–c: * and # p < 0.05 by ANOVA followed by Tukey’s HSD test, # denotes comparison to control. Panels a–c: data is presented as mean ± SEM from at least 3 independent experiments from one donor. (d) A representative image of a monolayer showing internalization of an apically introduced lysine fixable TMR conjugated 70 kDa dextran. (e) A representative image of a monolayer incubated with 50 µM bethanechol for 4 showing a lack of internalization of an apically introduced lysine fixable TMR conjugated 70 kDa dextran. (f) The integrated raw fluorescence intensity due to internalized TRM conjugated dextran normalized by the nuclei area occupied by DAPI fluorescence was lower for monolayers exposed to 50 µM bethanechol in the basal compartment for 4 h. Data are presented as mean ± SEM from 2 independent experiments from one donor.
Figure 8
Figure 8
IL-8 secretion by organoid derived human intestinal epithelial barrier integrity after exposure to bethanechol and/or TNF-α. (a) Exposure to 25 ng/mL TNF-α in the basal compartment for 8 h significantly increased basal IL-8 secretion. Exposure to 50 µM bethanechol in the basal compartment for 8 h did not alter IL-8 secretion. Pre-incubation with 50 µM bethanechol in the basal compartment for 30 min prior to 25 ng/mL TNF-α did not eliminate TNF-α increased basal IL-8 secretion. (b) The same experiment was conducted after a 4-h exposure to TNF-α, with identical results as an 8 h exposure. (* and # p < 0.05 by ANOVA followed by Tukey’s HSD test, # denotes comparison to control). Data are presented as mean + SEM from at least three independent experiments from one donor.
Figure 9
Figure 9
Kinetic and endpoint analysis of TNFR1 shedding by organoid derived human intestinal epithelium after basal exposure to carbachol. (a) Exposure to 100 µM carbachol in the basal compartment did not increase the apical or basal TNFR1 concentration for up to 2 h. Data are presented as mean ± SD from 1 independent experiment with three independent monolayers. (b) The experiment was repeated as an endpoint analysis after a 30 min exposure to 100 µM carbachol in the basal compartment. Exposure to 100 µM carbachol in the basal compartment for 30 min did not increase the apical or basal TNFR1 concentration. Data are presented as mean ± SEM from at least three independent experiments from one donor.

Similar articles

Cited by

References

    1. Andrews C, McLean MH, Durum SK. Cytokine tuning of intestinal epithelial function. Front. Immunol. 2018;9:1270. doi: 10.3389/fimmu.2018.01270. - DOI - PMC - PubMed
    1. Atkin-Smith GK, Poon IKH. Disassembly of the dying: mechanisms and functions. Trends Cell Biol. 2017;27:151–162. doi: 10.1016/j.tcb.2016.08.011. - DOI - PubMed
    1. Beausejour M, et al. Suppression of anoikis in human intestinal epithelial cells: differentiation state-selective roles of alpha2beta1, alpha3beta1, alpha5beta1, and alpha6beta4 integrins. BMC Cell Biol. 2013;14:53. doi: 10.1186/1471-2121-14-53. - DOI - PMC - PubMed
    1. Bhattacharyya A, et al. Apoptogenic effects of black tea on Ehrlich’s ascites carcinoma cell. Carcinogenesis. 2003;24:75–80. doi: 10.1093/carcin/24.1.75. - DOI - PubMed
    1. Birchenough GM, Johansson ME, Gustafsson JK, Bergstrom JH, Hansson GC. New developments in goblet cell mucus secretion and function. Mucosal. Immunol. 2015;8:712–719. doi: 10.1038/mi.2015.32. - DOI - PMC - PubMed

LinkOut - more resources