

Longitudinal associations of modifiable risk factors in the first 1000 days with weight status and metabolic risk in early adolescence
- PMID: 33184628
- PMCID: PMC7779210
- DOI: 10.1093/ajcn/nqaa297
Longitudinal associations of modifiable risk factors in the first 1000 days with weight status and metabolic risk in early adolescence
Abstract
Background: Many studies have identified early-life risk factors for childhood overweight/obesity (OwOb), but few have evaluated how they combine to influence later cardiometabolic health.
Objectives: We aimed to examine the association of risk factors in the first 1000 d with adiposity and cardiometabolic risk in early adolescence.
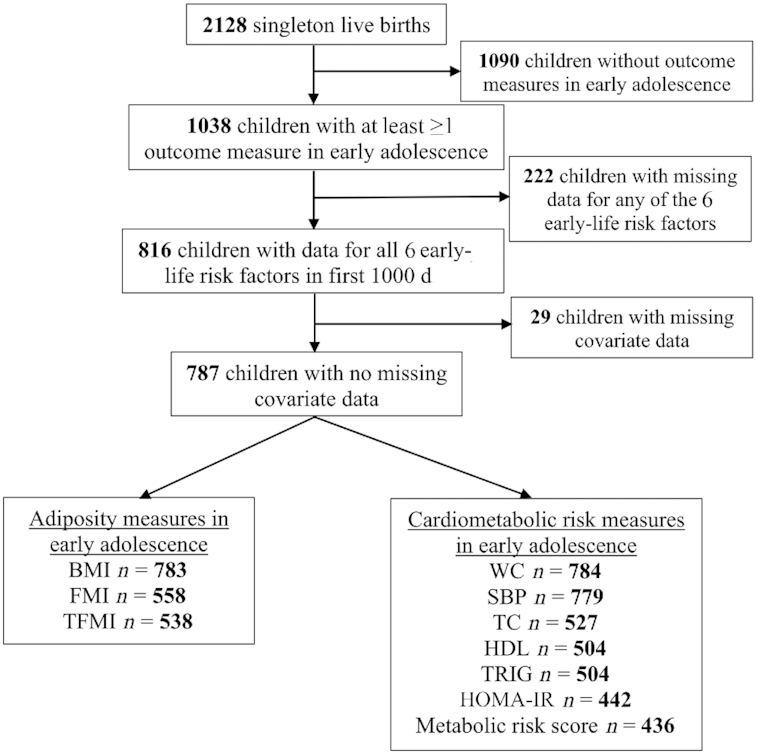
Methods: We studied 1038 mother-child pairs in Project Viva. We chose 6 modifiable early-life risk factors previously associated with child adiposity or metabolic health in the cohort: smoking during pregnancy (yes compared with no); gestational weight gain (excessive compared with nonexcessive); sugar-sweetened beverage consumption during pregnancy (≥0.5 compared with <0.5 servings/d); breastfeeding duration (<12 compared with ≥12 mo); timing of complementary food introduction (<4 compared with ≥4 mo); and infant sleep duration (<12 compared with ≥12 h/d). We computed risk factor scores by calculating the cumulative number of risk factors for each child. In early adolescence (median: 13.1 y) we measured indicators of adiposity [BMI, fat mass index (FMI), trunk fat mass index (TFMI)]. We also calculated OwOb prevalence and metabolic syndrome (MetS) risk z score of adolescents.
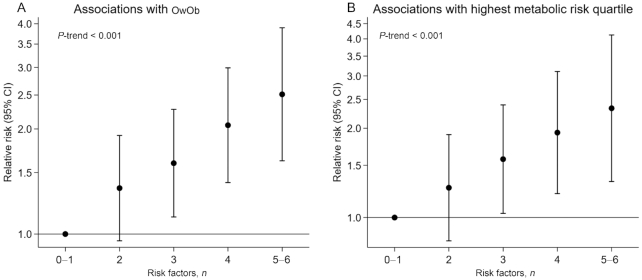
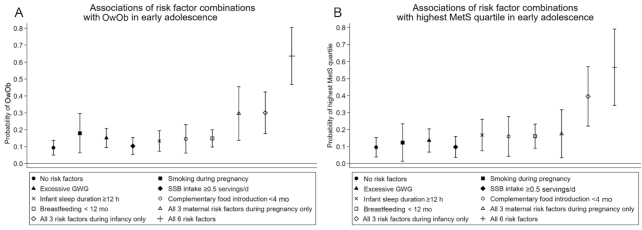
Results: Among 1038 adolescents, 71% had >1 early-life risk factor. In covariate-adjusted models, we observed positive monotonic increases in BMI, FMI, TFMI, and MetS z scores with increasing risk factor score. Children with 5‒6 risk factors (compared with 0-1 risk factors) had the highest risk of OwOb [risk ratio (RR): 2.53; 95% CI: 1.63, 3.91] and being in the highest MetS quartile (RR: 2.46; 95% CI: 1.43, 4.21). The predicted probability of OwOb in adolescence varied from 9.4% (favorable levels for all factors) to 63.6% (adverse levels for all factors), and for being in the highest MetS quartile from 9.6% to 56.6%.
Conclusions: Early-life risk factors in the first 1000 d cumulatively predicted higher adiposity and cardiometabolic risk in early adolescence. Intervention strategies to prevent later obesity and cardiometabolic risk may be more effective if they concurrently target multiple modifiable factors.
Keywords: adolescence; body composition; early-life risk factors; metabolic risk; obesity.
© The Author(s) 2020. Published by Oxford University Press on behalf of the American Society for Nutrition.
Figures

References
-
- Abarca-Gómez L, Abdeen ZA, Hamid Zargar A, Abu-Rmeileh NM, Acosta-Cazares B, Acuin C, Adams RJ, Aekplakorn W, Afsana K, Aguilar-Salinas CA et al. Worldwide trends in body-mass index, underweight, overweight, and obesity from 1975 to 2016: a pooled analysis of 2416 population-based measurement studies in 128.9 million children, adolescents, and adults. Lancet. 2017;390:2627–42. - PMC - PubMed
-
- WHO Commission on Ending Childhood Obesity. Report of the Commission on Ending Childhood Obesity. Implementation plan: executive summary. Geneva: World Health Organization; 2017.
-
- Friend A, Craig L, Turner S. The prevalence of metabolic syndrome in children: a systematic review of the literature. Metab Syndr Relat Disord. 2013;11:71–80. - PubMed
-
- Gillman MW, Ludwig DS. How early should obesity prevention start?. N Engl J Med. 2013;369:2173–5. - PubMed
Grants and funding
LinkOut - more resources
Full Text Sources
