. 2021 Jan 1;320(1):H432-H446.
doi: 10.1152/ajpheart.00737.2020. Epub 2020 Nov 13.

Inhibition of ATGL in adipose tissue ameliorates isoproterenol-induced cardiac remodeling by reducing adipose tissue inflammation

Affiliations

Inhibition of ATGL in adipose tissue ameliorates isoproterenol-induced cardiac remodeling by reducing adipose tissue inflammation

Shingo Takahara et al. Am J Physiol Heart Circ Physiol. .

Abstract

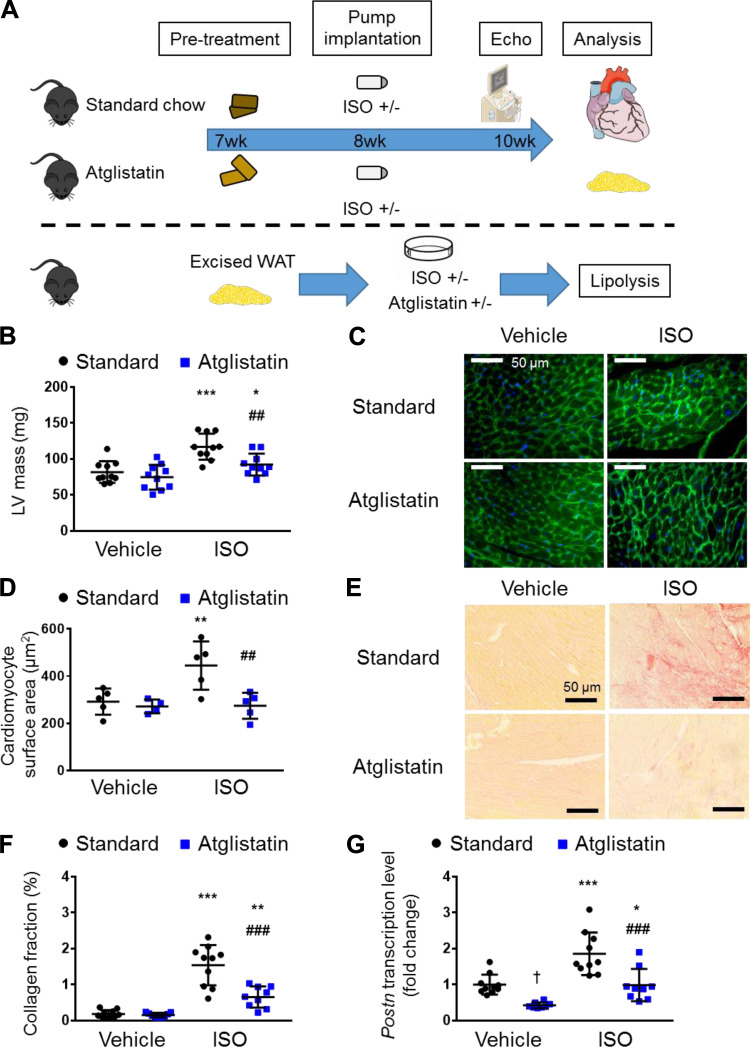
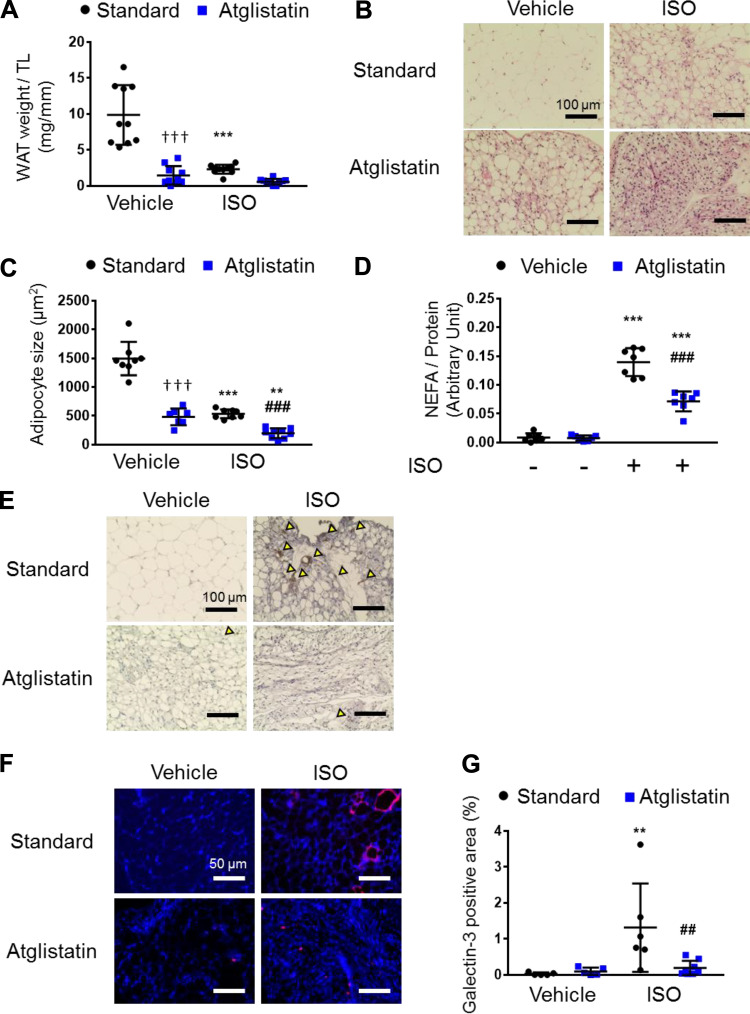
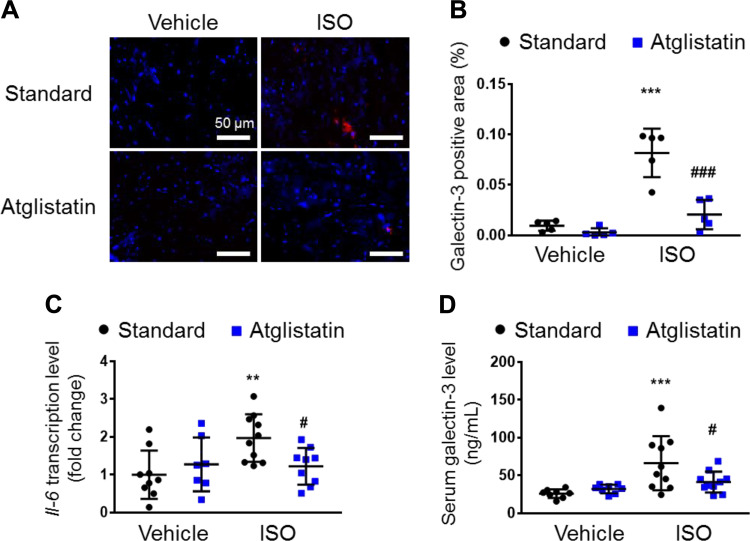
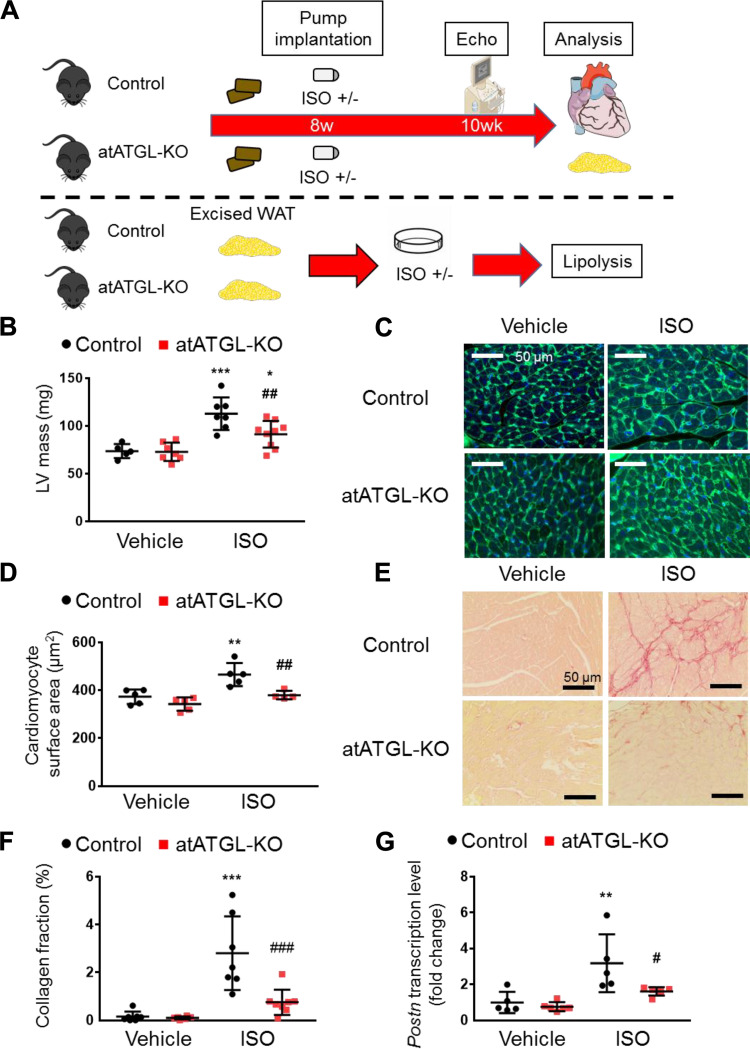
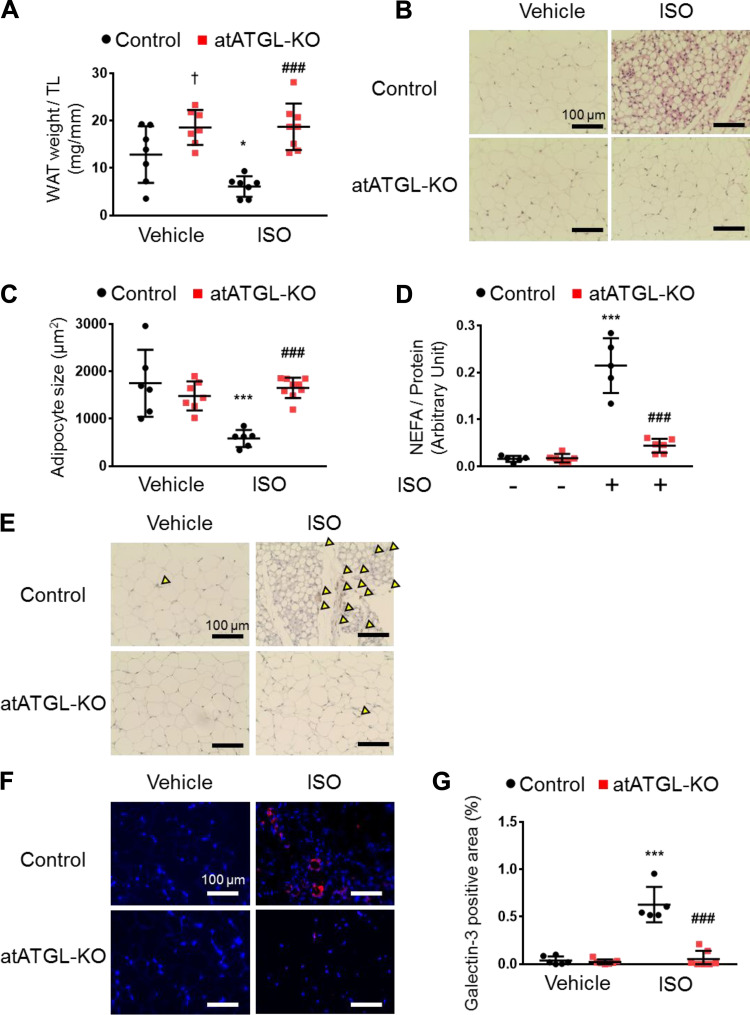
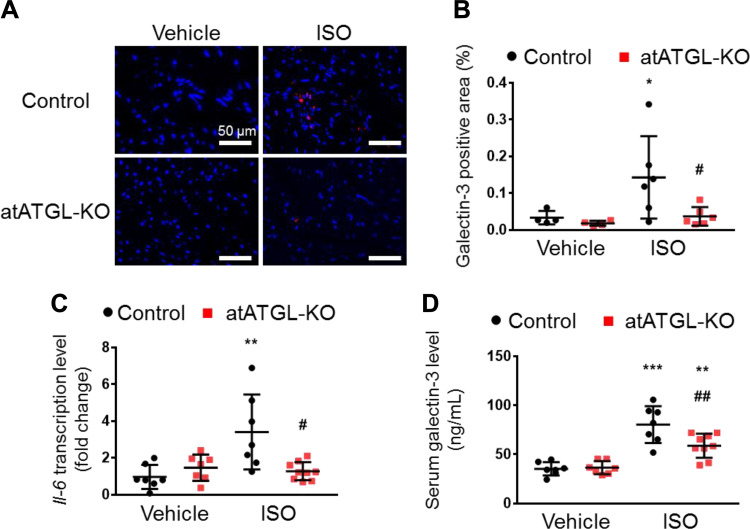
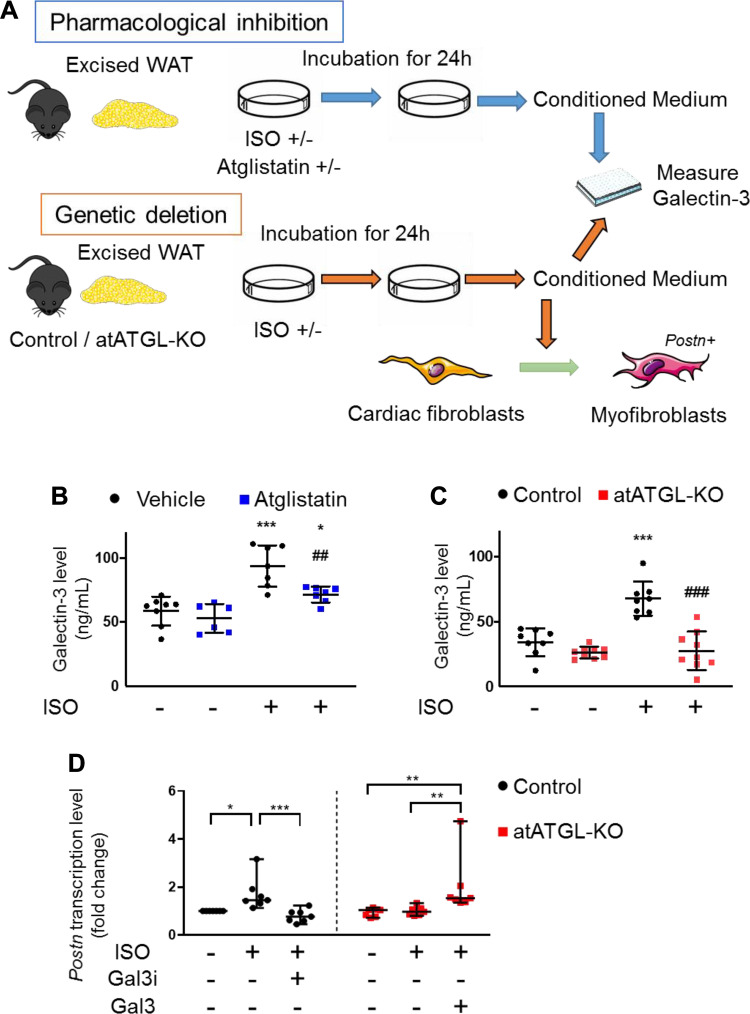
Following cardiac injury, increased adrenergic drive plays an important role in compensating for reduced cardiac function. However, chronic excess adrenergic stimulation can be detrimental to cardiac pathophysiology and can also affect other organs including adipose tissue, leading to increased lipolysis. Interestingly, inhibition of adipose triglyceride lipase (ATGL), a rate-limiting enzyme in lipolysis, in adipocytes ameliorates cardiac dysfunction in a heart failure model. Thus, we investigated whether inhibition of adipocyte ATGL can mitigate the adverse cardiac effects of chronic adrenergic stimulation and explored the underlying mechanisms. To do this, isoproterenol (ISO) was continuously administered to C57Bl/6N mice for 2 wk with or without an ATGL inhibitor (Atglistatin). We found that Atglistatin alleviated ISO-induced cardiac remodeling and reduced ISO-induced upregulation of galectin-3, a marker of activated macrophages and a potent inducer of fibrosis, in white adipose tissue (WAT), heart, and the circulation. To test whether the beneficial effects of Atglistatin occur via inhibition of adipocyte ATGL, adipocyte-specific ATGL knockout (atATGL-KO) mice were utilized for similar experiments. Subsequently, the same cardioprotective effects of atATGL-KO following ISO administration were observed. Furthermore, Atglistatin and atATGL-KO abolished ISO-induced galectin-3 secretion from excised WAT. We further demonstrated that activation of cardiac fibroblasts by the conditioned media of ISO-stimulated WAT is galectin-3-dependent. In conclusion, the inhibition of adipocyte ATGL ameliorated ISO-induced cardiac remodeling possibly by reducing galectin-3 secretion from adipose tissue. Thus, inhibition of adipocyte ATGL might be a potential target to prevent some of the adverse effects of chronic excess adrenergic drive.NEW & NOTEWORTHY The reduction of lipolysis by adipocyte ATGL inhibition ameliorates cardiac remodeling induced by chronic β-adrenergic stimulation likely via reducing galectin-3 secretion from adipose tissue. Our findings highlight that suppressing lipolysis in adipocytes may be a potential therapeutic target for patients with heart failure whose sympathetic nervous system is activated. Furthermore, galectin-3 might be involved in the mechanisms by which excessive lipolysis in adipose tissues influences remote cardiac pathologies and thus warrants further investigation.

Keywords: ATGL; adipose triglyceride lipase; cardiac remodeling; galectin-3; inflammation; isoproterenol.


Conflict of interest statement

No conflicts of interest, financial or otherwise, are declared by the authors.

Figures

Figure 1.
Figure 1.
ATGL inhibition ameliorates cardiac hypertrophy and cardiac fibrosis induced by β-adrenergic stimulation. A: schematic of the Atglistatin model. C57Bl/6N mice were allocated into two groups, fed with standard chow diet or with Atglistatin-containing diet, at 7-wk-old. At 8-wk-old, a mini-osmotic pump containing vehicle or isoproterenol (ISO) was implanted. After 2 wk, the cardiac structure and function were assessed with echocardiography, and then mice were euthanized and tissues collected for further analysis. For assessment of lipolysis, gonadal white adipose tissue (WAT) was excised from C57Bl/6N mice and incubated with or without ISO in the presence or absence of Atglistatin, and then nonesterified fatty acid levels in the medium was measured. B: corrected left ventricular (LV) mass obtained with echocardiography (n = 7–10 mice per group). C: representative images of left ventricle section stained with wheat germ agglutinin conjugated with Alexa Fluor 488 (green) and DAPI (blue). Scale bar represents 50 μm. D: surface area of cardiomyocytes (n = 4–5 mice per group). E: representative images of left ventricle section stained with Picro-Sirius Red staining. Scale bar represents 50 μm. F: proportions of Picro-Sirius Red staining-positive region (n = 9–10 mice per group). G: relative transcript levels of Postn (Periostin) in the heart (n = 9–10 mice per group), normalized to the expression of cyclophilin A. Dots represent individual values. Data are presented as the means ± SD. P values were derived by two-way ANOVA followed by Sidak’s multiple-comparisons test as post hoc. *Comparison with its own vehicle group. †Comparison of standard chow with vehicle group and Atglistatin with vehicle group. #Comparison of standard chow with ISO group to Atglistatin with ISO group. *, †P < 0.05; **, ##P < 0.01; ***, ###P < 0.001. ATGL, adipose triglyceride lipase. Figure 1A was created with art materials provided by Servier Medical Art, licensed under a Creative Common Attribution 3.0 Generic License. http://smart.servier.com/
Figure 2.
Figure 2.
Atglistatin suppresses isoproterenol (ISO)-induced macrophage infiltration and activation in white adipose tissue (WAT). A: gonadal WAT mass divided by tibial length (TL) (n = 10 per group). B: representative images of hematoxylin and eosin (H&E) staining of gonadal WAT. Scale bar represents 100 μm. C: surface area of adipocyte (n = 7–9 mice per group). D: ex vivo lipolysis by measuring nonesterified fatty acid (NEFA) with or without ISO (10 μM) and with or without Atglistatin (50 μM) (n = 7 per group). E: representative images of immunochemistry with F4/80. Yellow arrow heads indicate positive cells. Scale bar represents 100 μm. F: representative images of immunofluorescence against galectin-3 (red) and DAPI (blue) in the heart tissue. G: quantification of galectin-3-positive area (n = 5–8 mice per group). Scale bar represents 50 μm. Dots represent individual values. Data are presented as the means ± SD. P values were derived by two-way ANOVA followed by Sidak’s multiple-comparisons test as post hoc. *Comparison with its own vehicle group. †Comparison of standard chow with vehicle group and Atglistatin with vehicle group. #Comparison of standard chow with ISO group to Atglistatin with ISO group. *, †, #P < 0.05; **, ##P < 0.01; ***, †††, ###P < 0.001.
Figure 3.
Figure 3.
Pharmacological inhibition of ATGL reduces isoproterenol-induced inflammation and galectin-3 levels in the heart. A: representative images of immunofluorescence against galectin-3 (red) and DAPI (blue) in the heart tissue. B: quantification of galectin-3-positive areas (n = 5 per group). Scale bar represents 50 μm. C: transcript levels of Il-6 in the heart, normalized to cyclophilin A (n = 7–10 mice per group). D: serum levels of galectin-3 in isoproterenol (ISO)-administered mice with or without Atglistatin treatment (n = 10 mice per group). Dots represent individual values. Data are presented as means ± SD. P values were derived by two-way ANOVA followed by Sidak’s multiple-comparisons test as post. *Comparison with its own vehicle group. #Comparison of standard chow with ISO group to Atglistatin with ISO group. #P < 0.05; **P < 0.01; ***, ###P < 0.001. ATGL, adipose triglyceride lipase.
Figure 4.
Figure 4.
Genetic Atgl ablation in adipocytes ameliorates isoproterenol-induced cardiac hypertrophy and fibrosis. A: schematic of the genetic model with adipocyte-specific adipose triglyceride lipase knockout (atATGL-KO). At 8-wk-old, a mini-osmotic pump containing vehicle or isoproterenol (ISO) was implanted. After 2 wk, the cardiac structure and function were assessed with echocardiography, and then mice were euthanized and tissues were collected for further analysis. For assessment of lipolysis, gonadal white adipose tissue (WAT) was excised from atATGK-KO mice and control littermates and incubated with or without ISO, and then nonesterified fatty acid (NEFA) level in the medium was measured. B: corrected left ventricular (LV) mass obtained with echocardiography (n = 5–9 mice per group). C: representative images of LV section stained with wheat germ agglutinin conjugated with Alexa Fluor 488 (green) and DAPI (blue). Scale bar represents 50 μm. D: surface area of cardiomyocytes (n = 4–5 mice per group). E: representative images of LV section stained with Picro-Sirius Red staining. Scale bar represents 50 μm. F: proportions of Picro-Sirius Red staining-positive region (n = 6–8 mice per group). G: relative transcript levels of Postn in the heart (n = 5 per group), normalized to cyclophilin A. Dots represent individual values. Data are presented as means ± SD. P values were derived by two-way ANOVA followed by Sidak’s multiple-comparisons test as post hoc. *Comparison with its own vehicle group. #Comparison of control with ISO group to atATGL-KO with ISO group. *, #P < 0.05; **, ##P < 0.01; ***, ###P < 0.001. Figure 4A was created with art materials provided by Servier Medical Art, licensed under a Creative Common Attribution 3.0 Generic License. http://smart.servier.com/
Figure 5.
Figure 5.
Genetic Atgl ablation in adipocytes reduces isoproterenol-induced galectin-3 levels in white adipose tissue. A: gonadal white adipose tissue (WAT) mass divided by tibial length (TL) (n = 6–8 mice per group). B: representative images of hematoxylin-eosin (H&E) staining of gonadal WAT. Scale bar represents 100 μm. C: surface area of adipocytes (n = 6–9 mice per group). D: ex vivo lipolysis of WAT by measuring nonesterified fatty acid (NEFA) from control and atATGL-KO mice with or without isoproterenol (ISO) (10 μM) (n = 5–6 per group). E: representative images of immunochemistry with F4/80. Yellow arrow heads indicate positive cells. Scale bar represents 100 μm. F: representative images of immunofluorescent against galectin-3 (red) and DAPI (blue) on gonadal WAT. G: quantification of galectin-3-positive area (n = 5–7 mice per group). Scale bar represents 100 μm. Dots represent individual values. Data are presented as means ± SD. P values were derived by two-way ANOVA followed by Sidak’s multiple-comparisons test as post hoc. *Comparison with its own vehicle group. †Comparison of control with vehicle group and atATGL-KO with vehicle group. #Comparison of control with ISO group to atATGL-KO with ISO group. *, †P < 0.05; ***, ###P < 0.001.
Figure 6.
Figure 6.
Genetic deletion of Atgl in adipocyte reduces isoproterenol-induced inflammation and galectin-3 levels in the heart. A: representative images of immunofluorescent against galectin-3 (red) and DAPI (blue) in the heart tissue. B: quantification of galectin-3-positive area (n = 4–6 per group). Scale bar represents 50 μm. C: transcript levels of Il-6 in the heart normalized to cyclophilin A (n = 7–9 per group). D: serum levels of galectin-3 in isoproterenol (ISO)-administered control and atATGL-KO mice (n = 7–9 mice per group). Dots represent individual values. Data are presented as the means ± SD. P values were derived by two-way ANOVA followed by Sidak’s multiple-comparisons test as post hoc. *Comparison with its own vehicle group. #Comparison of control with ISO group to atATGL-KO with ISO group. *, #P < 0.05; **, ##P < 0.01; ***P < 0.001.
Figure 7.
Figure 7.
Adipocyte ATGL inhibition reduces isoproterenol-induced galectin-3 secretion from excised white adipose tissue. A: schematics of ex vivo experiment of ISO stimulation on excised white adipose tissue (WAT). B: galectin-3 levels in the media from the pharmacological inhibition model (n = 6–7 per group). C: galectin-3 levels in the media from the genetic deletion model (n = 8–9 mice per group). D: transcript levels of Postn, normalized to ribosomal protein L32, in cardiac fibroblasts treated with the conditioned media of WAT from control and atATGL-KO mice in the presence or absence of isoproterenol (ISO), N-acetyl-d-lactosamine (Gal3i) (10 μM) or the recombinant murine galectin-3 (Gal3) (60 ng/mL) (n = 7 per group). Dots represent individual values. Data are presented as the means ± SD in B and C the median ± 95% CI in D. P values were derived by two-way ANOVA followed by Sidak’s multiple-comparisons test in (B) and (C) and Kruskal–Wallis test followed by Dunn’s multiple-comparisons test in (D). *Comparison with its own vehicle group. #Comparison of control with ISO group to atATGL-KO with ISO group in (B) and (C). *P < 0.05; **, ##P < 0.01; ***, ###P < 0.001. ATGL, adipose triglyceride lipase. Figure 7A was created with art materials provided by Servier Medical Art, licensed under a Creative Common Attribution 3.0 Generic License. http://smart.servier.com/

References

    1. Jackson G, Gibbs CR, Davies MK, Lip GY. ABC of heart failure. Pathophysiology. BMJ 320: 167–170, 2000. doi:10.1136/bmj.320.7228.167. - DOI - PMC - PubMed
    1. Lymperopoulos A, Rengo G, Koch WJ. Adrenergic nervous system in heart failure: pathophysiology and therapy. Circ Res 113: 739–753, 2013. [Erratum in Circ Res 2016 Aug 5; 119(4):e38]. doi:10.1161/CIRCRESAHA.113.300308. - DOI - PMC - PubMed
    1. Bezaire V, Langin D. Regulation of adipose tissue lipolysis revisited. Proc Nutr Soc 68: 350–360, 2009. doi:10.1017/S0029665109990279. - DOI - PubMed
    1. Lass A, Zimmermann R, Oberer M, Zechner R. Lipolysis—a highly regulated multi-enzyme complex mediates the catabolism of cellular fat stores. Prog Lipid Res 50: 14–27, 2011. doi:10.1016/j.plipres.2010.10.004. - DOI - PMC - PubMed
    1. Shimizu I, Yoshida Y, Katsuno T, Tateno K, Okada S, Moriya J, Yokoyama M, Nojima A, Ito T, Zechner R, Komuro I, Kobayashi Y, Minamino T. p53-induced adipose tissue inflammation is critically involved in the development of insulin resistance in heart failure. Cell Metab 15: 51–64, 2012. [Erratum in Cell Metab 2012 May 2; 15(5):787]. doi:10.1016/j.cmet.2011.12.006. - DOI - PubMed

Publication types

MeSH terms